
1. Background
For several years, studies have argued that mental health in medical schools is a considerable issue. Psychiatric problems are more prevalent among medical students than the rest of the population (1) or other students (2). A meta-analysis suggested the prevalence of depressive symptoms to be 27.2 % among medical students, ranging from 9.3 to 55.9 (3). Various reasons have been proposed for this situation: Heavy shift work, academic pressure, workload, sleep deprivation, and stiff competition (4). Further, poor mental health conditions can lead to irreparable consequences such as excessive alcohol consumption, tobacco, and problematic substance use (5, 6).
Studies from Iran have reported the prevalence of mental health issues as high as 52.1% among medical students (7, 8). A deeper understanding of its contributing variables can pave the way to alleviating this condition. While a large body of literature has focused on extrinsic factors such as not having appropriate access to mental health services (9, 10), less attention has been given to the root elements that lie within the students. In addition, the findings of such studies are inconsistent. Many studies have reported significantly better men's mental health than women's (7, 11); however, some did not (2, 12). Controversial results are also reported regarding the relationship between mental health and socioeconomic and marital status (7, 12). Reasonably, however, these associations might be context-dependent, not universal, so they must be investigated in any given context.
2. Objectives
In light of this information, this study examined the mental health status and explored its demographic gradients among medical interns.
3. Methods
This cross-sectional study was conducted at Shahid Beheshti University of Medical Sciences (SBMU), Tehran, Iran, in 2020 - 2021. The Ethics Committee approved the study (IR.SBMU.PHNS.REC.1399.156), and written informed consent was obtained.
3.1. Study the Population
All medical interns (6th and 7th-year students) were included in the study. Questionnaires were handed to all medical interns. Of 430 interns, 358 completed the questionnaires (a response rate of 83.25%).
3.2. Study Protocol
The two-part questionnaire consisted of a) demographic and personal factors and b) Goldberg's General Health Questionnaire (GHQ-28) for mental health evaluation (13). The GHQ-28 questionnaire comprises four subscales; (1) somatic symptoms (subscale A); (2) anxiety and insomnia (subscale B); (3) social dysfunction (subscale C); and (4) severe depression (subscale D). The more the score, the worse the mental health outcome. Based on previous studies on the Iranian population, the cut-off point of 24 scores (reliability of 0.9, the validity of 0.78, and Cronbach's alpha of 0.97) indicated poor mental health (14).
3.3. Statistical Analysis
Categorical variables were compared using the Chi-squared test and are presented as frequency (percentages). Normally-distributed continuous variables were compared using the Student's- t test and are reported as mean ± SD. Skewed continuous variables were compared using the Mann-Whitney U test and are reported as median (25th - 75th percentiles). Normality was tested using the Kolmogorov-Smirnov test. Univariate and multivariable binary logistic regressions were used to identify the factors associated with GHQ > 28 (poor mental health), which are reported with odds ratios (OR), 95% confidence intervals (CI), and P values. Since no cut-offs were proposed for subscales, linear regression was used to evaluate factors associated with lower scores in each subscale, and the findings are presented as beta coefficients and standard error (SE). SPSS version 21 was used, and P < 0.05 was considered significant.
4. Results
4.1. Baseline Characteristics
The study population aged 25.43 ± 2.31, with 50.5% females. Most of the students had started their internship more than one year, lived with their families, had no underlying disease, and were from middle economic groups. While 45.8% of the students had a high interest in medicine, only 17% and 26.5% had high hope for career prospects and personal life satisfaction, respectively (Table 1).
Table 1.
Baseline Characteristics of the Study Population a
| Variables | Total (N = 358) | GHQ < 24 (N = 137, 38.3%) | GHQ ≥ 24 (N = 221, 61.7%) | P-Value |
|---|---|---|---|---|
| Age | 25.43 ± 2.31 | 25.37 ± 2.33 | 25.46 ± 2.31 | 0.724 |
| Gender | 0.026 | |||
| Male | 177 (49.4) | 78 (56.9) | 99 (44.8) | |
| Female | 181 (50.5) | 59 (43.1) | 122 (55.2) | |
| Internship months | 0.087 | |||
| ≤ 6 | 71 (19.8) | 20 (14.6) | 51 (23.1) | |
| 6 - 12 | 60 (16.7) | 21 (15.3) | 39 (17.6) | |
| 12 - 24 | 227 (63.4) | 96 (70.1) | 131 (59.3) | |
| Hometown | 0.328 | |||
| Tehran | 179 (50) | 64 (46.7) | 115 (52) | |
| Others | 179 (50) | 73 (53.3) | 106 (48) | |
| Economic status | 0.133 | |||
| Poor/middle | 206 (57.5) | 72 (52.6) | 134 (60.6) | |
| Good | 152 (42.5) | 65 (47.4) | 87 (39.4) | |
| Marital status | 0.975 | |||
| Single | 295 (82.4) | 113 (82.5) | 182 (82.4) | |
| Married | 63 (24.4) | 24 (17.5) | 39 (17.6) | |
| Current department | 0.167 | |||
| Emergency/Surgery | 62 (17.3) | 23 (16.8) | 39 (17.6) | |
| Internal medicine b | 139 (38.8) | 55 (40.1) | 84 (38) | |
| Pediatric | 23 (6.42) | 5 (3.6) | 18 (8.1) | |
| Gynecology | 22 (6.14) | 5 (3.6) | 17 (7.7) | |
| Others | 112 (31.3) | 49 (35.8) | 63 (28.5) | |
| Accommodation | 0.528 | |||
| Dormitory | 64 (17.9) | 29 (21.2) | 35 (15.8) | |
| Home with family | 217 (60.6) | 82 (59.9) | 135 (61.1) | |
| Home with friends | 14 (3.9) | 4 (2.9) | 10 (4.5) | |
| Home alone | 63 (17.6) | 22 (16.1) | 41 (18.6) | |
| Interest in medicine | 0.015 | |||
| Low | 30 (8.4) | 9 (6.6) | 21 (9.5) | |
| Medium | 164 (45.8) | 52 (38.0) | 112 (50.7) | |
| High | 164 (45.8) | 76 (55.5) | 88 (39.8) | |
| Hope for career prospects | < 0.001 | |||
| Low | 94 (26.3) | 16 (11.7) | 78 (35.3) | |
| Medium | 203 (56.7) | 83 (60.6) | 120 (54.3) | |
| High | 61 (17.0) | 38 (27.7) | 23 (10.4) | |
| Personal life satisfaction | < 0.001 | |||
| Low | 67 (18.7) | 7 (5.1) | 60 (27.1) | |
| Medium | 196 (54.7) | 69 (50.4) | 127 (57.5) | |
| High | 95 (26.5) | 61 (44.5) | 34 (15.4) | |
| Physical/mental disease | 0.042 | |||
| Yes | 66 (18.4) | 18 (13.1) | 48 (21.7) | |
| No | 292 (81.6) | 119 (86.9) | 173 (78.3) |
Abbreviation: GHQ, General Health Questionnaire.
a Values are expressed as No. (%) or mean ± SD.
bInternal medicine, cardiology, infectious diseases, and toxicology.
The total GHQ score was 30.09 ± 14.45 out of 84, with the worse condition for subscale B (anxiety and insomnia, 8.93 ± 5.03 out of 21). Among the study population, 61.7% had poor mental health. Those in the poor mental health group were significantly more likely to be females, have diseases, and have low interest, hope, and satisfaction (Table 1).
4.2. Factors Associated with GHQ Score Equal or Greater Than 24
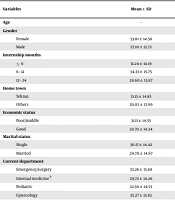
Table 2 presents the factors associated with poor mental health.
Table 2.
Mean General Health Questionnaire Scores and Factors Associated with GHQ Equal or Greater Than 24
| Variables | Mean ± SD | Unadjusted Model | Adjusted Model | ||
|---|---|---|---|---|---|
| OR (95% CI) | P-Value | OR (95%CI) | P-Value | ||
| Age | - | 1.02 (0.93 - 1.12) | 0.723 | NA a | NA |
| Gender | |||||
| Female | 33.01 ± 14.58 | 1.64 (1.06 - 2.50) | 0.026 | 1.78 (1.12 - 2.85) | 0.015 |
| Male | 27.10 ± 13.72 | Reference | Reference | ||
| Internship months | |||||
| ≤ 6 | 31.24 ± 14.19 | 1.87 (1.05 - 3.34) | 0.035 | NA | NA |
| 6 - 12 | 34.33 ± 15.75 | 1.36 (0.75 - 2.46) | 0.308 | NA | NA |
| 12 - 24 | 28.60 ± 13.97 | Reference | NA | NA | |
| Home town | |||||
| Tehran | 31.15 ± 14.85 | 1.24 (0.80 - 1.89) | 0.328 | NA | NA |
| Others | 29.03 ± 13.99 | Reference | NA | NA | |
| Economic status | |||||
| Poor/middle | 31.11 ± 14.55 | 1.39 (0.90 - 2.14) | 0.133 | NA | NA |
| Good | 28.70 ± 14.24 | Reference | NA | NA | |
| Marital status | |||||
| Single | 30.17 ± 14.42 | 0.99 (0.56 - 1.73) | 0.975 | NA | NA |
| Married | 29.70 ± 14.67 | Reference | NA | NA | |
| Current department | |||||
| Emergency/surgery | 33.26 ± 15.88 | 1.32 (0.70 - 2.49) | 0.394 | NA | NA |
| Internal medicine b | 29.72 ± 14.26 | 1.19 (0.72 - 1.97) | 0.504 | NA | NA |
| Pediatric | 32.30 ± 14.55 | 2.80 (0.97 - 8.07) | 0.057 | NA | NA |
| Gynecology | 35.27 ± 13.62 | 2.64 (0.91 - 7.67) | 0.073 | NA | NA |
| Others | 27.31 ± 13.53 | Reference | NA | NA | |
| Accommodation | |||||
| Dormitory | 26.42 ± 12.05 | 0.65 (0.32 - 1.32) | 0.648 | NA | NA |
| Home with family | 30.61 ± 15.04 | 0.88 (0.49 - 1.59) | 0.883 | NA | NA |
| Home with friends | 28.93 ± 11.63 | 1.34 (0.38 - 4.778) | 0.377 | NA | NA |
| Home alone | 32.27 ± 14.77 | Reference | NA | NA | |
| Interest in medicine | |||||
| Low | 31.67 ± 13.76 | 2.02 (0.87 - 4.66) | 0.102 | NA | NA |
| Medium | 33.24 ± 14.893 | 1.86 (1.18 - 2.92) | 0.007 | NA | NA |
| High | 26.65 ± 13.389 | Reference | NA | NA | |
| Hope for career prospects | |||||
| Low | 37.98 ± 15.87 | 8.05 (3.82 - 16.99) | < 0.001 | 4.09 (1.80 - 9.23) | 0.001 |
| Medium | 28.63 ± 12.96 | 2.39 (1.33 - 4.30) | 0.004 | 1.61 (0.85 - 3.07) | 0.147 |
| High | 22.77 ± 11.27 | Reference | Reference | ||
| Personal life satisfaction | |||||
| Low | 42.13 ± 13.92 | 15.38 (6.33 - 37.38) | < 0.001 | 10.94 (4.33 - 27.66) | < 0.001 |
| Medium | 30.18 ± 13.38 | 3.30 (1.98 - 5.50) | < 0.001 | 2.55 (1.47 - 4.42) | 0.001 |
| High | 21.40 ± 10.29 | Reference | Reference | ||
| Physical/mental disease | |||||
| Yes | 36.73 ± 16.27 | 1.83 (1.02 - 3.31) | 0.044 | NA | NA |
| No | 28.59 ± 13.59 | Reference | NA | NA | |
a Not applicable (NA) indicates that the variable was not included in the multivariable regression equation.
bInternal medicine, cardiology, infectious diseases, and toxicology.
Female gender, internship month ≤ 6, medium interest in medicine, low and medium hope for career prospects, low and medium personal life satisfaction, and having diseases were significantly associated with poor mental health at the univariable level. After adjustments, the following variables were significant factors associated with poor mental health: Female gender (adjusted-OR: 1.78, 95% CI: 1.12 - 2.86), low hope for career prospects (adjusted-OR: 4.09, 95% CI: 1.80 - 9.23), and low and medium personal life satisfaction (adjusted-OR: 10.94, 95% CI: 4.33 - 27.66; adjusted-OR: 2.55, 95% CI: 1.47 - 4.42, respectively).
4.3. Factors Associated with Subscale Scores
Table 3 presents the mean score of each subscale and the factors associated with subscale scores at the multivariable level. Across all subscales, dormitory residence was a significant protective factor, while low and medium hope for career prospects and low personal life satisfaction were significant hazardous factors. Female sex, medium level of personal life satisfaction, and having diseases significantly deteriorated mental health outcomes across three subscales. Many other variables were associated with at least one subscale (Table 3). No significant relationship existed between hometown, economic, marital status, and any subscales at the adjusted level.
Table 3.
Mean General Health Questionnaire Subscale Scores and Factors Associated with Each Subscale
| Variables | Subscale A (Somatic Symptoms) | Subscale B (Anxiety and Insomnia) | Subscale C (Social Dysfunction) | Subscale D (Severe Depression) | ||||||||
|---|---|---|---|---|---|---|---|---|---|---|---|---|
| Descriptivea | Adjusted Modelb | P-Value | Descriptivea | Adjusted Modelb | P-Value | Descriptivea | Adjusted Modelb | P-Value | Descriptivea | Adjusted Modelb | P-Value | |
| Total | 7.23 ± 4.22 | - | - | 8.93 ± 5.03 | - | - | 8.87 ± 3.59 | - | - | 5.06 ± 4.69 | - | - |
| Gender | ||||||||||||
| Female | 8.43 ± 3.98 | 2.41 ± 0.41 | < 0.001 | 9.94 ± 4.98 | 2.02 ± 0.49 | < 0.001 | 9.08 ± 3.80 | NA c | NA | 5.55 ± 5.01 | 1.10 ± 0.43 | 0.010 |
| Male | 6.00 ± 4.11 | Reference | 7.89 ± 4.88 | Reference | 8.66 ± 3.37 | NA | NA | 4.55 ± 4.30 | Reference | - | ||
| Internship months | ||||||||||||
| ≤ 6 | 7.44 ± 4.02 | NA | NA | 9.93 ± 5.38 | NA | NA | 8.72 ± 3.57 | NA | NA | 5.15 ± 4.82 | NA | NA |
| 6 - 12 | 8.63 ± 4.84 | 1.84 ± 0.55 | 0.001 | 10.00 ± 5.28 | NA | NA | 9.97 ± 3.68 | NA | NA | 5.73 ± 4.75 | NA | NA |
| 12 - 24 | 6.79 ± 4.04 | Reference | - | 8.33 ± 4.77 | NA | NA | 8.63 ± 3.54 | NA | NA | 4.85 ± 4.64 | NA | NA |
| Hometown | ||||||||||||
| Tehran | 7.63 ± 4.41 | NA | NA | 9.35 ± 5.08 | NA | NA | 8.96 ± 3.58 | NA | NA | 5.22 ± 4.86 | NA | NA |
| Others | 6.83 ± 4.00 | NA | NA | 8.51 ± 4.96 | NA | NA | 8.79 ± 3.61 | NA | NA | 4.89 ± 4.53 | NA | NA |
| Economic status | ||||||||||||
| Poor/middle | 7.31 ± 4.24 | NA | NA | 9.23 ± 4.96 | NA | NA | 9.05 ± 3.59 | NA | NA | 5.51 ± 4.83 | NA | NA |
| Good | 7.12 ± 4.20 | NA | NA | 8.52 ± 5.11 | NA | NA | 8.62 ± 3.59 | NA | NA | 4.43 ± 4.45 | NA | NA |
| Marital status | ||||||||||||
| Single | 7.17 ± 4.25 | NA | NA | 8.88 ± 5.01 | NA | NA | 9.01 ± 3.68 | NA | NA | 5.11 ± 4.69 | NA | NA |
| Married | 7.49 ± 4.10 | NA | NA | 9.16 ± 5.15 | NA | NA | 8.24 ± 3.09 | NA | NA | 4.81 ± 4.75 | NA | NA |
| Current department | ||||||||||||
| Emergency/surgery | 8.23 ± 4.59 | NA | NA | 9.92 ± 4.94 | NA | NA | 9.15 ± 3.94 | NA | NA | 5.97 ± 4.87 | NA | NA |
| Internal medicine d | 7.15 ± 4.04 | NA | NA | 8.58 ± 5.04 | NA | NA | 8.83 ± 3.69 | NA | NA | 5.16 ± 4.72 | NA | NA |
| Pediatrics | 8.57 ± 4.60 | NA | NA | 10.00 ± 4.97 | NA | NA | 8.52 ± 2.81 | NA | NA | 5.22 ± 4.81 | NA | NA |
| Gynecology | 7.64 ± 4.02 | NA | NA | 11.77 ± 5.55 | 3.29 ± 1.05 | 0.002 | 10.55 ± 3.50 | 1.65 ± 0.75 | 0.028 | 5.32 ± 4.52 | NA | NA |
| Others | 6.42 ± 4.06 | NA | NA | 8.04 ± 4.72 | Reference | 8.51 ± 3.38 | Reference | 4.34 ± 4.55 | NA | NA | ||
| Accommodation | ||||||||||||
| Dormitory | 5.80 ± 3.56 | -2.60 ± 0.66 | < 0.001 | 7.97 ± 4.75 | -2.06 ± 0.79 | 0.010 | 8.42 ± 3.08 | -1.11 ± 0.56 | 0.047 | 4.23 ± 4.08 | -1.61 ± 0.70 | 0.022 |
| Home with family | 7.51 ± 4.22 | NA | NA | 9.16 ± 5.24 | NA | NA | 8.87 ± 3.75 | NA | NA | 5.07 ± 4.80 | NA | NA |
| Home with friends | 6.21 ± 2.99 | -2.24 ± 1.10 | 0.042 | 7.43 ± 4.42 | -3.06 ± 1.32 | 0.021 | 9.00 ± 3.09 | NA | NA | 6.29 ± 5.62 | NA | NA |
| Home alone | 7.95 ± 4.76 | Reference | 9.46 ± 4.56 | Reference | 9.30 ± 3.65 | Reference | 5.56 ± 4.66 | Reference | ||||
| Interest in medicine | ||||||||||||
| Low | 7.73 ± 4.53 | NA | NA | 9.53 ± 5.44 | NA | NA | 9.03 ± 2.98 | -1.36 ± 0.67 | 0.043 | 5.37 ± 4.00 | -1.68 ± 0.83 | 0.044 |
| Medium | 7.61 ± 4.37 | NA | NA | 9.96 ± 4.938 | NA | NA | 9.57 ± 3.77 | NA | NA | 6.10 ± 4.87 | NA | NA |
| High | 6.76 ± 3.98 | NA | NA | 7.79 ± 4.823 | NA | NA | 8.15 ± 3.39 | Reference | 3.96 ± 4.41 | Reference | ||
| Hope for career prospects | ||||||||||||
| Low | 8.61 ± 4.75 | 1.95 ± 0.68 | 0.004 | 11.31 ± 5.28 | 2.82 ± 0.81 | 0.001 | 10.40 ± 3.89 | 2.06 ± 0.59 | 0.001 | 7.66 ± 5.07 | 2.26 ± 0.74 | 0.002 |
| Medium | 7.05 ± 3.96 | NA | NA | 8.44 ± 4.64 | NA | NA | 8.73 ± 3.28 | 1.08 ± 0.50 | 0.031 | 4.41 ± 4.35 | NA | NA |
| High | 5.69 ± 3.60 | Reference | 6.90 ± 4.57 | Reference | 6.98 ± 3.14 | Reference | 3.20 ± 3.46 | Reference | ||||
| Personal life satisfaction | ||||||||||||
| Low | 9.15 ± 4.69 | 2.32 ± 0.67 | 0.001 | 12.34 ± 4.47 | 4.30 ± 0.77 | 0.001 | 11.64 ± 3.79 | 4.08 ± 0.57 | < 0.001 | 9.00 ± 5.05 | 5.84 ± 0.72 | < 0.001 |
| Medium | 7.38 ± 4.05 | 1.33 ± 0.49 | 0.008 | 8.72 ± 4.70 | NA | NA | 8.97 ± 3.21 | 1.75 ± 0.42 | < 0.001 | 5.10 ± 4.34 | 2.33 ± 0.53 | < 0.001 |
| High | 5.56 ± 3.57 | Reference | 6.96 ± 4.89 | Reference | 6.71 ± 2.72 | 2.18 ± 2.70 | Reference | |||||
| Physical/mental disease | ||||||||||||
| Yes | 8.86 ± 4.49 | 1.69 ± 0.53 | 0.001 | 10.41 ± 5.34 | NA | NA | 10.32 ± 3.96 | 1.03 ± 0.45 | 0.022 | 7.14 ± 5.36 | 1.40 ± 0.56 | 0.013 |
| No | 6.86 ± 4.08 | Reference | 8.60 ± 4.90 | NA | NA | 8.54 ± 3.43 | Reference | 4.59 ± 4.40 | Reference | |||
a Value are presented as mean ± SD.
bValue are presented as β ± SE.
c Not applicable (NA) indicates that the variable was not included in the multivariable regression equation.
dInternal medicine, cardiology, infectious diseases, and toxicology.
5. Discussion
Students in healthcare-related courses are more prone to mental issues, and medical students are among the most susceptible groups (15). We found that 61.7% of medical interns suffered from poor mental health. There was also a significant gradient of mental health according to some demographic/personal characteristics; female gender, low hope for career prospects, and low/medium personal life satisfaction contributed to poor mental health. Anxiety and Insomnia were the most unfavorable subscales, followed by social dysfunction, somatic symptoms, and severe depression.
The prevalence of 61.7% poor mental health among our medical interns was above that reported by Bahreinian and Nourali (52.1 %) with the same source population as ours 20 years ago (7) and Farahangiz et al. (54.4 %) on medical students of a different medical university in Iran (12). These numbers among medical students are alarmingly higher than that of the general young adult Iranian population (17.6 % for 17 - 24 years and 19.8% for 25 - 44 years) (16). Studies in other countries have reported a lower prevalence of mental health disorders among medical students; 20.9% in Nepal (17), 46.7% in Brazil (18), and 46.2% in Saudi Arabia (15). The variation in severity and prevalence of mental issues, in general, and in each subscale, might originate from different methods (GHQ-28, GHQ-12, DASS-21, BDI), cultural factors, the type of educational curriculum, and the educational environment.
Notably, the alarming prevalence of poor mental health among medical students is a wake-up call for university officials to take up the baton and focus on active surveillance rather than waiting for students to approach and seek help.
5.1. Factors Associated with Poor Mental Health in Medical Students
Studying contributors to poor mental health can pave the way for providing specialized support for doctors in their early careers and establishing a tailored curriculum that suits the specific needs of each individual. The fact that mental health issues are highly stigmatized among medical students acts as a major barrier to seeking professional care (9), hence the necessity of active surveillance rather than waiting for individuals to come and seek help.
Our findings chime in with many studies reporting a significant relationship between male gender (7, 11), dormitory accommodation (2, 8), higher interest in the field of study (7, 12), satisfaction with life (8), hope for career prospects (7, 19), and being disease-free (8) with favorable mental health outcomes.
Our study revealed that the female gender enhances the risk of poor mental health by 78%. The gender of medical students is a critical but often ignored influencing aspect, especially in Iran. Although numerous national and international studies convince us this gender difference is not a site-specific or regional issue (4, 7, 11, 20), gender-oriented interventions are not yet applied in medical universities. Studies have reported higher depressiveness (21), demoralization, exhaustion, and negative social life perception among female medical students (22). It is, however, important to note that emotional distress in males and females is usually represented differently. While females express Depression, Anxiety, and somatic symptoms, males tend to present aggression and problematic substance and alcohol use more frequently (23). The GHQ-28 questionnaire used in our study, along with many other tools, seems to mainly focus on those aspects of mental health that are mostly perceived as feminine type. Therefore, it is plausible that females' distress has been overestimated, whereas that of males has remained underestimated.
Several explanations exist for sex disparities in mental health. Iran's medical education system is still a dominant patriarchal environment and involves gender inequity (24). Further, studies have shown that academic opportunities for females and males can differ in health-related professions (25), with higher unemployment rates among female physicians (26). Reasonably, eliminating the patriarchal atmosphere by providing equal respect and career opportunities for both genders can alleviate this disparity. Besides the implications of such extrinsic factors on mental health, inherent characteristics specific to each sex might also play a role, such as discrete gender-related personality traits and coping mechanisms (27). Further, women and men tend to adopt dissimilar learning styles; male students are more inclined to the converging learning style, which is inversely associated with depressive symptoms (21).
In contrast to many other studies (7, 18), we did not find an association between poor economic status and mental health. These incompatibilities might stem from the self-report nature and different categorizations of income groups. In our study, interns in their first months of internship exhibited poorer outcomes in some subscales compared to those spending their last months. As interns go forward in their training courses, they possibly gain more self-esteem, which has been reported to affect mental health positively (28). In agreement with others (2, 8), we found a better mental health status for dormitory-residing interns and those living with friends compared to living alone. When surrounded by family and friends and in case of difficulties, these students can have a higher chance of seeking family and friends' support and displaying extroversion, both of which have been evinced to reduce stress and depression (9, 27). Therefore, teaming up the students living alone for curricular and extracurricular activities might alleviate their mental health.
Last but not least, our study indicated that high levels of hope for career prospects and personal life satisfaction were protective against poor mental health. Students' prospects might be boosted if their salaries were increased and they were offered different job opportunities instead of just residency programs. Additionally, engaging students in extracurricular and recreational programs inside or outside the university campus can lead to higher satisfaction with their personal life.
The present study is limited by its observational, single-center, and cross-sectional design. Further, mental health was assessed using the GHQ-28 questionnaire, which is not tailored to healthcare providers. Moreover, our study failed to evaluate whether the findings gathered using this questionnaire are compatible with those from clinical interviews with a psychiatrist. Nevertheless, the GHQ-28 is still a feasible and reliable tool widely used.
Our findings indicate that the mental health status of Iranian medical interns is far from favorable. Unfortunately, these calls have largely remained unheeded despite various calls for action. We found a demographic and personal characteristic gradient in mental health that can help identify risk factors and, therefore, high-priority groups for mental health promotion interventions. In the next step, there is an urgent need for curricular and extracurricular programs tailored to the differentiated needs of various demographic groups.