
1. Background
Type 2 diabetes is characterized by glucose intolerance and insulin resistance. It has become a public health problem due to increasing prevalence and possible complications (1, 2). Numerous cytokines can affect insulin sensitivity and glucose metabolism. Resistin is secreted by fat cells and is associated with abnormal metabolism in diabetes (3). Although there is a strong relationship between increasing insulin resistance and increasing resistin in obese people, resistin is also produced in inflammatory conditions and macrophages (4-6). One of the most significant microvascular complications of diabetes is diabetic nephropathy, which ultimately leads to complete loss of kidney function. Studies have shown the role of genetics and the environment in diabetic nephropathy (7). Diabetic nephropathy affects 30% of people with type 1 diabetes and 25% - 40% of people with type 2 diabetes. The main features of this disorder include a steady increase in urinary albumin, an increase in arterial blood pressure, and a progressive decrease in glomerular filtration rate. Diabetic nephropathy is one of the main factors in the development of end-stage renal disease (ESRD), affecting mortality and quality of life of patients. Thus, the probability of death from kidney disease in diabetics is 17 times higher than in non-diabetics (8). Numerous studies have shown a relationship between resistin level and obesity and insulin resistance in people with type 2 diabetes (9, 10). Studies also show that high serum resistance levels are associated with decreasing renal function in the general population (11). To date, many studies have focused on the relationship between serum resistin level and diabetic nephropathy in diabetic patients. In 2013, Satti et al. (12) examined the relationship between plasma resistin levels and diabetic nephropathy in Saudi patients. In this study, resistin level was higher in nephropathy patients compared to other complications of diabetes. Resistin level was also related to proinflammatory adipokines and renal impairment (12). In 2017, a study conducted by Cebeci et al. (13) showed that the main determinants of serum resistin level in patients with type 2 diabetes are renal function, inflammation, obesity, and insulin resistance. Resistin level had a significant inverse relation with estimated glomerular filtration rate and albumin content (13).
2. Objectives
It seems that knowing the different levels of resistin in patients with nephropathy can help diagnose and treat these patients. To date, no studies have conducted the relationship between serum resistin level and diabetic nephropathy in Iran. Therefore, the current study aimed to investigate the relationship between serum resistance and diabetic nephropathy in patients referring to Imam Reza Hospital during 2018 and 2019.
3. Methods
This case-control study was performed during 2018 and 2019 (January 2018 to November 2019) at Imam Reza Aja Hospital in Tehran. After selecting the subjects, we informed them about the purpose and method of research implementation and asked them to sign a written consent and fill out a medical health questionnaire. Inclusion criteria included patients with nephropathy assessed by measuring glomerular filtration rate. The total sample size was 89 people divided into three groups: 29 type-2 diabetic patients without nephropathy, 30 type 2 diabetic patients with some degree of diabetic nephropathy, and 30 healthy individuals. In this study, we collected 24-hour urine for urine protein and creatinine and then determined the amount of glomerular filtration in each patient according to the formula. After collection, the samples were transferred to a physiology laboratory, and serum samples were tested using an ELISA laboratory kit. During this study, we conducted blood sampling in one step and after 8 to 10 hours of fasting. Before each blood sampling, the subjects rested for a few minutes while sitting and then received 10 cc of blood from their cubital vein in the shortest time, respectively. Finally, after blood sampling, we put the samples at room temperature for 20 minutes to coagulate and then centrifuge the tubes containing the samples for 20 minutes at 3000 rpm. This serum was maintained at -80°C. To measure the concentration of resistin and creatinine, we used its commercial ELISA kit made by Bioassay Technology Laboratory (Shanghai, China). 24-hour urine samples were collected in a special container and examined after being transferred to the laboratory. Data were analyzed using SPSS software version 23 using the Pearson correlation test. ANOVA statistical analysis and Tukey’s test and P < 0.05 were considered significant.
This study has been approved by the ethics code IR.AJAUMS.REC.1398.206 in the ethics committee of AJA University of Medical Sciences, and it is in accordance with the principles of the Helsinki Declaration.
4. Results
The youngest participant in this experiment was 28 years old, and the oldest was 85 years old; the mean age of all subjects was 59.13 ± 15.067 years. Also, the mean body mass index of the participants was 27.1 ± 0.8. In this study, 43 (48.3%) of the participants were male, and 46 (51.7%) were female.
The mean serum resistin was significantly different between the study groups (P = 0.032, F = 3.600). Tukey supplementary test showed that the amount of resistin in the diabetic group with nephropathy was critically higher than the control group and healthy individuals. Although serum resistin level was higher in the diabetic group than in healthy individuals, there were no significant relationships between the groups. Serum creatinine level in diabetic patients with nephropathy was significantly higher than diabetic patients without nephropathy and healthy people (P = 0.000, F = 42.791). Also, the rate of glomerular filtration in diabetic patients with nephropathy was significantly higher than in healthy and diabetic individuals (P = 0.000, F = 209.895), but there was no difference between healthy and diabetic individuals without nephropathy. Fasting blood sugar level in the diabetic group without nephropathy and in the diabetic group with nephropathy was critically higher than in healthy people (Table 1).
| Variable | Healthy | Diabetes | Diabetes + Nephropathy | F and P |
|---|---|---|---|---|
| Resistin, ng/L | 320.6 ± 108.1 | 479.9 ± 210.6 | 1210.0 ± 358.5*, # | F = 3.600; P = 0.032 |
| Serum Cr, mg/dL | 0.79 ± 0.04 | 0.97 ± 0.03 | 2.04 ± 0.17*, # | F = 42.791; P = 0.000 |
| Fasting BS, mg/dL | 82.3 ± 2.00 | 173.5 ± 13.6* | 182.0 ± 16.6* | F = 19.051; P = 0.000 |
| BMI, kg/m2 | 25.7 ± 0.5 | 27.8 ± 1.0 | 27.8 ± 0.9 | F = 2.200; P = 0.117 |
| Hb A1C, % | - | 8.20 ± 0.43 | 11.40 ± 2.54 | - |
| GFR, mL/min | 100.8 ± 2.0 | 99.6 ± 3.2 | 32.7 ± 2.9*, # | F = 209.895; P = 0.000 |
aValues are expressed as mean ± SD.
bData were analyzed by ANOVA statistical analysis and Tukey supplementary test. * and # indicate a significant difference with P < 0.05 with the control group and diabetics.
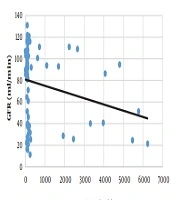
There was a weak inverse relationship between glomerular filtration rate and serum resistin level (P = 0.031, r = -0.233) (Figure 1).
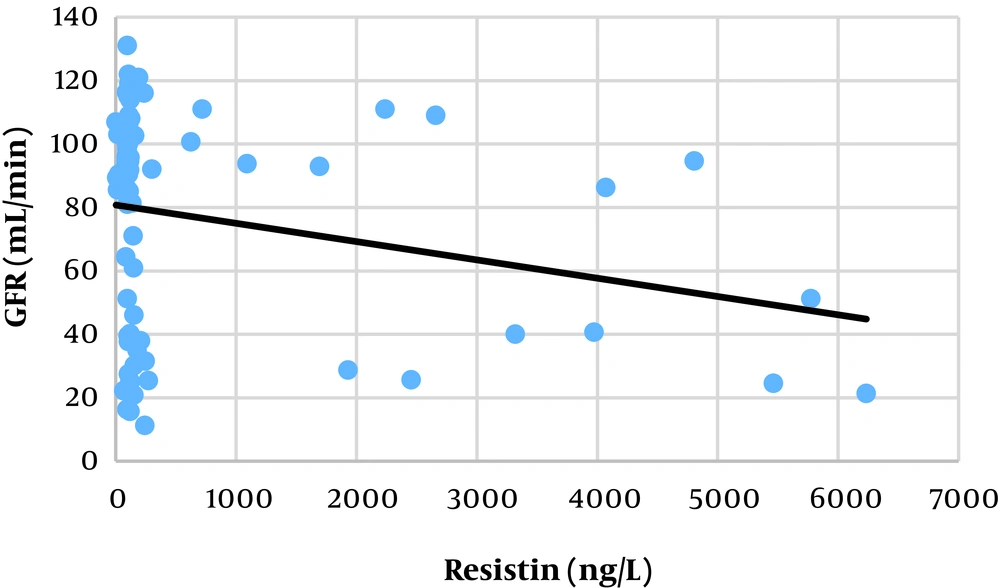
Figure 1.
Correlation between serum level of resistin and glomerular filtration rate
According to the results, there was a moderate correlation between fasting blood sugar with hemoglobin A1C (P = 0.000, r = 0.502) and serum creatinine (P = 0.000, r= 0.497) and weak inverse correlation with glomerular filtration rate (P = 0.031, r= -0.373). Serum resistin had no significant correlation with any of the data in the above table except for the glomerular filtration rate (Table 2).
Table 2.
Correlation in All Subjectsa
| Variable | Fasting BS | Hb A1C | Serum Cr | BMI | GFR |
|---|---|---|---|---|---|
| Resistin | r = 0.164; P = 0.124 | r = 0.065; P = 0.627 | r = 0.160; P = 0.135 | r = 0.041; P = 0.706 | r = -0.233; P = 0.031* |
| Fasting BS | r = 0.502; P = 0.000* | r = 0.497; P = 0.000* | r = 0.160; P = 0.135 | r = -0.373; P = 0.000* | |
| Hb A1C | r = 0.239; P = 0.068 | r = -0.054; P = 0.686 | r = -0.255; P = 0.051 | ||
| Serum Cr | r = 0.139; P = 0.193 | r = -0.851; P = 0.000* | |||
| BMI | r = 0.148; P = 0.262 |
aData were analyzed by Pearson correlation statistical analysis and * P < 0.05 was considered significant. 0.75 < r, there is a strong correlation; 0.75 > r > 0.4, there is a moderate correlation; 0.4 > r, there is a weak correlation.
5. Discussion
Despite the unclear reason for the resistin level increase in diabetic patients, a possible explanation in this regard could decrease the renal clearance and subclinical inflammation (14-16). According to the results, the mean level of serum resistin was significantly different in the three groups, and the mean serum level of resistin in diabetic patients with nephropathy was significantly higher than in healthy and diabetic patients without nephropathy. However, there was no significant difference between healthy and diabetic patients without nephropathy; these results are similar to the results obtained by Satti et al. in 2013 (12). Therefore, kidney involvement and nephropathy will increase serum resistin levels in diabetic patients. Serum creatinine level in diabetic patients with nephropathy was significantly higher than the healthy and diabetic patients without nephropathy, but there was no significant difference between healthy and diabetic patients without nephropathy. The obtained result is similar to the results of Cebeci et al. (13), which can indicate a direct effect of nephropathy on serum creatinine levels in diabetic patients. It seems that neuropathy does not affect the fasting blood sugar level in patients with type-2 diabetes because it was critically higher in both diabetic groups with/without nephropathy than the healthy individuals, but there was no significant difference between the two groups. The body mass index of the three groups participating in the experiment was not significantly different from each other, the result of which is inconsistent with the results obtained in the study conducted by Satti et al. (12), Cebeci et al. (13), and Azab et al. (17). The reason for the lack of this relationship could be this, considering that the body mass index of the subjects did not have the necessary scope (highest: 48.82, average: 27.1, lowest: 19.48) and the index of most patients was in the low range (healthy subjects = 25.7 ± 0.5, diabetic without nephropathy (27.8 ± 0.1), diabetic with nephropathy (27.8 ± 0.9). Also, in this study, all three groups were tried to be matched in terms of body mass index because body mass index affects the amount of resistin. It should be noted that in humans, resistin is secreted at very low levels in adipocytes, while mononuclear leukocytes, macrophages, spinal cord, and bone marrow cells are also produced in immune cells, and low levels of resistin are produced in the tissues of the lungs and placenta. There was no significant difference between the mean hemoglobin A1C in diabetic patients with/without nephropathy. The mean glomerular filtration rate was significantly different in the three groups. The mean glomerular filtration rate in diabetic patients with nephropathy was significantly lower than diabetic individuals without nephropathy and healthy individuals; however, there was no significant difference between healthy and diabetic individuals without nephropathy. While in the study conducted by Cebeci et al. (13), there was no significant difference between the glomerular filtration rate of healthy individuals and diabetic people without nephropathy. Cebeci et al. (13) did not distinguish the diabetic individuals with nephropathy and without nephropathy.
In this study, there were no significant correlations between the level of resistin and fasting blood sugar, hemoglobin A1C, serum creatinine, and body mass index. These results are similar to the ones obtained by Cebeci et al. (13) and contrary to the results by Azab et al. (17). Also, serum resistin level had a weak inverse correlation with the glomerular filtration rate, which can be due to kidney problems in patients with high levels of resistin. In the present study, there was a moderate correlation between fasting blood sugar, serum hemoglobin A1C, and serum creatinine. Also, there was a weak inverse correlation with glomerular filtration rate, despite no significant correlation in the body mass index. No significant correlation was observed between hemoglobin A1C and other variables except morning blood sugar. In the present study, there was a meaningful inverse correlation between serum creatinine and glomerular filtration rate, which is consistent with Fontela et al. in 2010 (18).
In this study, the rock curve showed that by the serum level of resistin with a cross-sectional area of 114.8 ng/L, a sensitivity of 0.733, a specificity of 0.621, and a level below the curve of 0.697, it can separated individuals with diabetes with nephropathy from healthy individuals. Also, with a cross-sectional area of 117.4 ng/L, a sensitivity of 0.700 and specificity of 0.677, and a level below the curve of 0.694, people with diabetes without nephropathy can be distinguished from diabetic individuals with nephropathy.
It seems that the serum level of resistin can be used as a biomarker to assess the deterioration of diabetes.