
1. Background
Palmaris longus (PL), phylogenetically degenerated weak accessory flexor of the wrist joint, have the short, muscular belly and long tendon, which crosses the flexor retinaculum and continues as palmar aponeurosis (1). It is the most variable muscle in the body. The variation includes unilateral or bilateral agenesis, duplication, or in the site of insertion. Although the function is very less, PL receives the attraction of the surgeons for its use in reconstructive plastic and hand surgery (2). It is also used to repair ptosis, urinary incontinence, and the restoration of facial paralysis (1).
In males, PL muscle acts as a weak flexor of the wrist, and aids in cupping of the palm (1). This characteristic marks the probable evidence of retrogression of this muscle. It also opposes strong shearing forces on the skin of the palm during gripping, and aiding in cupping of the hand.
Hypothetically, the comparison of the relative length of tendons and body could show the pathway of the degeneration of PL; that is, the degeneration could be associated with increased tendon length and decreased belly from more primitive primates to those most derivate, that is, great apes to modern humans (3).
According to Kapoor SK et al. (4), the agenesis of PL muscle was observed in 15% of the general population, but it is not applicable to all populations and varies among ethnic groups (5).
The current study aimed at determining the incidence of unilateral and bilateral agenesis of PL in the young Iranian population.
2. Methods
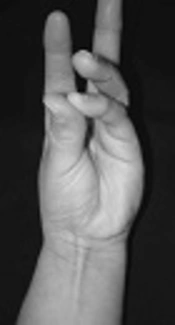
A total of 480 first- and second-year medical, dental, and paramedical students from Tehran medical institutions within the age range of 18 to 23 years were enrolled in the study. Demographic data included age, gender, dominant hand, race, and shape and the presence or absence of PL muscle in the forearm. Presence or absence of PL muscle was determined by the Schaeffer and the Thompson fist tests. In the Schaeffer test, the standard test to determine PL muscle, the examiner asked them to turn back their thumb to little finger with semi-flexion at the wrist (Figure 1). Subjects with any deformities or injury in the upper extremity were excluded from the study. The Thompson test was used to support the Schaeffer test and the examiner asked the subjects to turn back their thumb over clenched fist with flexion at the wrist (Figure 2). With these tests, PL tendon was palpated and visualized at distal of the forearm.
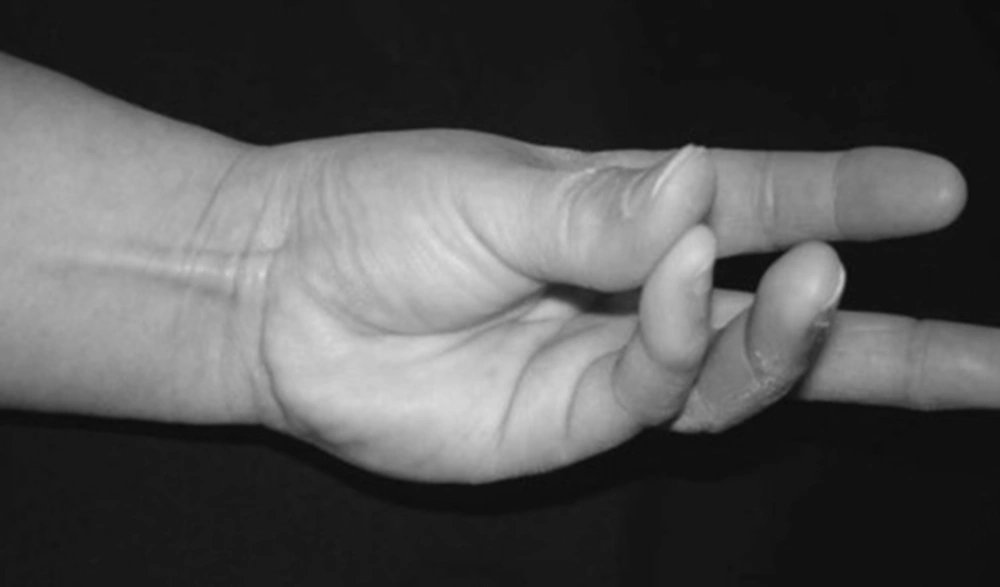
Figure 1.
The Schaeffer Test
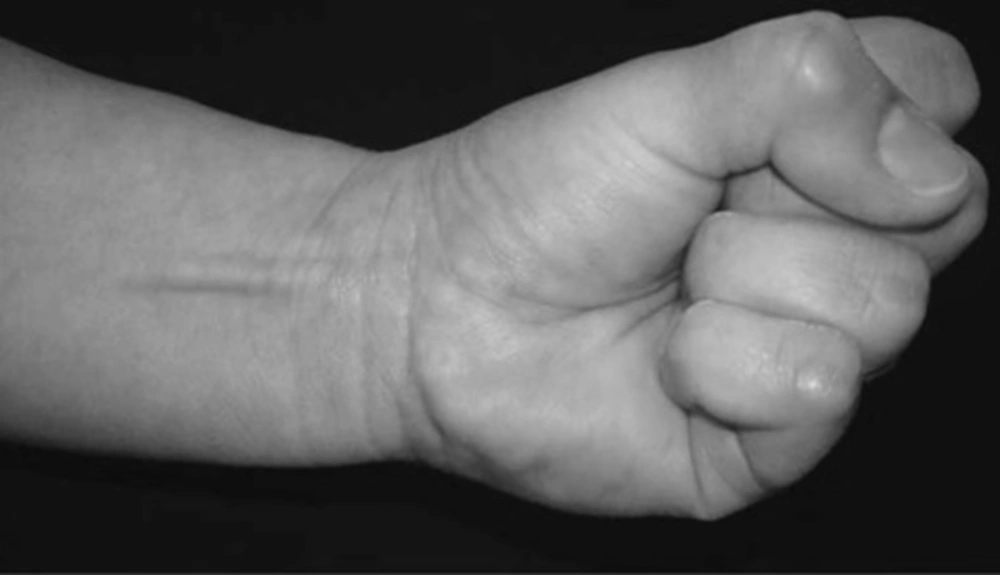
Figure 2.
The Thompson Test
3. Results
The prevalence of the PL muscle was observed in 480 students. Among the males, PL muscle was absent bilaterally in 23% and unilaterally in 28.5% of the subjects with the distribution of 16.9% on the left and 11.6% on the right hands. In females, the bilateral absence was observed in 34.16%, while 18.7% had unilateral absence with the distribution of 5.8% on the left and 12.9% on the right hands.
Another variation of the palmaris longus muscle is the bifurcation of its tendon observed in wrist hand. In females, V-shaped tendon or bifurcation in tendon was 5.1%. In males, this anomaly was 0.9% (Table 1).
Table 1.
The Shape of the Palmaris Longus Muscle in the Study Subjects
| Total Sample (N = 480) | Males (N = 325) | Females (N = 155) | |
|---|---|---|---|
| Presence (normal) | 71.11% | 77.2% | 60.71% |
| Presence (Y-shaped) | 2.29% | 0.9% | 5.1% |
| Absence | 26.6% | 21.8% | 34.19% |
Finally, of the 480 investigated subjects, PL muscle was absent in 26.6%, while 47.9% had PL muscle on both hands. However, there was a significant difference between male and female subjects in the absence of PL. On the other hand, many of the V-shaped anomalies were observed in the female groups.
4. Discussion
Identification of the PL is very important to clinicians since its tendon is used as a graft in various surgical procedures and during the administration of medicine/corticosteroids in the carpal tunnel to relieve pain due to carpal tunnel syndrome/arthritis.
According to the literature, there are various methods to find the tendon of PL, each with its own identifying techniques. The most common and traditionally followed method is the Schaffer test as a standard test or model to identify PL muscle (1, 2, 6-20).
The techniques of the Schaeffer and the Thompson’s fist tests were used in the current study to prove the presence or absence of PL muscle.
Table 2.
Prevalence of the Palmaris Longus Muscle in the Literature Review
| Study Population (Author, Date) | Total Sample (N) | Male/Female (N) | Age | Bilateral Absence | Unilateral Absence (L) | Unilateral Absence (R) | Bilateral Presence |
|---|---|---|---|---|---|---|---|
| Caucasian population (20) Thompson Mockford et al., 2001 | 300 | 150/150 | 18 - 40 | %8.6 | %6.6 | %9.6 | %75.2 |
| A Chinese population study (19) Sebastin and Lim 2006 | 329 | 120/209 | 7 - 85 | %1.2 | %2.4 | %0.9 | %95.5 |
| Indian population (4) Kapoor Tiwari et al., 2008 | 500 | 236/264 | 6 - 65 | %8 | %6.2 | %3 | %82.8 |
| Turkish population (18) Kose Adanir et al., 2009 | 1350 | 675/675 | 18 - 85 | %15.04 | %7.04 | %4.51 | %73.41 |
| Yoruba population (17) Mbaka and Ejiwunmi 2009 | 600 | 335/265 | 8 - 60 | %6.7 | %3.2 | %2.5 | %87.6 |
| Indian population (21) Agarwal 2010 | 385 | 195/190 | 20 - 24 | %3.37 | %11.16 | %5.7 | %79/74 |
| The Northern, Serbia (15) Eric, Krivokuca et al., 2010 | 800 | 400/400 | 18 - 75 | %15.9 | %13 | %8.6 | %62.5 |
| Chilean Subjects (14) Alves Ramírez et al., 2011 | 200 | 86/114 | 17 - 32 | %9 | %6 | %5 | %80 |
| Pakistani population (10) HUSSAIN 2011 | 610 | 378/228 | 18 - 74 | %12.95 | %4.91 | %3.60 | %78.54 |
| East African population (12) Kigera and Mukwaya 2011 | 800 | 391/409 | 12 - 70 | %1.1 | %2.3 | %1 | %95.6 |
| Indian population (2) Sankar Bhanu et al., 2011 | 942 | 450/492 | 18 - 23 | %8.28 | %10.19 | %9.55 | %71.98 |
| A population of Saudi Arabia (10) HUSSAIN 2012 | 400 | 200/200 | 21 - 25 | %7.75 | %9 | %7.75 | %75.5 |
| Korean population (9) Kyung Lee et al., 2012 | 269 | 149/120 | 18 - 30 | %2.23 | % 1.11 | %0.74 | %95.9 |
| An orthopedic surgery center in Iran (22) Abdolahzadeh Lahiji et al., 2013 | 1000 | 682/318 | - | %6.7 | %5.9 | %10.2 | %77.2 |
| Egyptian population (7) Raouf, Kader et al., 2013 | 386 | 112/274 | 19 - 70 | %31.1 | %7.8 | %11.9 | %49.2 |
| South African population (6) Venter Van Schoor et al., 2014 | 706 | 363/343 | 5 - 99 | %11.9 | %7.7 | %6.9 | %73.5 |
| Young Iranian population The current study, 2017 | 480 | 325/155 | 18 - 23 | %26.6 | %13.3 | %12.08 | %47.91 |
Some authors suggested that the PL muscle absence is more common in females (2, 7, 10, 14), consistent with the findings of the current study regarding the bilateral absence. Unilateral absence occurred more often on the left hand in males (6, 12, 21) and unilateral absence on the right hand in the females (7, 14, 17). The current study reported a similar prevalence in females and males in bilateral absence, but recorded higher absence than the valid reference (5) and other populations (4, 9, 10, 12, 14, 17, 19-21). The authors agreed with the current study (2) and reported higher figures than that of the current study records (7).
Another variation of the PL muscle is the bifurcation of its tendon or the belly (23-25) and V shape anomaly in tendon (26). The current study recorded 2.3% variation in tendon 5% in females and 1% in males. Since the authors (24, 26) reported an abnormal case for tendon shape, the variation was not clear and it was not reported statistically.
Knowledge of the PL muscle variations and its normal anatomy is useful. The tendon of PL muscle is a significant anatomical landmark for surgical approaches in this area and may cause compression of the median nerve (23).
According to Sebastin SJ (27) lack of any difference in favor of the normal population may indicate the gradual phylogenetic degenerative trend for this muscle; authors believe that PL muscle is progressively disappearing in Iranian young people and could prove a degenerative trend in the Iranian population.