1. Background
The transsphenoidal approach has gained wide acceptance due to its capacity to provide a direct route to pituitary tumors, which often has a major component in the sphenoid sinus. The Hardy retractor and microscope, known as the microscopic transsphenoidal approach (MTSA), are the essential surgical instruments that make this technique feasible (1). However, this technique is limited by the narrow working corridor inside the retractor and limited visibility and illumination provided by the microscope, especially in cases of large extensive tumors (2). Meanwhile, advances in understanding skull base anatomy, improvements in surgical instrumentation, and the introduction of minimally invasive skull base surgery have driven the development of endoscopic endonasal surgery for various skull base diseases, including endoscopic transsphenoidal approach (ETSA) for pituitary adenoma (PA) (3). For decades, in most institutions, endoscopic techniques have been commonly used for the resection of PA.
Numerous previous publications have compared the outcomes between ETSA and MTSA (4-7). However, most of these reports were based on cases that underwent surgery during the transition of technique from microscopic to endoscopic techniques (4, 5, 8). In addition, these studies are limited by the differences in patient demographics and tumor characteristics. Therefore, the comparison of the effectiveness between ETSA and MTSA remains inconclusive.
2. Objectives
In this study, we reviewed the cases with PAs undergoing surgery by ETSA and MTSA at our institution over concurrent periods. We analyzed our data using comprehensive measurements and rigorous statistical methods.
3. Methods
The medical records of patients who underwent transsphenoidal surgery for PAs at our institution between January 2015 and December 2019 were retrospectively reviewed. We included patients over the age of 18 years who were followed up for at least 6 months after the surgery. All clinical data were collected. Patients who underwent simultaneous combined transcranial and transsphenoidal approaches had a history of prior radiation to the sella or its adjacent structures, or those without follow-up data were excluded. This study was conducted with the approval of the Medical Ethics Committee of Thammasat University in accordance with the tenets of the Declaration of Helsinki. Informed consent was not required given the retrospective nature of this study.
3.1. Surgical Procedure
In our institution, transsphenoidal surgery using both MTSA and ETSA has been used to resect pituitary tumors. Surgeons in this study included two surgeons who had independently performed ETSA in 67 and 52 cases and two surgeons in the MTSA group with the experiences of 71 and 48 cases. The selection of the surgical technique was a consensus decision involving the attending surgeon in consultation with a multidisciplinary team. MTSA was performed using a sublabial transsphenoidal approach, whereas we used a binostril technique for ETSA.
3.2. Treatment Outcomes
After the surgery, patients were scheduled for follow-up at 1, 3, and 6 months, and annually thereafter. All follow-up data, including hormonal, visual, and radiographic status, were extracted from medical records. During the follow-up period, the hormonal status of the pituitary gland was evaluated by endocrinologists. The remission criteria of functioning adenomas were based on the consensus group of experts (9, 10). Visual outcomes were assessed by an ophthalmologist. Complications resulting from ETSA and MTSA were considered definite at 6 months after surgery.
3.3. The Extent of Tumor Resection
All patients received preoperative magnetic resonance imaging (MRI) scans within 3 months of the surgery and postoperative MRI scans at the 3-month follow-up. We defined tumors; > 3 cm in diameter as large tumors, and tumors with Knosp grade, ≥ 3 or Hardy-Wilson grade, ≥ C were considered invasive. The noncontrast and postcontrast T1 pituitary coronal sequences on 1.5-T or 3-T MRI scanners were used for analysis. The extent of resection (EOR) was dichotomized into gross total resection (GTR) and subtotal resection (STR). In addition, we performed a volumetric analysis by calculating the sum of the tumor surface area of each coronal section to measure preoperative and postoperative tumor volumes (11). EOR was subsequently measured as the percent reduction of the total preoperative tumor volume. Recurrence was defined as regrowth of the tumor after total removal or progression of the residual tumor.
3.4. Statistical Analysis
Descriptive statistics were used to summarize baseline characteristics of patients in each group. Comparisons between the ETSA and MTSA groups were made using the student t-test, Chi-square test, and Fisher's exact test, as appropriate. In addition, the univariate and multivariate regression analysis was performed to compare treatment outcomes between ETSA and MTSA. All models were corrected for age, sex, tumor size, Knosp grade, type of adenoma, presence of apoplexy, and prior pituitary surgery to facilitate the calculation of the odds ratio (OR). Recurrence-free survival (RFS) was measured from the time of surgery to documented recurrence. A Kaplan-Meier method with a stratified log-rank test was performed to compare the RFS between the two groups. Patients who were alive or lost to follow-up were censored at the last follow-up. All statistical analyses were conducted using Stata 14 software (StataCorp LP, College Station, Texas, USA) with a significance level of 0.05 for the 2-tailed test. Missing data were excluded.
4. Results
4.1. Patient Characteristics
A total of 232 patients with PAs underwent transsphenoidal surgery during the study period. Among these, six patients were excluded because they underwent combined surgical approaches, and 16 patients were excluded due to the loss of follow-up. Therefore, a total of 210 patients, including 138 ETSA patients and 72 MTSA patients were analyzed.
Baseline characteristics between groups were not significantly different (Table 1). The mean age of the patients was 48.8 years and 53.8 years in the ETSA and MTSA groups, respectively (P = 0.05). The ETSA group included 77 (55.8%) male and 61 (44.2%) female patients, whereas the MTSA group consisted of 44 (61.1%) male and 28 (38.9%) female patients (P = 0.61). The most common symptoms in this study were visual disturbance (98 cases (71.0%) in the ETSA and 54 cases (75.0%) in the MTSA group) whereas 7 cases (51%) in the ETSA and 9 cases (12.5%) in the MTSA group were asymptomatic. The mean tumor volume was 9.7 cm3 and 11.1 cm3 in the ETSA and MTSA groups, respectively (P = 0.44). Thirty-two (23.2%) ETSA patients and 11 (15.3%) MTSA patients had pituitary apoplexy (P = 0.22).
Table 1.
Baseline Characteristics of Patients Undergoing Endoscopic Transsphenoidal Approach (ETSA) and Microscopic Transsphenoidal Approach (MTSA) a
| Characteristics | ETSA (n = 138) | MTSA (n = 72) | P-Value |
|---|---|---|---|
| Mean age ± SD, y | 48.8 ± 13.9 | 53.8 ± 15.6 | 0.05 |
| Gender | 0.61 | ||
| Male | 77 (55.8) | 44 (61.1) | |
| Female | 61 (44.2) | 28 (38.9) | |
| Clinical presentation | |||
| Headache | 44 (31.9) | 26 (36.1) | 0.72 |
| Visual loss | 98 (71.0) | 54 (75.0) | 0.70 |
| Hormonal symptoms | 29 (21.0) | 7 (9.7) | 0.07 |
| PRL | 6 (4.3) | 2 (2.8) | |
| GH | 16 (11.6) | 3 (4.2) | |
| ACTH | 5 (3.6) | 0 | |
| TSH | 2 (1.4) | 2 (2.8) | 0.32 |
| Asymptomatic | 7 (5.1) | 9 (12.5) | 0.18 |
| Prior surgery | 20 (14.5) | 15 (20.8) | 0.36 |
| Maximal tumor diameter ± SD, cm | 3.1 ± 1.3 | 3.3 ± 1.5 | 0.14 |
| Mean tumor volume, cm3 | 9.7 ± 6.2 | 11.1 ± 9.8 | 0.44 |
| Apoplexy | 32 (23.2) | 11 (15.3) | 0.22 |
| Knosp grading | 0.58 | ||
| 0 | 54 (39.1) | 29 (40.3) | |
| 1 | 28 (20.3) | 15 (20.8) | |
| 2 | 28 (20.3) | 11 (15.3) | |
| 3 | 18 (13.0) | 12 (16.7) | |
| 4 | 10 (7.2) | 5 (6.9) | |
| Hardy-Wilson grading | 0.85 | ||
| 0 | 13 (9.4) | 8 (11.1) | |
| A | 36 (26.1) | 21 (29.2) | |
| B | 47 (34.1) | 22 (30.6) | |
| C | 33 (23.9) | 18 (25) | |
| D | 9 (6.5) | 3 (4.1) | |
| Mean follow-up time, mo | 27.8 ± 13.7 | 32.5 ± 23.3 | 0.07 |
aValues are expressed as No. (%) unless otherwise indicated.
4.2. Treatment Outcomes and Complications
Treatment outcomes for ETSA and MTSA are shown in Table 2. We found significantly less intraoperative blood loss in the ETSA compared to MTSA groups (191.9 mL vs. 369.9 mL, P < 0.01). The operative duration was not significantly different between the two techniques (2.6 hr vs. 3.3 hr, P = 0.11). For EOR, patients who underwent ETSA achieved better results in terms of the rate of GTR (84.1% vs. 72.2%, P = 0.04) and percentage of tumor resection (95.1% vs. 87.4%, P < 0.01). In subgroup analysis, large and invasive tumors did not affect the rate of GTR (Figure 1). Moreover, there was no difference in GTR achieved by surgeons in each group (Table 3). The remission rate of functioning adenomas was not significantly different between the two groups (86.2% vs. 70.8%, P = 0.61). The mean hospital stay was significantly lower in ETSA than MTSA patients (10 days vs. 13.5 days, P < 0.01). The improved patient outcomes of ETSA persisted in multivariable regression analysis.
Table 2
| Outcome | ETSA (n = 138) | MTSA (n = 72) | Crude Analysis, OR (95% CI) | P-Value | Adjusted Analysis, OR (95% CI) | P-Value |
|---|---|---|---|---|---|---|
| Opereative duration, hr | 2.6 ± 1.4 | 3.3 ± 2.1 | -0.4 (-0.8 - 0.1) c | 0.11 | -0.3 (-0.7 - 0.2) | 0.23 |
| Intraoperative blood loss, mL | 191.9 ± 150 | 369.8 ± 187.5 | -177.9 (-242.1 – -113.6) c | < 0.01 | -153.4 (-213.6 - -93.2) | < 0.01 |
| GTR | 116 (84.1) | 52 (72.2) | 2.0 (1.0 – 4.0) | 0.04 | 2.0 (1.1 – 4.0) | 0.04 |
| Postoperative tumor volume, cm3 | 1.0 ± 2.3 | 1.7 ± 2.8 | -0.6 (-1.4 – 0.2) c | 0.15 | -0.6 (-1.3 – 0.2) | 0.17 |
| EOR, % | 95.1 ± 4.6 | 87.4 ± 12.8 | 6.7 (3.1 – 10.3 | < 0.01 | 6.1 (2.7 – 9.6) | < 0.01 |
| Remission of functioning adenomas | 119 (86.2) | 51 (70.8) | 3.3 (1.0 – 11.8) | 0.61 | 1.3 (0.3 – 5.4) | 0.73 |
| Hospital stay, days | 10 ± 7 | 13.5 ± 8.8 | -4.8 (-8.0 - -1.7) c | < 0.01 | -4.6 (-7.7 - -1.4) | < 0.01 |
| Visual improvement | 74 (53.6) | 30 (41.7) | 1.6 (0.8 - 3.2) | 0.16 | 1.7 (0.8 - 3.5) | 0.18 |
| Hormonal deficit | 24 (17.4) | 17 (23.6) | 0.7 (0.3 - 1.4) | 0.28 | 0.6 (0.3 - 1.3) | 0.30 |
| Diabetic insipidus | 16 (11.6) | 15 (20.8) | 0.5 (0.3 - 1.0) | 0.06 | 0.4 (0.2 – 1.1) | 0.07 |
aValues are expressed as No. (%) or mean ± SD.
bAdjusted for age, sex, tumor volume, Knosp grade, tumor type, apoplexy, and prior surgery.
cLinear regression coefficient.
Table 3
. Rate of Gross Total Resection (GTR) Achieved by Surgeons in Each Group
| ETSA (n = 138) | MTSA (n = 72) | |||||
|---|---|---|---|---|---|---|
| Surgeon 1 (n = 73) | Surgeon 2 (n = 65) | P-Value | Surgeon 3 (n = 40) | Surgeon 4 (n = 32) | P-Value | |
| GTR, No. (%) | 60 (82.2) | 56 (86.2) | 0.64 | 29 (72.5) | 24 (75) | 0.81 |
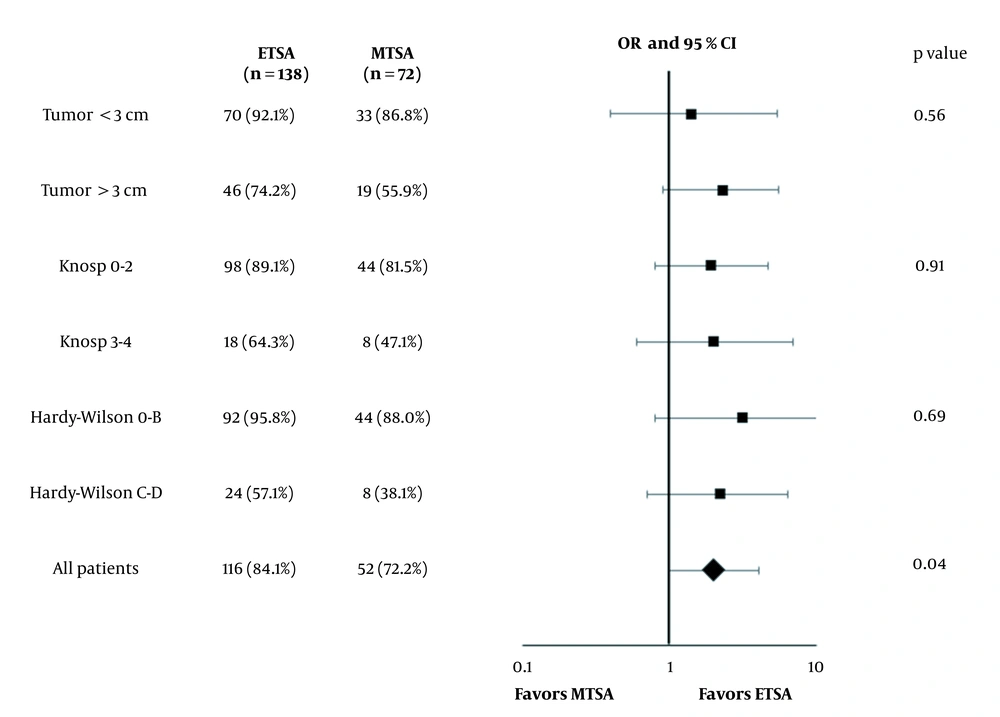
Figure 1.
Subgroup analysis of gross total resection (GTR) and tumor invasiveness
Next, we evaluated secondary surgical outcomes. The rates of visual improvement were similar in the ETSA and MTSA patients (53.6% vs. 41.7%, P = 0.16). Anterior pituitary hormone deficits were equivalent in ETSA and MTSA patients (17.4% vs. 23.6%, P = 0.28). However, the ETSA group had a non-significant lower rate of diabetes insipidus (11.6% vs. 20.8%, p = 0.07).
Postoperative complications were not significantly different between the groups (Table 4). The most common complication found in the ETSA group was CSF leakage in 10 (7.2%) patients. In the MTSA group, we found 5 patients (6.9%) with CSF leakage and 5 (6.9%) patients with rhinologic problems. In-hospital mortality occurred in 2 (1.4%) ETSA patients, including one with stroke, one with internal carotid artery (ICA) injury death, and one (2.8%) MTSA patient whose death was related to ICA injury. Nevertheless, the mortality rates of the two groups were not significantly different.
Table 4.
Complications in Endoscopic Transsphenoidal Approach (ETSA) and Microscopic Transsphenoidal Approach (MTSA) a
| Complication | ETSA (n = 138) | MTSA (n = 72) | P-Value |
|---|---|---|---|
| CSF leak | 10 (7.2) | 5 (6.9) | 0.68 |
| Meningitis | 8 (5.8) | 3 (4.2) | 0.46 |
| ICA injury | 2 (1.4) | 2 (2.8) | 0.32 |
| Cranial nerve injury | 2 (1.4) | 3 (4.2) | 0.44 |
| Intracranial hemorrhage | 1 (0.7) | 3 (4.2) | 0.42 |
| Epistaxis | 4 (2.9) | 2 (2.8) | 0.77 |
| Rhinologic complication | 7 (5.1) | 5 (6.9) | 0.23 |
| Stroke | 4 (2.9) | 2 (2.8) | 0.98 |
| Death | 2 (1.4) | 2 (2.8) | 0.95 |
aValues are expressed as No. (%).
4.3. Recurrence
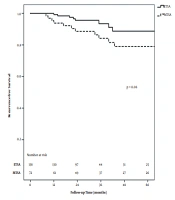
With a mean follow-up time of 29 months for all patients, recurrent PAs occurred in 7 (5.1%) ETSA patients and 12 (16.7%) MTSA patients. The RFS at 5 years in all patients was 84.4%, including 86.1% and 78.1% in ETSA and MTSA patients, respectively, which corresponded to a trending reduction in recurrence for ETSA patients (P = 0.06) (Figure 2).
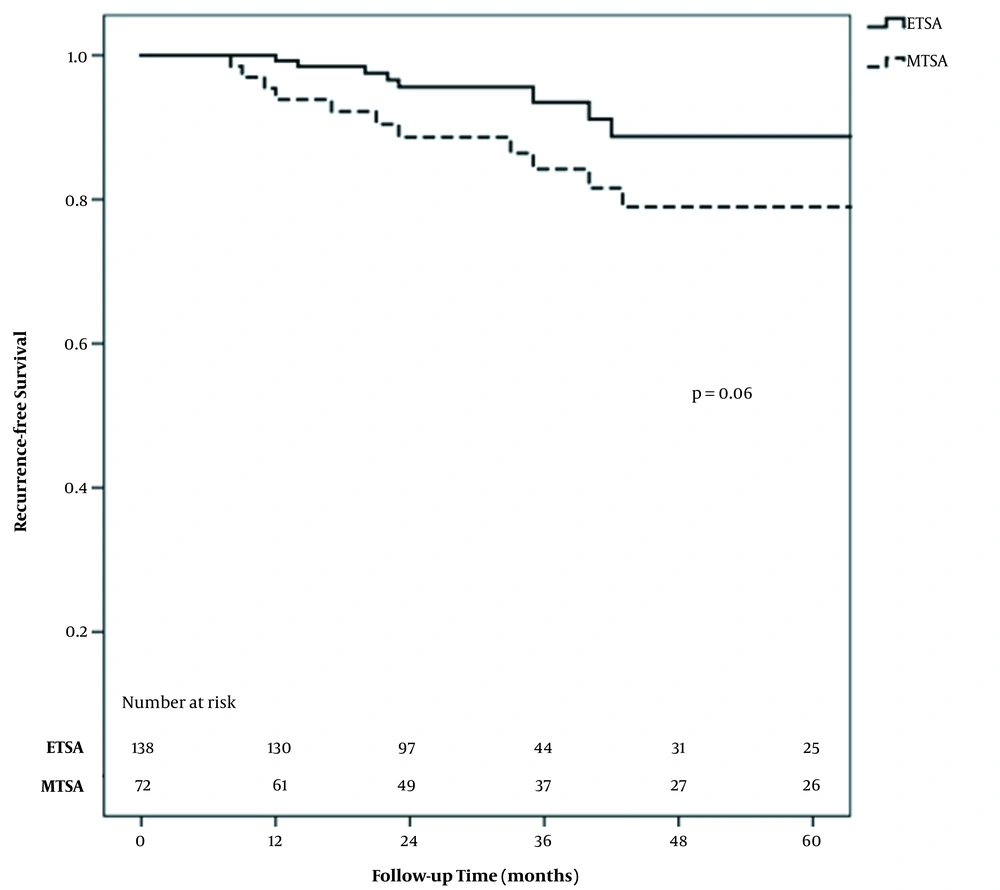
Figure 2.
Kaplan-Meier plot of recurrence-free survival stratified by the endoscopic transsphenoidal approach (ETSA) and microscopic transsphenoidal approach (MTSA) groups
5. Discussion
In this study, ETSA had a significantly higher percentage of GTR, less operative blood loss, and shorter hospital stays. The rate of GTR in this study was comparable with the recent studies ranging from 57.6% to 95.4%.(11-14). Although previous studies comparing surgical outcomes in ETSA and MTSA have shown inconsistent results, meta-analyses and systematic reviews in recent years have found generally favored ETSA.(6, 15, 16) This may be associated with the gradual increase in proficiency with the endoscopic technique with time. O’Malley et al. (17) showed that given the learning curve associated with ETSA, proficiency could be achieved after 17 procedures. Eseonu et al. (4) revealed that ETSA achieved a similar operative time to MTSA after 29 cases. Thus, to control the effect of surgeons’ proficiency, we included cases performed by neurosurgeons who experienced more than 30 cases to mitigate the impact of the learning curve. In addition, surgeons in each group had an equivalent rate of GTR. This strongly affirmed the better advantages of ETSA, which also persisted in the adjusted analysis. For large and invasive tumors, we found a reduction in the rate of GTR with better resection in ETSA (range, 57.1% - 74.2%) compared to MTSA (range, 38.1% - 55.9%). GTR in large PAs with ETSA has been reported ranging from 14.3% to 82.5% (18). Fallah et al. reported a rate of 82.5% for GTR in their series and suggested ETSA as the first-line treatment for large PAs (18).
We found no difference in the complication rate between ETSA and MTSA, which is consistent with the previous studies (4, 19). However, our surgical complications were higher than the recent reports from experienced pituitary centers.(12, 19) This could be related to the lower numbers of patients in our study and our less surgical experience. Nevertheless, the tumors in our series were slightly large, potentially causing complications, especially when GTR was attempted.
The recurrent rate of PAs in our series was similar to that of previous research. Several studies have reported the long-term rate of recurrence ranging from 44 to 75% within a 10-year period after initial resection (20-22). However, this study only analyzed patients who received MTSA for the resection of their tumors. Eseonu et al. (4) compared the outcomes between ETSA and MTSA from a single surgeon in the institutional transition of technique. They found no significant difference in both the extent of resection and recurrence. In contrast, our study consisted of cases performed by several surgeons during a period when both MTSA and ETSA were used. Although tumor recurrence following ETSA and MTSA was not significantly different, patients who underwent MTSA were three times more likely to experience tumor recurrence compared to patients who underwent ETSA. This may be related to the higher rate of GTR achieved in ETSA. Nevertheless, the risk of tumor recurrence is multifactorial and, among other factors, can be influenced by the tumor subtype, as revealed through histological findings or immunological markers (23-25). In addition, adjuvant treatment, including radiotherapy and medications, are also effective in restricting tumor recurrence (26).
This study has several limitations. Given the nature of retrospective studies, despite using regression analysis to control for confounding factors, as with all nonrandomized studies, biases still exist. Moreover, our sample was unbalanced regarding the number of patients who received MTSA and ETSA that could affect the statistical power and overestimate the effect size. Finally, selection bias might exist because the choice of surgery was based on surgeons’ preferences at a single institution. Therefore, further multicenter randomized trials are required to validate these results.
5.1. Conclusions
This study showed that when performed by an adequately experienced surgeon, ETSA achieved less operative blood loss, greater EOR, reduced the length of hospital stay, and similar complication rates compared to MTSA for PAs. A large multicenter study is required to confirm these results.