
1. Background
Musculoskeletal disorders (MSDs) are among the main causes of morbidity and disability among adults and are known as the most common and costly work-related musculoskeletal disorders (WMSDs). These disorders occur in all countries, but they are much more serious in developing countries, while developed countries have largely reduced or eliminated the risk factors of this disease during work processes. On the other hand, many work activities in developing countries are still carried out manually or traditionally (1, 2).
These types of injuries cause enormous costs for the health care system, including direct costs (such as expenses for treatment, rehabilitation, insurance, etc.) and indirect costs (disabilities, etc.) (3). Also, these types of disorders are particularly prevalent. A study by Parno et al. on the prevalence of WMSDs among 9813 Iranians reported the prevalence of back, neck, knee, and shoulder pain as 49%, 39.3%, 39.32%, and 36.9%, respectively (4).
Low back pain (LBP), a type of MSD, is divided into two groups of specific and non-specific types. Specific LBP refers to painful pathological problems in spinal structures, and its risk factors include inflammatory conditions, bone metabolic diseases, infectious agents, traumas, pain, and congenital disorders. On the other hand, non-specific LBP has no specific symptoms and comprises most cases of back pain (5, 6).
Degenerative changes in intervertebral discs start from childhood and manifest in older ages when spinal disorders are considered common disorders. The core parts of intervertebral discs progressively lose their proteoglycans and water content, leading to an increase in the disc height and a decrease in its collagen content (7). The prevalence of LBP is considerably high in populations, and it is considered the most common cause of doctor visits after a cold (8). In a meta-analysis study on 31039 people, Azizpour et al. showed that the prevalence of LBP was 51.6% (9). Morris et al. also stated in a study in Africa that the annual Prevalence of this disease was 57%, indicating a high rate (10).
Various factors, such as drugs, surgery, and support interventions, are recommended for patients suffering from LBP (11, 12). In the case of progressive LBP, the patient will have to undergo lumbar spine surgery (LSS) to improve the condition of patients with lumbar discs (13-15). Patients frequently experience pain after LSS, so it is crucial to evaluate pain in these patients due to its high prevalence and persistent nature (16, 17), as well as the essential role of pain control in preventing disease complications (18, 19).
2. Objectives
Considering the importance of LSS and its outcomes in patients with LBP, the purpose of the present study was to compare pain intensity, fear of movement, and disability before and after LSS.
3. Methods
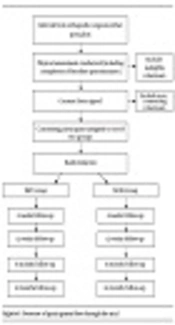
In this descriptive-analytical research, the study population included all patients undergoing LSS at the Imam Khomeini Hospital of Ilam City from October 2015 to October 2016. All patients were followed up preoperatively for one year after surgery, and their clinical condition was examined and recorded.
The research process started only after obtaining permission from the relevant authorities at Ilam University of Medical Sciences and the necessary approval from the institutional research ethics committee. The researchers then visited the Imam Khomeini Hospital on a daily basis and extracted the list of eligible patients. Entry criteria included undergoing LSS at the Imam Khomeini Hospital of Ilam City, not referring to other medical centers for postoperative management, and giving consent for participation by the patient or his/her family. Exclusion criteria also included the lack of consent of the patient or the patient’s companion to participate in the study, the presence of additional lesions (e.g., abdominal traumas, chest traumas, chronic conditions such as pain or disability), undergoing anesthesia for any other reason, withdrawal from the study at any time during the research, and incomplete medical and clinical documents.
If the patient was found eligible for LSS according to diagnostic findings and clinical presentation, the research questionnaires were completed for him/her. The patient’s condition was evaluated using the same questionnaires from six months to one year after the surgery.
A demographic and clinical information questionnaire, the pain catastrophizing scale (PCS), the tampa scale for kinesiophobia (TSK), and the physical disability questionnaire (PDQ) were used as data collection tools. Demographic information included age, gender, marital status, level of education, satisfaction with the economic status, BMI, and smoking status.
3.1. Pain Catastrophizing Scale
This tool consists of 13 statements that evaluate pain catastrophic thoughts and behaviors and includes three subscales: rumination, magnification, and helplessness. Patients are requested to answer the questions based on their clinical conditions and pain experience. The questions are scored from 0 (never) to 4 (always), and a higher score indicates higher pain catastrophizing (20, 21).
3.2. Brief Pain Inventory
This is a pain self-assessment tool evaluating pain intensity and its impact on daily life functions. The tool consists of nine questions, and the overall score ranges between 0 and 10, where a higher score means more severe pain (22).
3.3. Tampa Scale for Kinesiophobia
This 17-item scale consists of two parts: belief in injury and avoidance of activity. The score range is between 17 and 68, and a higher score indicates the patient’s higher fear of movement due to the perceived pain (23).
3.4. Physical Disability Questionnaire
This tool is utilized to evaluate a person’s functional status and examines a wide range of physical activities limited due to pain. The score range of this instrument is between 0 (least disability) and 24 (maximum disability) (24).
3.5. Ethical Issues
All guidelines issued by the Research Ethics Committee of Ilam University of Medical Sciences were followed, and all patient information was kept confidential.
3.6. Statistical Procedures
The data collected were analyzed using SPSS 16 software. The analyzes carried out included repeated-measures ANOVA, independent t-test, the ANOVA test, and descriptive statistics.
4. Results
Most of the patients (70.8%) were male, and the average age of the patients was 67.21 (14.05) years (Table 1).
Table 1.
Demographic Characteristics of Patients a
| Variables | Values |
|---|---|
| Gender | |
| Male | 46 (70.8) |
| Female | 19 (29.2) |
| Education | |
| Illiterate | 38 (58.5) |
| Diploma | 25 (38.5) |
| Academic | 2 (3.1) |
| Marital status | |
| Single | 42 (64.6) |
| Married | 23 (35.4) |
| Economic situation | |
| Poor | 23 (35.4) |
| Middle | 35 (53.8) |
| Good | 7 (10.8) |
| Smoking | |
| Yes | 39 (60) |
| No | 26 (40) |
| Age (y); Mean (SD) | 67.21 (14.05) |
aValues are expressed as No. (%) unless otherwise indicated.
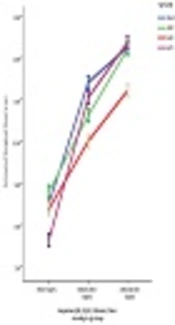
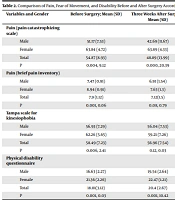
The Mean (SD) score of the Pain Catastrophizing Scale in men before surgery was equal to 51.17 (7.53), and in women, it was equal to 63.84 (4.72) (P = 0.004), but after nine weeks after the surgery, it was equal to 19.36 (4.94) in men and 23.31 (6.68) in women (P = 0.04) (Table 2).
Table 2.
Comparison of Pain, Fear of Movement, and Disability Before and After Surgery According to the Gender of Patients a
| Variables and Gender | Before Surgery | Three Weeks After Surgery | Six Weeks After Surgery | Nine Weeks After Surgery |
|---|---|---|---|---|
| Pain (pain catastrophizing scale) | ||||
| Male | 51.17 (7.53) | 42.69 (11.67) | 32.54 (15.91) | 19.36 (4.94) |
| Female | 63.84 (4.72) | 63.89 (4.33) | 49.05 (8.48) | 23.31 (6.68) |
| Total | 54.87 (8.93) | 48.89 (13.99) | 37.36 (15.98) | 20.52 (5.74) |
| P | 0.004, 9.12 | 0.000, 20.39 | 0.002, 10.06 | 0.041, 4.36 |
| Pain (brief pain inventory) | ||||
| Male | 7.47 (0.91) | 6.91 (1.54) | 4.15 (0.91) | 2.54 (1.31) |
| Female | 8.94 (0.91) | 7.63 (1.3) | 4.78 (0.97) | 4.42 (0.60) |
| Total | 7.9 (1.12) | 7.12(1.5) | 4.33 (0.97) | 3.09 (1.43) |
| P | 0.001, 0.06 | 0.08, 0.79 | 0.01, 0.19 | 0.001, 7.88 |
| Tampa scale for kinesiophobia | ||||
| Male | 56.93 (7.29) | 56.04 (7.53) | 46.34 (11.96) | 29.84 (10.03) |
| Female | 62.26 (5.65) | 59.21 (7.26) | 48.78 (8.99) | 30.73 (6.93) |
| Total | 58.49 (7.23) | 56.96 (7.54) | 47.06 (11.16) | 30.10 (9.19) |
| P | 0.006, 2.41 | 0.12, 0.03 | 0.42, 6.10 | 0.72, 1.28 |
| Physical disability questionnaire | ||||
| Male | 16.63 (2.27) | 19.54 (2.64) | 18.02 (2.76) | 12.63 (3.26) |
| Female | 21.36 (2.26) | 22.47 (1.21) | 20.0 (2.0) | 13.63 (2.62) |
| Total | 18.01(3.12) | 20.4 (2.67) | 18.6 (2.7) | 12.92 (3.1) |
| P | 0.001, 0.03 | 0.001, 10.42 | 0.006, 0.77 | 0.24, 1.27 |
aValues are expressed as Mean (SD).
According to Tables 3 and 4, there was a significant decrease in all variables, including the PCS, BPI, and PDQ scores, after the intervention, compared to before the intervention (P < 0.05).
Table 3.
Analysis of Between-Subjects Effects for Pain, Fear, and Disability in All Groups
| Source | Type III Sum of Squares | Mean Square | F | Sig. |
|---|---|---|---|---|
| Pain (PCS) | ||||
| Intercept | 424684.862 | 424684.862 | 1158.381 | 0.000 |
| Error | 23463.638 | 366.619 | - | - |
| Pain (BPI) | ||||
| Intercept | 8198.462 | 8198.462 | 2266.153 | 0.000 |
| Error | 231.538 | 3.618 | - | - |
| Fear | ||||
| Intercept | 602982.465 | 602982.465 | 5038.773 | 0.000 |
| Error | 7658.785 | 119.669 | - | - |
| Disability | ||||
| Intercept | 79485.062 | 79485.062 | 5039.479 | 0.000 |
| Error | 1009.438 | 15.772 | - | - |
Table 4.
Mauchly's Test of Sphericity for Pain, Fear, and Disability in All Groups
| Source | Mauchly's W | Approximate Chi-Square | P Value | Epsilon | ||
|---|---|---|---|---|---|---|
| Greenhouse-Geisser | Huynh-Feldt | Huynh-Feldt | ||||
| Pain (PCS) | 0.465 | 48.067 | 0.000 | 0.708 | 0.733 | 0.333 |
| Pain (BPI) | 0.707 | 21.713 | 0.001 | 0.838 | 0.875 | 0.333 |
| Fear | 0.697 | 22.685 | 0.000 | 0.825 | 0.861 | 0.333 |
| Disability | 0.516 | 41.461 | 0.000 | 0.763 | 0.793 | 0.333 |
5. Discussion
Lumbar spine surgery is commonly performed in clinical practice and is considered a high-risk procedure. Patients undergoing LSS experience various complications, including physical and psychological ones (13-15). According to our results, the mean (SD) PCS score was equal to 54.87 (8.93) in our patients. In a study on 275 patients with LBP, Ogunlana et al. showed that the mean (SD) PCS scores of low (with a score less than 26) and high (with a score higher than 26) catastrophisers were equal to 6.7 (2.1) and 8 (1.5), respectively (25). It should be noted that we included only patients who needed surgery, but Ogunlana et al. investigated outpatients with LBP as well (25), which may justify the high pain score (i.e., 54) observed by them compared to our patients’ scores (6.7 and 8).
Our results also revealed that the prevalence of pain and the PCS score decreased after LSS. The mean (SD) of pain intensity in our patients was equal to 54.87 (8.93) before the surgery, which decreased to 20.52 (5.74) nine weeks after LSS. The PCS score was obtained as 7.9 (1.12) before LSS and decreased to 3.09 (1.43) nine weeks after LSS. In another study on 68 patients undergoing LSS, with a mean age of 57.9 years, Coronado et al. noted that the LBP pain intensity score in these patients decreased from 2.8 in the sixth week to 2.1 in the sixth month. Also, the mean pain interference decreased from 3.3 ± 2.9 in the sixth week to 2.5 ± 2.8 in the sixth month post-surgery (13). In a study on patients undergoing spinal stenosis surgery, Hébert et al. reported that the pain intensity and disability of the patients decreased 24 months after surgery (26).
According to our results, the means (SD) of patients’ disability scores decreased from 18.01 (3.12) in pre-surgery to 12.92 (3.1) in post-surgery. In the study of Yee et al., the mean (SD) score of disability was equal to 16.8 ± 17.9, 18.4 ± 17.5, and 19.7 ± 17.7 at 3, 12, and 24 months after surgery, indicating 6.8%, 5.8%, and 6% improvement, respectively (27). Likewise, pain intensity and disability decreased in the patients undergoing LSS surgery, indicating the beneficial role of this procedure in improving the condition of patients (28).
5.1. Conclusions
Considering that LSS can be effective in alleviating pain and reducing disability and fear of movement in patients with LBP, it is recommended to offer this intervention to patients who need surgical management according to relevant diagnostic criteria and clinical examinations.