


1. Background
2. Objectives
3. Methods
3.1. Inclusion Criteria
3.2. Patients’ Follow-up
3.3. Statistical Analysis
4. Results
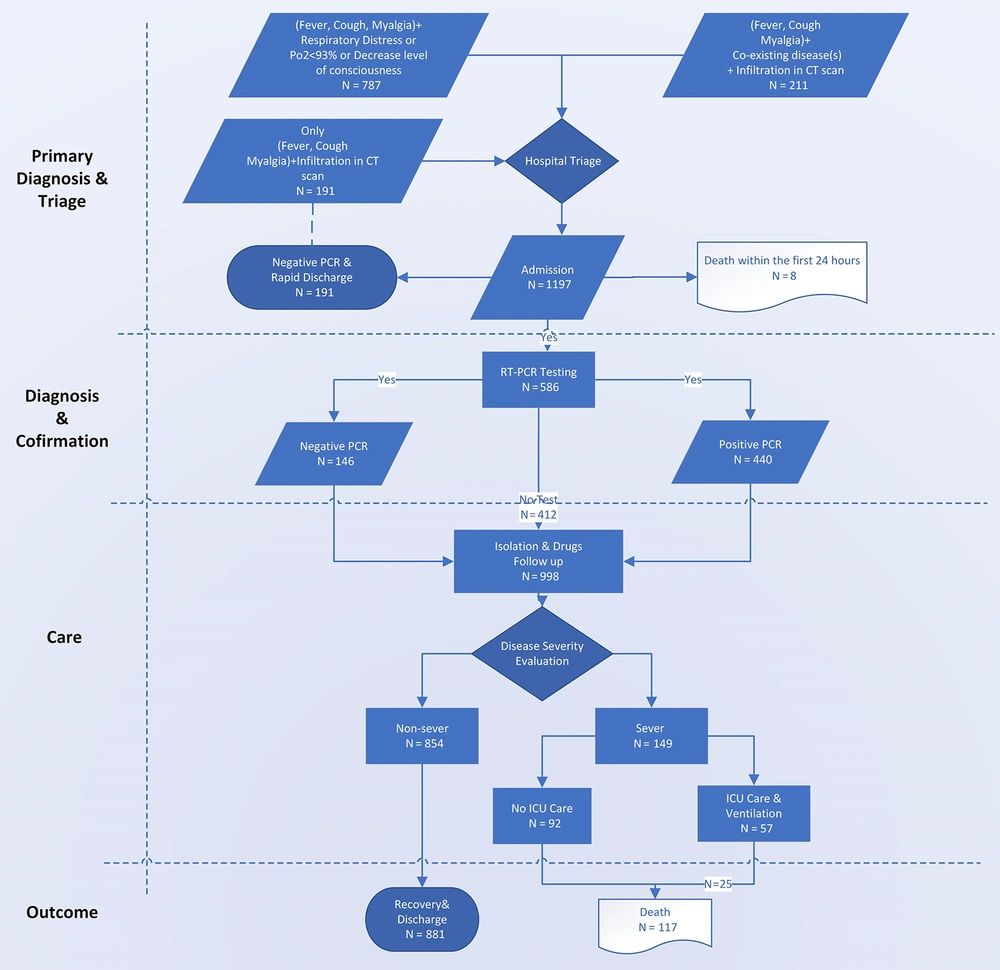
The patients’ flow diagram
| Variables | Week 1 (N = 116) | Week 2 (N = 399) | Week 3 (N = 483) | Total (N = 998) |
|---|---|---|---|---|
| Sex | ||||
| Female | 57 (49.14) | 168 (42.11) | 204 (42.24) | 429 (42.99) |
| Male | 59 (50.86) | 231 (57.89) | 279 (57.76) | 569 (57.01) |
| Age group (y) | ||||
| < 50 | 55 (47.41) | 167 (41.85) | 180 (37.27) | 420 (40.28) |
| 51 - 60 | 21 (18.10) | 86 (21.55) | 85 (17.60) | 192 (19.24) |
| 61 - 70 | 17 (14.66) | 74 (18.55) | 96 (19.88) | 187 (18.74) |
| ≥ 70 | 23 (19.83) | 72 (18.05) | 122 (25.26) | 217 (21.74) |
| Admission criteria | ||||
| Minor clinical criteria b plus at least one major criteria c | 92 (79.31) | 317 (79.45) | 378 (78.26) | 787 (78.86) |
| Co-existing disorders OR immunodeficiency d | 24 (20.69) | 82 (20.55) | 105 (21.74) | 211 (21.14) |
| rRT-PCR test status | ||||
| Positive | 33 (28.45) | 200 (50.13) | 207 (42.86) | 440 (44.09) |
| Negative | 20 (17.24) | 49 (12.28) | 77 (15.94) | 146 (14.63) |
| Not tested | 63 (54.31) | 150 (37.59) | 199 (41.20) | 412 (41.28) |
| ICU admission | ||||
| No | 108 (93.10) | 377 (94.49) | 461 (95.45) | 946 (94.70) |
| Yes | 8 (6.90) | 22 (5.51) | 22 (4.55) | 52 (5.21) |
| Co-existing disorders | ||||
| Two or more comorbidities | 12 (12.12) | 32 (9.94) | 36 (9.00) | 80 (9.74) |
| Cardiovascular diseases | 16 (13.79) | 41 (10.28) | 53 (10.97) | 110 (11.02) |
| Diabetes | 13 (11.21) | 43 (10.78) | 49 (10.14) | 105 (10.52) |
| Hypertension | 4 (3.45) | 30 (7.52) | 23 (4.76) | 57 (5.71) |
| Chronic pulmonary diseases | 4 (3.45) | 17 (4.26) | 9 (1.86) | 30 (3.01) |
| Immunodeficiency d | 1 (0.86) | 6 (1.50) | 9 (1.86) | 16 (1.60) |
| Chronic renal diseases | 1 (0.86) | 4 (1.00) | 5 (1.04) | 10 (1.00) |
| Total | 30 (25.86) | 111 (27.82) | 124 (25.67) | 265 (26.55) |
| Hospital type | ||||
| Teaching | 92 (79.31) | 317 (79.45) | 360 (74.53) | 769 (77.05) |
| High volume non-teaching | 17 (14.66) | 78 (19.55) | 117 (24.22) | 212 (21.24) |
| Low volume e non-teaching | 7 (6.03) | 4 (1.00) | 6 (1.24) | 17 (1.70) |
| Outcome | ||||
| Recovery | 104 (89.66) | 352 (88.22) | 425 (87.99) | 881 (88.28) |
| Death | 12 (10.34) | 47 (11.78) | 58 (12.01) | 117 (11.72) |
a Values are expressed as a proportion (%) of the total number of patients for each week, as well as the total.
b Minor clinical criteria: Fever, cough, and myalgia.
c Major clinical criteria: Low SpO2, shortness of breath, unconsciousness.
d Immunodeficiency includes HIV infection and AIDS, cancer, immunodeficiency disorders, and receiving chemotherapy.
e Low volume hospitals indicate hospitals with less than 20 admitted COVID-19 patients.
| Variables | Total (N = 998) | Non-survivors; N = 117 (11.7%) | Survivors; N = 881 (88.3%) | P Value | ||
|---|---|---|---|---|---|---|
| Outside ICU (N = 92) | Inside ICU (N = 25) | Outside ICU (N = 854 | Inside ICU (N = 27) | |||
| Sex | ||||||
| Female | 429 (42.99) | 40 (9.32) | 8 (1.87) | 368 (85.78) | 13 (3.03) | |
| Male | 569 (57.01) | 52 (9.14) | 17 (2.99) | 486 (85.41) | 14 (2.46) | 0.674 |
| Age group (y) | ||||||
| < 50 | 402 (40.28) | 17 (4.05) | 7 (6.67) | 372 (88.57) | 6 (1.43) | |
| 51 - 60 | 192 (19.24) | 9 (4.69) | 3 (1.56) | 174 (90.63) | 6 (3.13) | |
| 61 - 70 | 187 (18.74) | 16 (8.56) | 6 (3.21) | 160 (85.56) | 5 (2.67) | |
| ≥ 70 | 217 (21.74) | 50 (23.04) | 9 (4.15) | 148 (68.20) | 10 (4.61) | < 0.001 |
| RT-PCR test status | ||||||
| Positive | 440 (44.09) | 74 (16.82) | 17 (3.86) | 344 (78.18) | 5 (1.14) | |
| Negative | 146 (14.63) | 6 (4.11) | 5 (3.42) | 123 (84.25) | 12 (8.22) | |
| Not tested | 412 (41.28) | 12 (2.91) | 3 (0.73) | 387 (93.93) | 10 (2.43) | < 0.001 |
| Symptoms | ||||||
| Fever | 545 (54.61) | 50 (9.17) | 8 (1.47) | 476 (87.34) | 11 (2.02) | 0.053 |
| Cough | 666 (66.73) | 63 (9.46) | 15 (2.25) | 583 (87.54) | 8 (1.20) | < 0.001 |
| Myalgia | 301 (30.16) | 22 (7.31) | 3 (1.00) | 271 (90.03) | 5 (1.66) | 0.039 |
| Shortness of breath | 573 (57.42) | 58 (10.12) | 21 (3.67) | 477 (83.25) | 17 (2.97) | 0.022 |
| SpO2 < 93% | 612 (61.32) | 61 (9.97) | 17 (2.78) | 513 (83.82) | 21 (3.43) | 0.166 |
| Unconsciousness | 31 (3.11) | 4 (12.90) | 7 (22.58) | 12 (38.71) | 9 (29.03) | < 0.001 |
| Minor clinical criteria | 185 (18.54) | 13 (7.03) | 3 (1.62) | 166 (89.73) | 3 (1.62) | 0.343 |
| Major clinical criteria | 17 (1.70) | 3 (17.65) | 6 (35.29) | 3 (17.65) | 5 (29.41) | < 0.001 |
| Co-existing disorders | ||||||
| Cardiovascular disease | 110 (11.02) | 20 (18.18) | 6 (5.46) | 81 (73.64) | 3 (2.73) | 0.001 |
| Diabetes | 105 (10.52) | 15 (14.29) | 4 (3.81) | 84 (80.00) | 2 (1.91) | 0.189 |
| ≥ 2 co-morbidities | 80 (9.74) | 15 (18.75) | 5 (6.25) | 55 (68.75) | 5 (6.25) | < 0.001 |
| Hypertension | 57 (5.71) | 7 (12.28) | 5 (8.77) | 41 (71.93) | 4 (7.02) | 0.001 |
| Chronic pulmonary disease | 30 (3.01) | 4 (13.33) | 1 (3.33) | 23 (76.67) | 2 (6.67) | 0.435 |
| Immunodeficiency | 16 (1.60) | 2 (12.50) | 3 (18.75) | 10 (62.50) | 1 (6.25) | < 0.001 |
| Chronic renal disease | 10 (1.00) | 2 (20.00) | 2 (20.00) | 6 (60.00) | 0 (0.00) | 0.002 |
| Week of admission | ||||||
| 1st | 116 | 8 (6.90) | 4 (3.45) | 100 (86.21) | 4 (3.45) | |
| 2nd | 399 | 36 (9.02) | 11 (2.76) | 341 (85.46) | 11 (2.76) | |
| 3rd | 483 | 48 (9.94) | 10 (2.07) | 413 (85.51) | 12 (2.49) | 0.903 |
| Hospital type | ||||||
| Teaching hospital | 769 (77.05) | 71 (9.23) | 22 (2.86) | 658 (85.57) | 18 (2.34) | |
| High volume non-teaching | 212 (21.24) | 20 (9.43) | 2 (0.94) | 184 (86.79) | 6 (2.83) | |
| Low volume non- teaching | 17 (1.70) | 1 (5.88) | 1 (5.88) | 12 (70.59) | 3 (17.65) | 0.005 |
a Values are expressed as a proportion (%) of the total number of patients for each week, as well as the total.
b The chi-square test was used to compare groups.
c Minor clinical criteria: Fever, cough, and myalgia.
d Major clinical criteria: Low SpO2, shortness of breath, unconsciousness.
e Immunodeficiency includes HIV infection and AIDS, cancer, immunodeficiency disorders, and receiving chemotherapy.
f Low volume hospitals indicate hospitals with less than 20 admitted COVID-19 patients.
| Variables | RT-PCR Test Status | RT-PCR Test Results | ||||
|---|---|---|---|---|---|---|
| Tested (N = 586) | Not Tested (N = 412) | P Value | Test Positive (N = 440) | Test Negative (N = 146) | P Value | |
| Sex | ||||||
| Female | 243 (56.64) | 186 (43.36) | 188 (77.37) | 55 (22.63) | ||
| Male | 343 (60.28) | 226 (39.72) | 0.248 | 252 (73.47) | 91 (26.53) | 0.283 |
| Age group (y) | ||||||
| < 50 | 221 (54.98) | 181 (45.02) | 168 (76.02) | 53 (23.98) | ||
| 51 - 60 | 101 (52.60) | 91 (47.40) | 73 (72.28) | 28 (27.72) | ||
| 61 - 70 | 119 (63.64) | 68 (36.36) | 90 (75.63) | 29 (24.37) | ||
| ≥ 70 | 145 (66.82) | 72 (33.18) | 0.005 | 109 (75.17) | 36 (24.83) | 0.908 |
| ICU admission | ||||||
| Yes | 39 (75.00) | 13 (25.00) | 22 (56.41) | 17 (43.59) | ||
| No | 547 (57.82) | 399 (42.18) | 0.014 | 418 (76.42) | 129 (23.58) | 0.005 |
| Co-existing disorders | ||||||
| No | 405 (55.25) | 328 (44.75) | 310 (76.54) | 95 (23.46) | ||
| Yes | 181 (68.30) | 84 (31.70) | < 0.001 | 130 (71.82) | 51 (28.18) | 0.222 |
| ≥ 2 Comorbidities | 60 (75.00) | 20 (25.00) | 0.001 | 40 (66.67) | 20 (33.33) | 0.096 |
| Cardiovascular diseases | 80 (72.73) | 30 (27.27) | 0.002 | 56 (70.00) | 24 (30.00) | 0.258 |
| Chronic pulmonary diseases | 22 (73.33) | 8 (26.67) | 0.099 | 16 (72.73) | 6 (27.27) | 0.794 |
| Diabetes | 74 (70.48) | 31 (29.52) | 0.010 | 54 (72.97) | 20 (27.03) | 0.653 |
| Hypertension | 38 (66.67) | 19 (33.33) | 0.209 | 26 (68.42) | 12 (31.58) | 0.326 |
| Immunodeficiency | 9 (56.25) | 7 (43.75) | 0.840 | 5 (55.56) | 4 (44.44) | 0.172 |
| Chronic renal diseases | 7 (70.00) | 3 (30.00) | 0.466 | 5 (71.43) | 2 (28.57) | 0.822 |
| Signs and symptoms | ||||||
| Any sign | 551 (57.22) | 412 (42.78) | < 0.001 | 405 (73.50) | 146 (26.50) | < 0.001 |
| Fever | 293 (53.76) | 252 (46.24) | < 0.001 | 224 (76.45) | 69 (23.55) | 0.445 |
| Cough | 376 (55.90) | 295 (44.10) | 0.010 | 288 (77.01) | 86 (22.99) | 0.153 |
| Myalgia | 159 (52.82) | 142 (47.18) | 0.013 | 119 (74.84) | 40 (25.16) | 0.934 |
| Shortness of breath | 301 (52.53) | 272 (47.47) | < 0.001 | 217 (72.09) | 84 (27.91) | 0.085 |
| SpO2 < 93% | 313 (51.14) | 299 (48.86) | < 0.001 | 221 (70.61) | 92 (29.39) | 0.007 |
| Unconsciousness | 22 (68.75) | 10 (31.25) | 0.241 | 11 (50.00) | 11 (50.00) | 0.006 |
| Outcome | ||||||
| Recovery | 484 (54.94) | 397 (45.06) | 349 (72.11) | 135 (27.89) | ||
| Death | 102 (87.18) | 15 (12.82) | < 0.001 | 91 (89.22) | 11 (10.78) | < 0.001 |
| Admission week | ||||||
| 1st | 53 (45.69) | 63 (54.31) | 33 (62.26) | 20 (37.74) | ||
| 2nd | 249 (62.41) | 150 (37.59) | 200 (80.32) | 49 (19.68) | ||
| 3rd | 284 (50.80) | 199 (41.20) | 0.006 | 207 (72.89) | 77 (27.11) | 0.011 |
a Values are expressed as a proportion (%) of the total number of patients for each week, as well as the total.
b The chi-square test was used to compare groups.
c Immunodeficiency includes HIV infection and AIDS, cancer, immunodeficiency disorders, and receiving chemotherapy.
| Subgroups | Number of Deaths (%) | Odds Ratio (95% CI) | P Value |
|---|---|---|---|
| Sex | |||
| Female | 48 (11.19) | Reference | |
| Male | 69 (12.13) | 1.16 (0.74, 1.81) | 0.511 |
| Age group (y) | |||
| < 50 | 24 (5.97) | Reference | |
| 50 - 59 | 12 (6.25) | 0.97 (0.44, 2.11) | 0.942 |
| 60 - 69 | 22 (11.76) | 1.73 (0.89, 3.35) | 0.101 |
| ≥ 70 | 59 (27.19) | 5.15 (2.91, 9.12) | < 0.001 |
| ICU admission | |||
| No | 92 (9.73) | Reference | |
| Yes | 25 (48.08) | 11.46 (5.53, 23.86) | < 0.001 |
| RT-PCR test status | |||
| Negative | 11 (7.53) | Reference | |
| Positive | 91 (20.68) | 5.75 (2.65, 12.48) | < 0.001 |
| Not tested | 15 (3.64) | 0.74 (0.30, 1.84) | 0.531 |
| Co-existing disorder | |||
| Without co-existing disorder | 67 (9.14) | Reference | |
| All | 50 (18.87) | 1.4 (0.91, 2.34) | 0.110 |
| ≥ 2 Co-disorders | 20 (25.02) | 1.82 (0.92, 3.60) | 0.081 |
| Cardiovascular diseases | 26 (23.64) | 1.57 (0.86, 2.87) | 0.186 |
| Chronic pulmonary diseases | 5 (16.67) | 1.28 (0.43, 3.79) | 0.438 |
| Diabetes | 19 (18.10) | 1.39 (0.73, 2.64) | 0.287 |
| Chronic renal disease | 4 (40.00) | 3.07 (0.55, 17.08) | 0.164 |
| Immunodeficiency | 5 (31.25) | 4.3 (1.11, 17.23) | 0.035 |
| Hypertension | 12 (21.05) | 0.99 (0.44, 2.20) | 0.991 |
| Admission week | |||
| 1st | 12 (10.34) | Reference | |
| 2nd | 47 (11.78) | 0.77 (0.32, 1.75) | 0.536 |
| 3rd | 58 (12.01) | 0.92 (0.41, 2.05) | 0.845 |
| Type of hospital | |||
| Teaching hospitals | 93 (12.09) | Reference | |
| High-volume non-teaching | 22 (10.38) | 0.61 (0.32, 1.11) | 0.140 |
| Low-volume non-teaching | 2 (11.76) | 0.23 (0.03, 1.55) | 0.113 |
a A multivariate logistic regression analysis was performed to calculate the odds ratios (95% CIs).
b Immunodeficiency includes HIV infection and AIDS, cancer, immunodeficiency disorders, and receiving chemotherapy.
c Low-volume hospitals indicate hospitals with less than 20 admitted COVID-19 patients.
5. Discussion
| Group | In-Hospital Mortality (95% CI) | Odds Ratio (95% CI) | P-Value |
|---|---|---|---|
| Test negative/no ICU | 6.1 (5.7, 6.9) | Reference | |
| Test positive/no ICU | 19.0 (18.2, 19.8) | 4.0 (1.8, 8.9) | 0.001 |
| No test/no ICU | 3.5 (3.2, 3.7) | 0.5 (0.2, 1.3) | 0.202 |
| Test negative/ICU | 12.6 (11.9, 13.2) | 2.3 (0.5, 10.4) | 0.264 |
| Test positive/ICU | 44.4 (43.2, 45.6) | 16.8 (5.6, 49.7) | < 0.001 |
| No test/ICU | 12.2 (11.6, 12.8) | 2.2 (0.2, 20.7) | 0.467 |


