


1. Background
2. Objectives
3. Patients and Methods
3.1. Study Design and Participants
3.2. Data Collection
3.3. Imaging Evaluation and Definitions
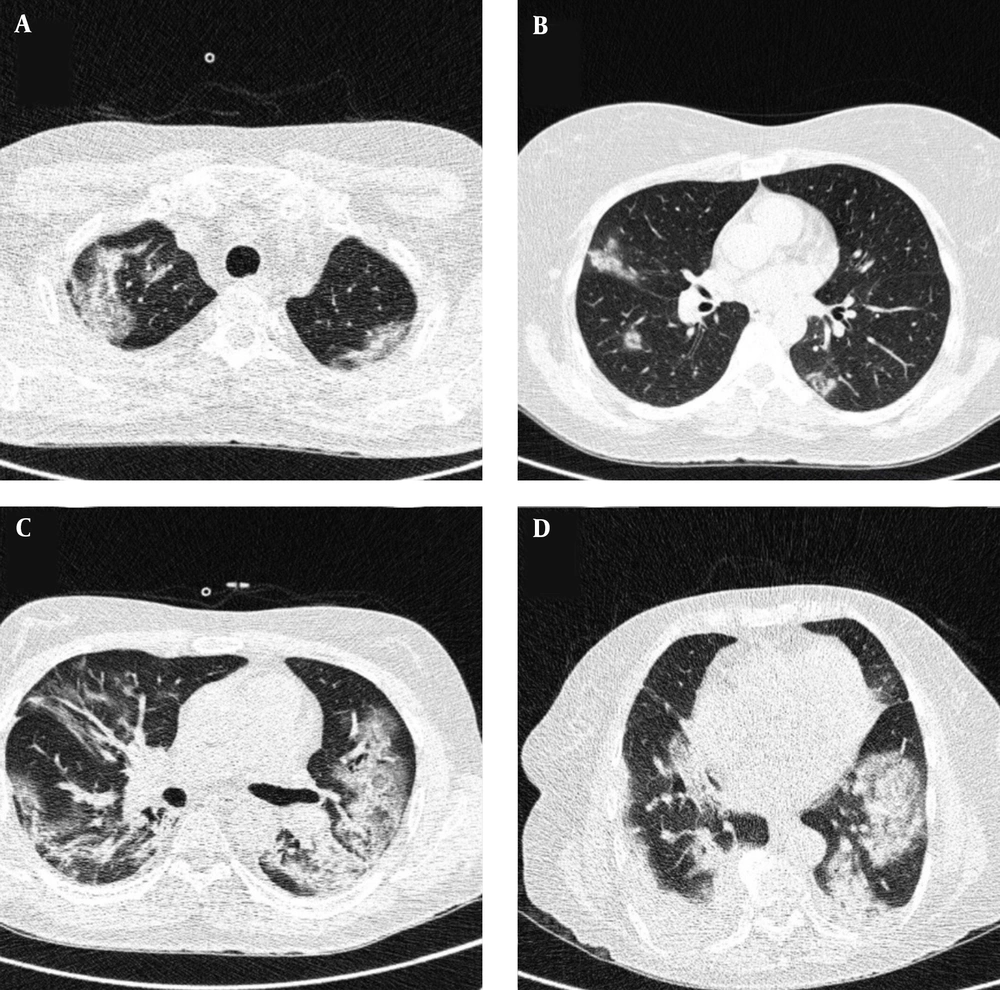
Typical CT imaging features of COVID-19. Unenhanced thin-section axial image of the lungs in a patient with a positive RT-PCR result (A-D) shows peripheral and multifocal ground glass opacity (GGO) with consolidation.
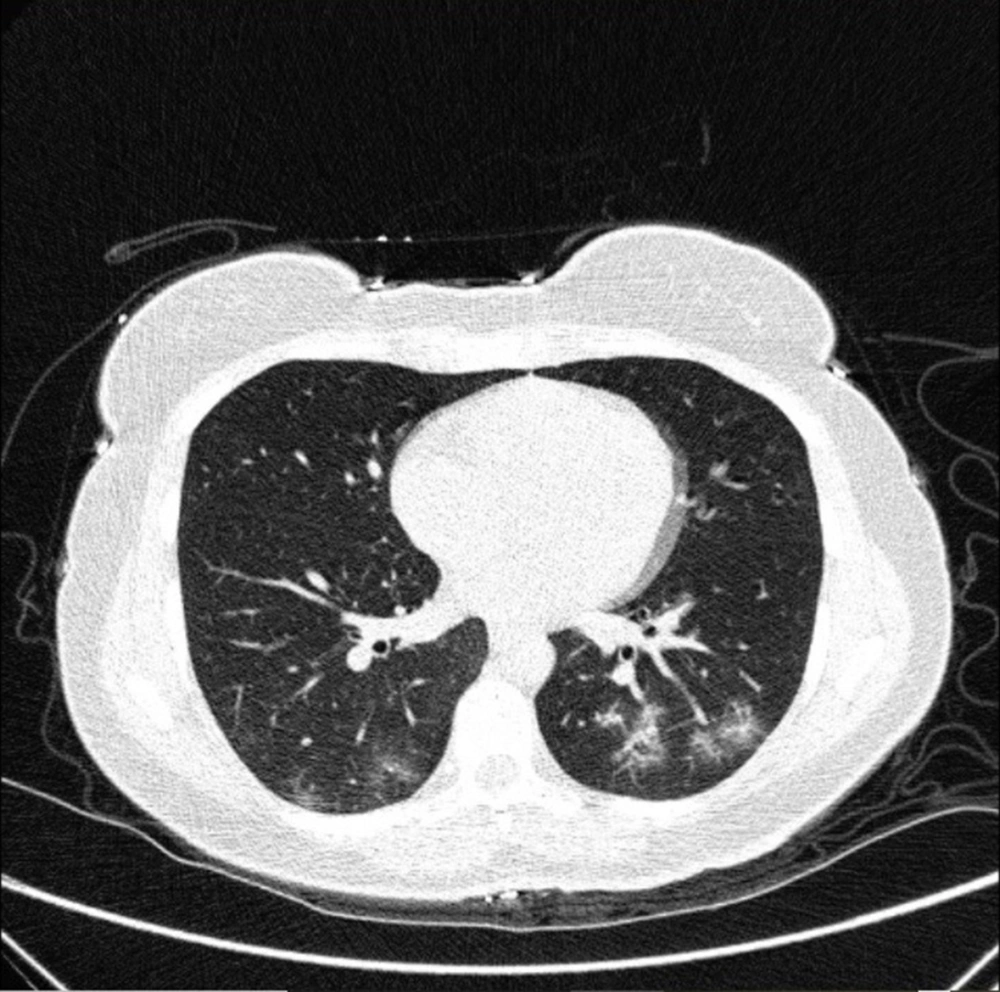
Typical CT imaging features of COVID-19. Unenhanced thin-section axial image of the lungs in a patient with a positive RT-PCR result shows multifocal ground glass opacity (GGO) with rounded morphology, with or without consolidation or a crazy paving pattern.
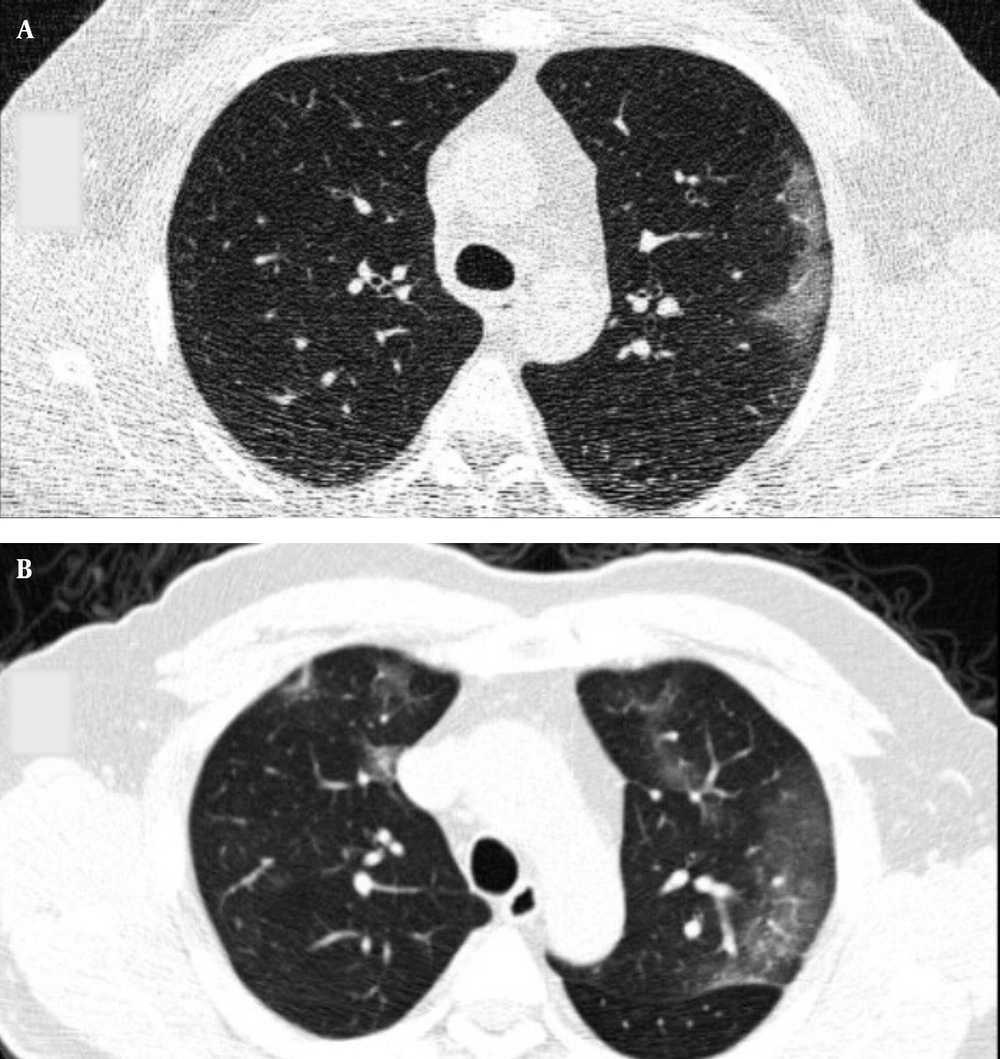
Typical CT imaging features of COVID-19. Unenhanced thin-section axial image of the lungs in a patient with a positive RT-PCR shows peripheral ground glass opacity (GGO), with or without consolidation or visible intralobular lines (crazy paving pattern).
Typical CT imaging features of COVID-19. Unenhanced thin-section axial image of the lungs in a patient with a positive RT-PCR shows peripheral ground glass opacity (GGO) with a crazy paving pattern and reverse halo sign.
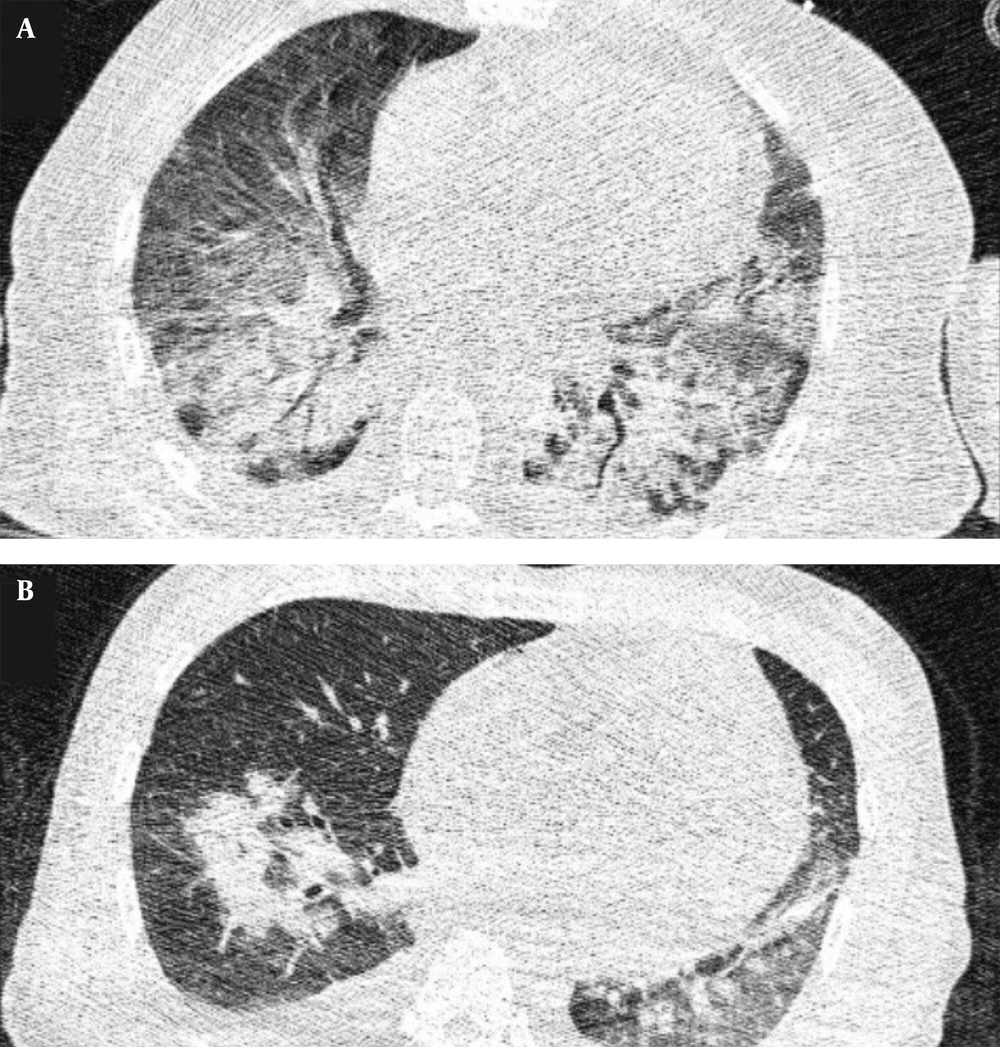
A and B, Indeterminate CT imaging features of COVID-19. Unenhanced thin-section axial image of the lungs in a patient with a positive RT-PCR shows bilateral ground glass opacity (GGO) with consolidation, without a specific distribution (non-rounded or non-peripheral) associated with bilateral pleural effusion.
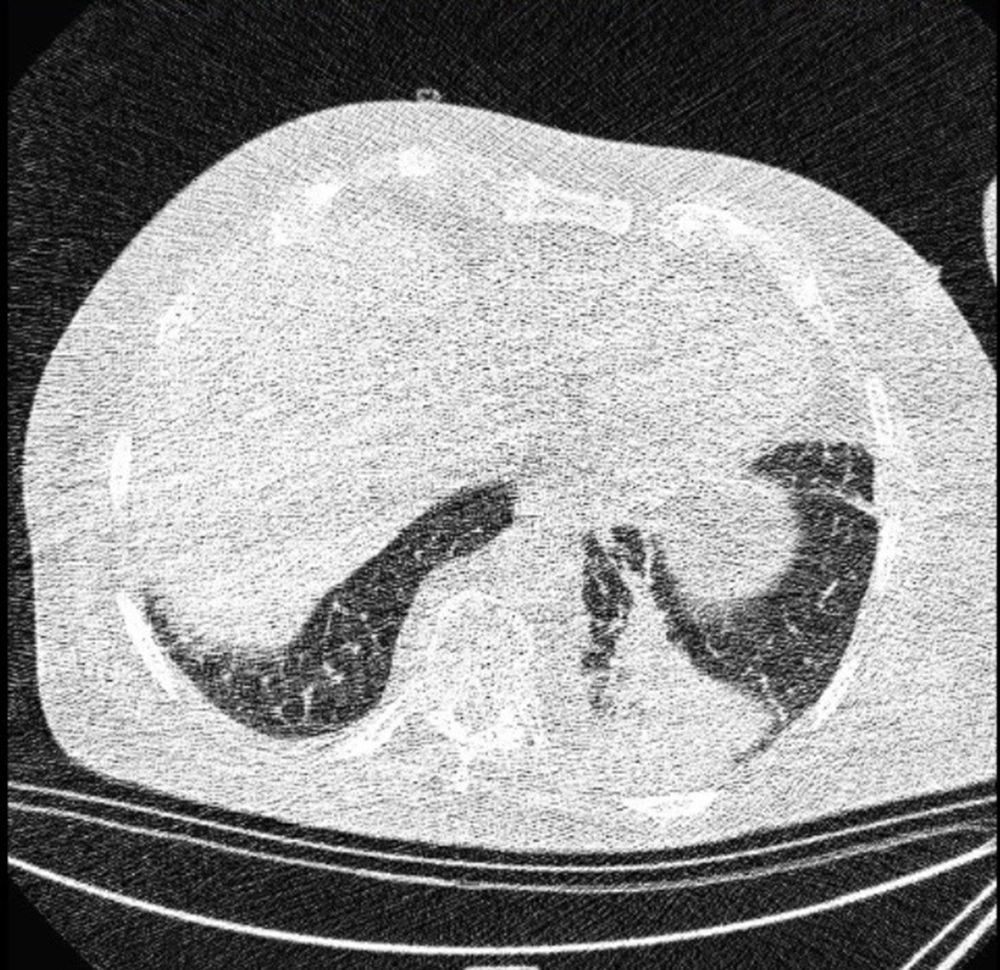
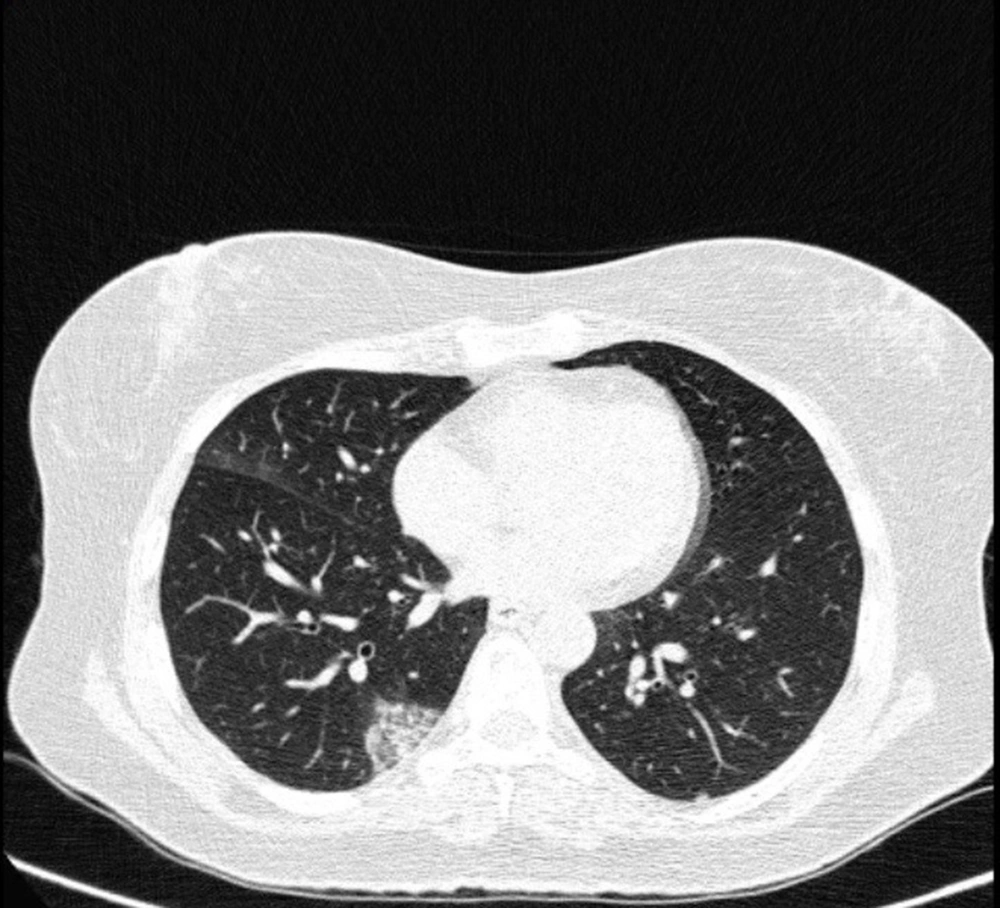
Atypical CT imaging features of COVID-19. Unenhanced thin-section axial image of the lungs in a patient with a positive RT-PCR shows segmental consolidation without ground glass opacity (GGO).
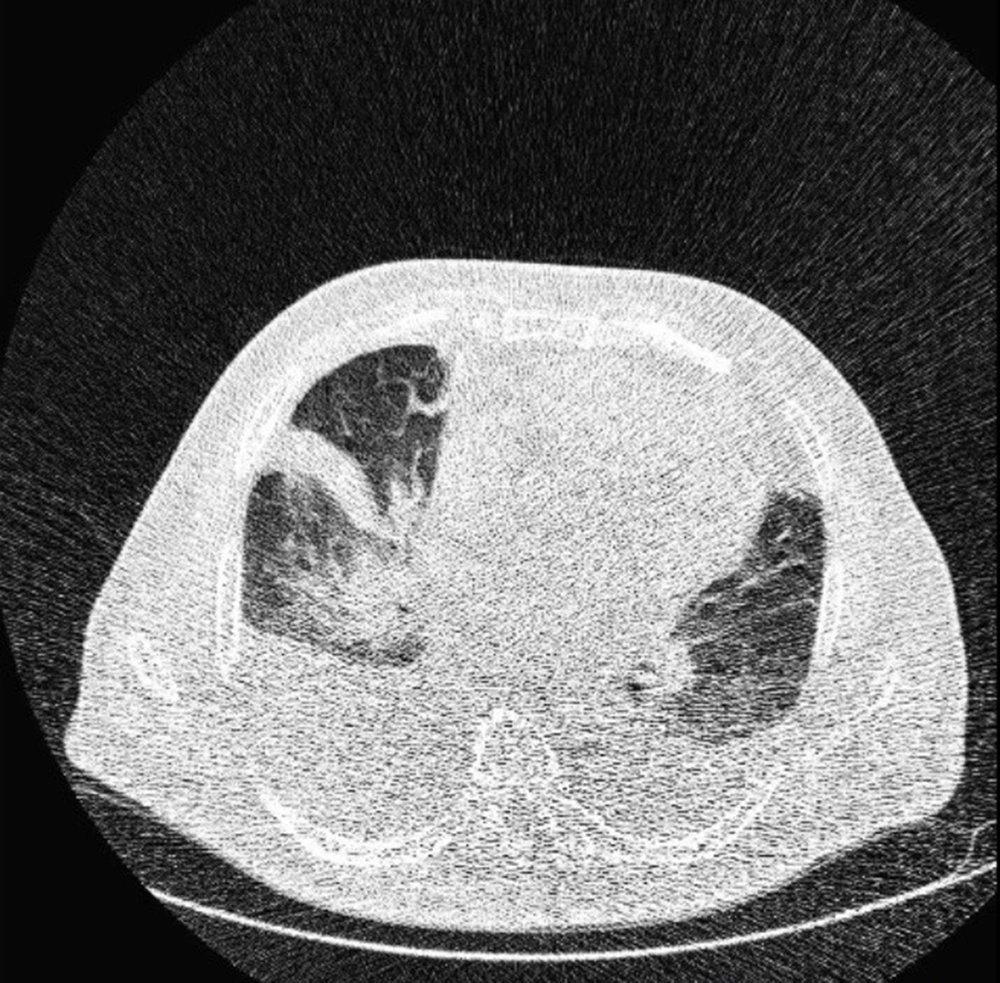
Atypical CT imaging features of COVID-19. Unenhanced thin-section axial image of the lungs in a patient with a positive RT-PCR result shows consolidation without ground glass opacity (GGO) and bilateral pleural effusion.
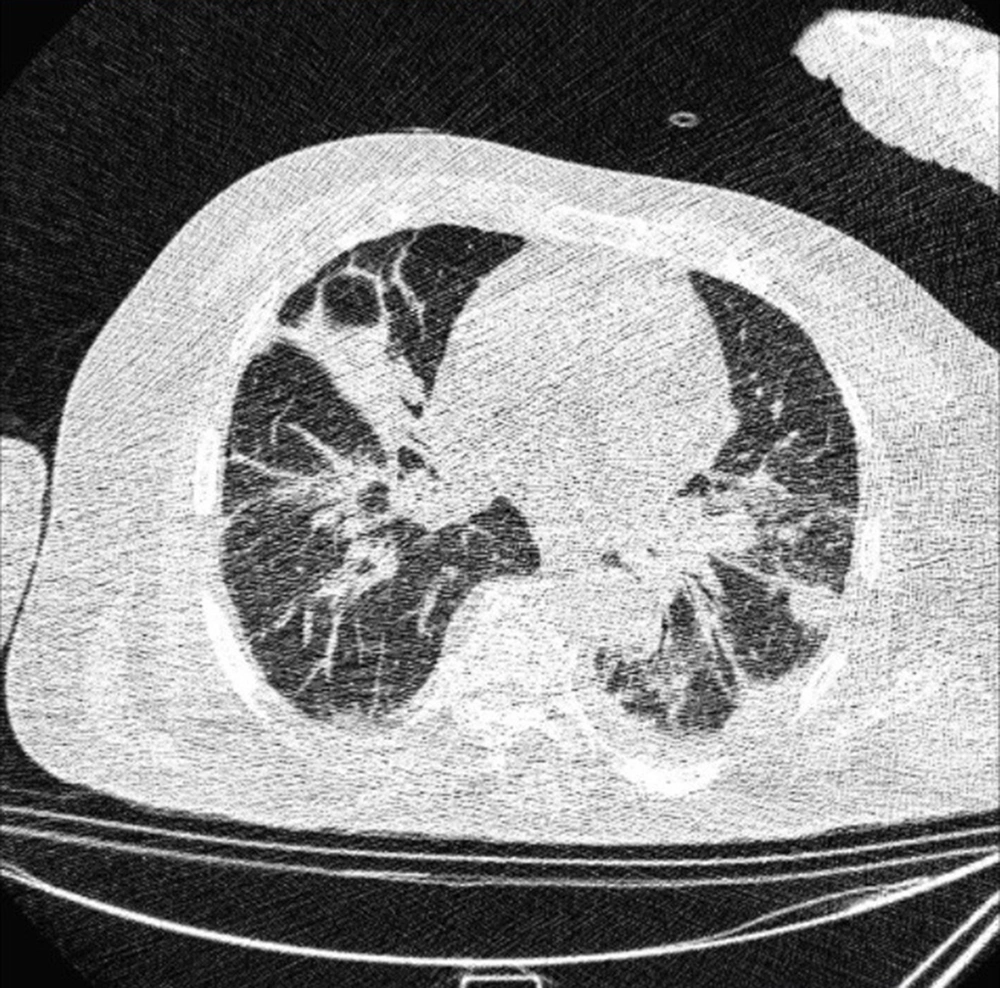
Atypical CT imaging features of COVID-19. Unenhanced thin-section axial image of the lungs in a patient with a positive RT-PCR shows subsegmental consolidation and reticulation with pleural effusion.
3.4. CT Imaging Setting
3.5. Statistical Analysis
4. Results
| Discharged (n = 53) | Expired (n = 62) | P-valueb | ||
|---|---|---|---|---|
| Ward admission (n = 29) | ICU admission (n = 24) | |||
| Age, y | 50.5 ± 13.2 | 63.5 ± 10.6 | 67.9 ± 10.3 | < 0.0001 |
| Male gender | 17 (58.6) | 17 (70.8) | 46 (74.2) | 0.24 |
| Smoking status, packs/y | 3.7 ± 5.8 | 5.8 ± 8.6 | 5.7 ± 7.2 | 0.36 |
| History of close contact with a suspected COVID-19 patient | 7 (24.1) | 10 (41.7) | 18 (29.0) | 0.72 |
| Comorbidities | ||||
| Comorbidity | 14 (48.3) | 18 (75) | 49 (79.0) | 0.028 |
| Hypertensive disorder | 7 (24.1) | 12 (50) | 24 (38.7) | 0.75 |
| Ischemic heart disease | 5 (17.2) | 9 (37.5) | 28 (45.2) | 0.037 |
| Diabetes | 3 (10.3) | 13 (54.2) | 25 (40.3) | 0.26 |
| Chronic obstructive pulmonary disease | 2 (6.9) | 7 (29.2) | 12 (19.3) | 0.74 |
| Chronic kidney disease | 1 (3.4) | 3 (12.5) | 7 (11.3) | 0.49 |
| Chronic hepatitis or cirrhosis | 1 (3.4) | 4 (25) | 7 (11.3) | 0.74 |
| Cerebral infarction | 0 (0) | 2 (8.3) | 8 (12.9) | 0.08 |
| Malignancies | 1 (3.4) | 5 (20.8) | 6 (9.6) | 0.77 |
| Acute respiratory distress syndrome | 0 (0) | 19 (79.2) | 60 (96.8) | < 0.0001 |
| Clinical presentations | ||||
| Fever, °C | ||||
| > 37.3 | 23 (79.3) | 24 (100) | 62 (100) | 0.021 |
| 37.3 - 38 | 16 (55.2) | 10 (41.7) | 38 (61.3) | 0.22 |
| 38 - 39 | 6 (20.7) | 10 (41.7) | 14 (22.6) | 0.35 |
| > 39 | 1 (3.4) | 4 (25) | 10 (16.1) | 0.28 |
| Oxygen saturation | 90 ± 1.7 | 85 ± 2.2 | 84 ± 2.4 | 0.001 |
| Cough | 22 (75.9) | 19 (79.2) | 55 (88.7) | 0.10 |
| Dyspnea | 23 (79.3) | 24 (100) | 61 (98.3) | 0.029 |
| Myalgia | 10 (34.5) | 16 (66.7) | 25 (40.3) | 0.35 |
| Anosmia | 7 (24.1) | 9 (37.5) | 10 (16.1) | 0.72 |
| Rhinorrhea | 3 (10.3) | 1 (4.2) | 5 (8.1) | 0.91 |
| Sputum | 6 (20.7) | 6 (25) | 15 (24.2) | 0.26 |
| Sneezing | 0(0) | 1 (4.2) | 1 (1.6) | 0.91 |
| Ageusia/dysgeusia | 2 (6.9) | 0 (0) | 4 (6.4) | 0.51 |
| Diarrhea | 7 (24.1) | 9 (37.5) | 12 (19.3) | 0.17 |
| Vomiting | 7 (24.1) | 5 (20.8) | 10 (16.1) | 0.78 |
| Anorexia | 0 (0) | 2 (8.3) | 2 (3.2) | 0.87 |
| Laboratory findings | ||||
| Leukocyte count, × 109/L | 5.9 ± 3.9 | 7.2 ± 4.2 | 9.2 ± 7.5 | 0.037 |
| ≥ 11 | 2 (6.9) | 9 (37.5) | 28 (45.2) | 0.005 |
| Lymphocyte count, × 109/L | 1.3 ± 1.5 | 1.0 ± 1.1 | 0.7 ± 0.6 | 0.032 |
| < 1.0 | 5 (17.2) | 16 (66.7) | 53 (85.5) | < 0.0001 |
| Platelet count, × 109/L | 156.3 ± 31.9 | 168.5 ± 43.7 | 166.8 ± 64.2 | 0.53 |
| ≥ 450 | 0 (0) | 4 (16.7) | 8 (12.9) | 0.82 |
| CRP, mg/L | 35.8 ± 18.8 | 70.9 ± 29.6 | 66.8 ± 22.6 | 0.002 |
| D-dimer, mg/L | 2.8 ± 0.3 | 4.4 ± 0.6 | 5.0 ± 1.1 | < 0.0001 |
| Lactate dehydrogenase, U/L | 293 ± 31.3 | 316 ± 36.6 | 317.9 ± 50.2 | 0.39 |
Abbreviation: CRP, C-reactive protein.
aValues are expressed as mean ± SD or No. (%).
bDifferences between discharged and expired groups. Significant P-values are shown in three decimal places. For non-significant cases, two decimals are reported.
| Discharged | Expired (n = 62) | P-valueb | ||
|---|---|---|---|---|
| Ward admission (n = 29) | ICU admission (n = 24) | |||
| Symptom onset before CT imaging | 5.6 ± 2.4 | 6.8 ± 2.7 | 9.8 ± 3.8 | < 0.001 |
| RSNA standard reporting | ||||
| Typical | 13 (44.8) | 17 (70.8) | 48 (77.4) | 0.017 |
| Intermediate | 8 (27.6) | 3 (12.5) | 10 (16.1) | 0.52 |
| Atypical | 5 (17.2) | 2 (8.3) | 4 (6.4) | 0.21 |
| Negative | 3 (10.3) | 2 (8.3) | 0 (0) | 0.018 |
| Involved lobes | 2.1 ± 1.4 | 2.7 ± 1.2 | 3.2 ± 2.4 | 0.032 |
| 0 - 1 | 9 (31.0) | 3 (12.5) | 6 (9.7) | 0.56 |
| 2 - 3 | 16 (55.2) | 16 (66.7) | 28 (45.2) | 0.10 |
| 4 - 5 | 4 (13.8) | 5 (20.8) | 28 (45.2) | 0.001 |
| Lobar involvement | ||||
| Right upper | 19 (65.5) | 18 (75) | 62 (100) | < 0.0001 |
| Right middle | 14 (48.3) | 16 (66.7) | 46 (74.2) | 0.047 |
| Right lower | 21 (72.4) | 22 (83.3) | 42 (67.7) | 0.10 |
| Left upper | 23 (79.3) | 21 (87.5) | 50 (80.6) | 0.61 |
| Left lower | 25 (86.2) | 23 (95.8) | 51 (82.2) | 0.19 |
| Involved segments | 8.1 ± 5.7 | 12.1 ± 5.0 | 12.7 ± 5.8 | 0.010 |
| < 10 | 18 (62.1) | 9 (37.5) | 20 (32.2) | 0.042 |
| 10 - 15 | 7 (24.1) | 6 (25) | 19 (30.6) | 0.46 |
| > 15 | 4 (13.8) | 9 (37.5) | 23 (37.1) | 0.14 |
| Anatomic side involvement | ||||
| Unilateral | 8 (27.6) | 4 (16.7) | 2 (3.2) | 0.001 |
| Bilateral | 21 (72.4) | 20 (83.3) | 60 (96.8) | 0.001 |
| Predominant distribution pattern | ||||
| Peripheral | 25 (86.2) | 24 (100) | 62 (100) | 0.11 |
| Central | 17 (58.6) | 22 (91.7) | 55 (88.7) | 0.036 |
| Ground glass opacification (GGO), > 50% | 11 (37.9) | 14 (58.3) | 35 (56.4) | 0.32 |
| Consolidation, > 50% | 12 (41.4) | 8 (33.3) | 21 (33.9) | 0.66 |
| Mixed GGO and consolidation | 6 (20.7) | 2 (8.3) | 6 (9.7) | 0.37 |
| Subpleural reticulation | 7 (24.1) | 10 (41.7) | 16 (25.8) | 0.45 |
| Crazy paving pattern | 3 (10.3) | 6 (25) | 7 (11.3) | 0.37 |
| Reverse halo | 4 (15.4) | 6 (25) | 19 (30.1) | 0.14 |
| Air bronchogram | 8 (27.6) | 11 (8.8) | 39 (62.9) | 0.038 |
| Pleural effusion | ||||
| Unilateral | 3 (10.3) | 7 (29.2) | 22 (35.5) | 0.047 |
| Mild | 1 (3.4) | 1 (4.2) | 5 (8.1) | 0.34 |
| Moderate | 2 (6.9) | 5 (20.8) | 6 (9.7) | 0.55 |
| Severe | 0 (0) | 1 (4.2) | 11 (17.7) | 0.005 |
| Bilateral | 1 (3.4) | 1 (4.2) | 2 (3.2) | 0.87 |
Abbreviation: RSNA, Radiological Society of North America.
aValues are expressed as mean ± SD or No. (%).
bDifferences between discharged and expired groups. Significant P-values are shown in three decimal places. For non-significant cases, two decimals are reported.
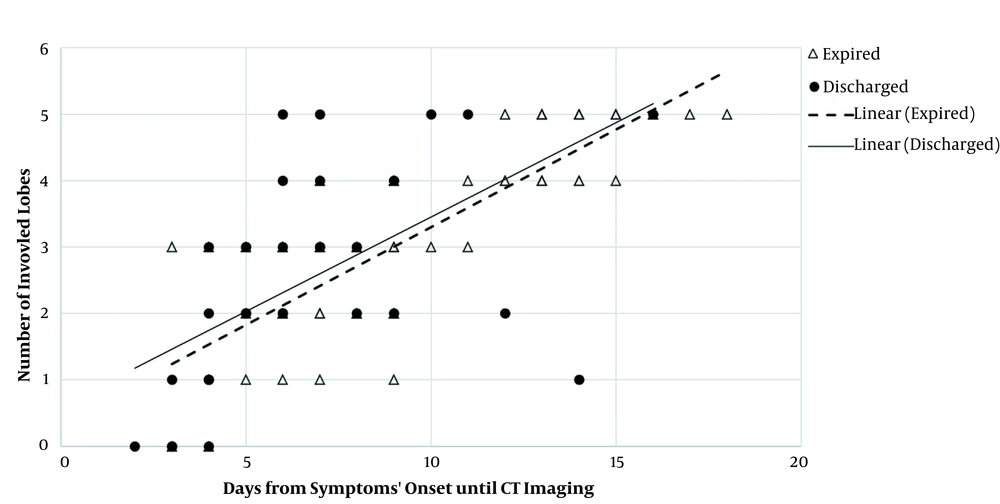
Relationship between lobar involvement and onset of symptoms in discharged and expired groups. The number of involved lobes increased in both groups as the interval between the onset of symptoms and CT imaging increased. The trend of increase was almost similar between the two main study groups; however, a certain number of involved lobes were detected slightly earlier in the discharged group compared to the expired group. Therefore, patients, whose lobar pathological findings are detected sooner by CT imaging, may have a lower risk of mortality.
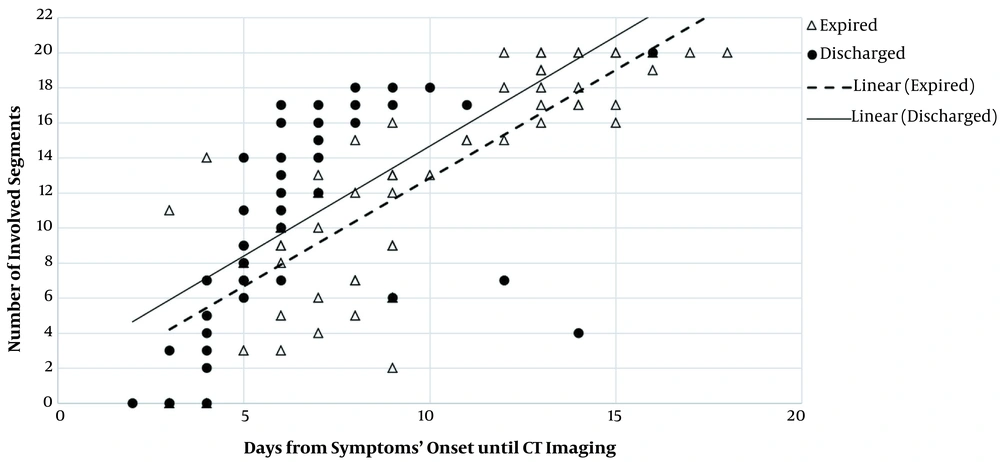
Relationship between segmental involvement and onset of symptoms in discharged and expired groups. The number of involved segments increased in both groups as the interval between the symptom onset and CT imaging increased; the trend of increase was almost similar between the two main study groups. However, a certain number of involved segments were detected considerably earlier in the discharged group, compared to the expired group. Therefore, patients, whose segmental pathological findings are detected sooner by CT imaging, may face a lower risk of mortality.




