
1. Background
Smog is the most extreme example of air pollution. It is a combination of smoke and fog trapped beneath a temperature inversion. Both fog and temperature inversions are weather phenomena. The term is typically used to describe the industrial or automotive-related air pollution prevalent in cities. Des Voeux reported more than 1,000 "smoke-fog" deaths in Glasgow and Edinburgh in 1909. Smog occurs in both summer and winter because of the accumulation of air pollutants under unfavorable weather conditions. Winter smog forms when fog mixes with pollutants such as particulate matter (PM), NOₓ, SOₓ, CO, and O₃ during temperature inversions that trap contaminants near the ground. Cities such as Lahore, Beijing, Delhi, Mexico City, Tehran, and Los Angeles commonly experience this type of smog. Photochemical (summer) smog forms on warm, sunny days when vehicle emissions react with sunlight, producing high levels of NOₓ and ozone (O₃). It is common in California, Beijing, and Delhi. (1)
Air pollution causes respiratory, cardiovascular, ocular, and allergic diseases, while smog also reduces visibility, increasing the risk of traffic accidents and disrupting daily life. Winter smog contains pollutants that increase airway inflammation, impair lung function, weaken immunity, and contribute to cardiopulmonary diseases. Early-life exposure can worsen asthma, and older adults experience higher mortality. Rapid urbanization and industrialization have made winter smog a major public health concern in South Asia, particularly in Pakistan and India. According to the State of Global Air (2020) report, Pakistan ranks among the countries with the highest PM₂.₅ concentrations and air pollution-related mortality rates. (2)
In Pakistan, rapid population growth, urbanization, industrialization, motorization, and increasing energy use have contributed to the severity of the smog crisis, particularly in Lahore. Inadequate air quality management has also contributed to poor air quality, which can have severe effects on human health. The main pollutants considered in air quality assessments are particulate matter (PM), SO₂, O₃, CO, NO₂, and Pb. (3) The Environmental Protection Department (EPD), National Institute of Health (NIH), Punjab Healthcare Department (PHD), World Health Organization (WHO), and UNICEF are conducting air quality monitoring and mitigation efforts and assessing the health impacts of air pollution. (4) Air pollution has become a major problem in Pakistan and is a leading cause of death each year. Urban air pollution is one of the most critical environmental issues in Pakistan. (5) High pollution levels are linked to industrial growth and the surge in the number of vehicles in major cities such as Lahore, Karachi, Peshawar, and Islamabad. The long-term effects of polluted air aggravate respiratory conditions, including cough, bronchitis, emphysema, and lung cancer, and put vulnerable people, such as those with asthma, chronic obstructive pulmonary disease (COPD), and heart disease, at higher risk. (5)
Air pollutants such as PM₂.₅, O₃, and NO₂ cause oxidative stress in the respiratory tract through the production of reactive oxygen species (ROS). (6) Air pollution can modify DNA methylation, an important epigenetic process that regulates gene expression. These epigenetic modifications can impair normal cellular function. (7) Traffic- and industry-related air pollution, particularly diesel exhaust particles (DEPs), increases the risk of allergic diseases, asthma, respiratory symptoms, and reduced lung function. Long-term exposure also promotes airway inflammation, immune dysfunction, coughing, headaches, fatigue, and progressive declines in respiratory health. (7) Studies suggest that indoor PM₂.₅ exposure is associated with reduced lung function and increased asthma severity in children, sometimes having a greater impact than outdoor pollution. The lungs are particularly vulnerable to PM, which can trigger oxidative stress, inflammation, and immune responses. (8) Studies in Amsterdam and Madrid showed that air pollution, particularly black smoke and PM₂.₅, is strongly linked to asthma severity, reduced lung function, respiratory symptoms, and increased mortality. (9) The health impacts of air pollution are observed to depend on exposure duration, health status, age, and socioeconomic factors. (10)
Smog originates from two main sources: area (stationary) sources and mobile sources. Area sources include wildfires, volcanic emissions, soil emissions, landfill gases, agricultural activities, and fugitive industrial emissions. Mobile sources of smog mainly include vehicle and combustion emissions. (1) Smoking, secondhand smoke, and smog are major sources of air pollution containing PM₂.₅, SO₂, NO₂, and CO, which can cause oxidative stress, DNA damage, and genetic changes. (11) Traffic-related air pollution contains small particles and harmful pollutants such as CO and benzene, which are linked to health problems. A study in Beijing, China, found that severe smog periods significantly increased emergency visits, outpatient visits, and hospital admissions. The observed health impacts may be underestimated because hospital visits decline after extreme smog events. (12)
IQAir, a Swiss air quality technology company, reported hazardous levels of air pollution in Lahore, Gujranwala, and Faisalabad, with high PM₂.₅ concentrations that surpassed safe limits. (13) A study in Lahore showed variation in pollutant levels across different locations. PM₂.₅ and PM₁₀ concentrations exceeded National Environmental Quality Standards (NEQS) limits in many areas, with the highest levels observed on Jail Road and near Wagah Border, due to traffic and commercial activities. (14) Punjab province, a region highly affected by smog, sought support from WHO to investigate the health impacts of air pollution and improve air quality monitoring.
2. Objectives
This study investigates smog as a major health risk in Lahore, Pakistan, focusing on its relationship with respiratory diseases. It aims to assess AQI or pollutant levels alongside hospital data to evaluate respiratory case counts associated with smog exposure and compare these counts with those during the non-smog period. The findings will help identify the relationship between exposure to air pollutants and respiratory diseases and improve health care preparedness.
3. Methods
3.1. Study Design, Setting, and Sampling
It was a retrospective hospital-record study with ecological monthly AQI and respiratory-case comparisons. This study took place in the Pakistani city of Lahore both within smog and non-smog periods. The duration of the study was 19 months(~1.5 years). From Nov-2022 to May-2024, AQI readings from Environmental Protection Agency(EPA), Punjab Air Quality Monitoring Reports(AQMR) and record for respiratory cases were taken in a Lahore hospital during smog and non-smog periods. Data were taken each month to track the AQI readings and the number of respiratory cases and cases per month. 578 readings from AQMR were included in the study among which 497 were valid whereas 81 were missing/invalid readings as at the time of data entry, these readings couldn’t be traced from the reports. 2663 samples of respiratory cases were taken from a well-established hospital in Lahore, the Fatima Memorial Hospital, Lahore. Month-wise data was collected on the number and types of respiratory cases. Purposive(judgemental) sampling technique was employed to identify participants relevant to the study objectives.
3.2. Smog Period
The smog period was defined as November to January. This period was selected based on previous literature on Lahore (15).
3.3. Case Definition
A respiratory disease case was defined as a respiratory condition corresponding to the International Classification of Diseases (ICD-10) codes for respiratory diseases, Chapter X: Diseases of the Respiratory System (J00-J99 blocks), that was documented in the hospital record during the study period.
3.4. ICD-10 Classification Categories for Respiratory Diseases
The major respiratory system diseases classified under ICD-10 and included in this study are as follows: acute upper respiratory infections (J00-J06), influenza and pneumonia (J09-J18), other acute lower respiratory infections (J20-J22), other diseases of the upper respiratory tract (J30-J39), chronic lower respiratory diseases (J40-J47), lung diseases due to external agents (J60-J70), other respiratory diseases principally affecting the interstitium (J80-J84), suppurative and necrotic conditions of the lower respiratory tract (J85-J86), other diseases of the pleura (J90-J94), intraoperative and postprocedural complications and disorders of the respiratory system, not elsewhere classified (J95-J95), and other diseases of the respiratory system (J96-J99).
3.5. Inclusion Criteria
• Cases presenting during either the smog or non-smog period from Nov-2022 to May-2024.
• Cases of all ages diagnosed with a respiratory disease classified under the ICD-10 category Diseases of the Respiratory System (J00-J99).
• Cases whose diagnosis and date of hospital presentation were documented in the hospital records during the study period.
3.6. Exclusion Criteria
• Records with an unclear or unverified respiratory diagnosis.
• Repeated entries for the same case.
3.7. Data Sources and Data Collection
Secondary sources were used for data collection. Air Quality Monitoring Reports (AQMR) data on AQI levels and hospital records were used to determine the number of respiratory disease cases and calculate cases per month. The authors had no access to identifiable individual participants; all data were fully de-identified by the institution/data provider. Air quality is categorized using the AQI scale, where 0 - 50 is considered Good, 51 - 100 Moderate, 101 - 150 Unhealthy for Sensitive Groups, 151 - 200 Unhealthy, 201 - 300 Very Unhealthy, and anything above 301 is deemed Hazardous. AQI levels were used for each month from Nov-2022 to May-2024. Each AQI reading was obtained from the AQMR reports from Nov 1, 2022 to May 31, 2024. PM2.5 was used for daily AQI because it was the most consistently available measure. Data consistency was prioritized when determining daily AQI values, with PM₂.₅ used as the primary pollutant. Mobile AQMS was the preferred data source, followed by Punjab University, Lahore (College of Earth and Environmental Sciences), and PCSIR when data from the preceding source were unavailable. Data were primarily collected within Lahore, as the entire city is affected by smog episodes and the stations were not far from the hospital. The number of respiratory disease cases and cases per month were recorded at the hospital from Nov-2022 to May-2024.
3.8. Ethical Considerations
Consent was obtained from the institution, and ethical approval was granted by the University of the Punjab Institutional Ethics Review Board (Reference No. D/160/FIMS). All relevant data are reported in the study. Further details can be provided upon request.
4. Results
4.1. Air Pollution Peaks
Air pollution peaked during the winter months of the smog period (Nov-Jan). Daily AQI levels from Nov-2022 to May-2024 are shown in Figure 1, with the highest peaks reported at 455 on 30-Dec-2022, 439 on 20-Nov-2022, and 427 on 7-Jan-2023. Monthly AQI readings, calculated as the average of the daily readings per month during smog and non-smog periods, are shown in Figure 2. These data confirm that air pollutant levels are highest during the winter smog periods in Lahore. Monthly AQI readings were useful for comparing the data with monthly respiratory case counts.
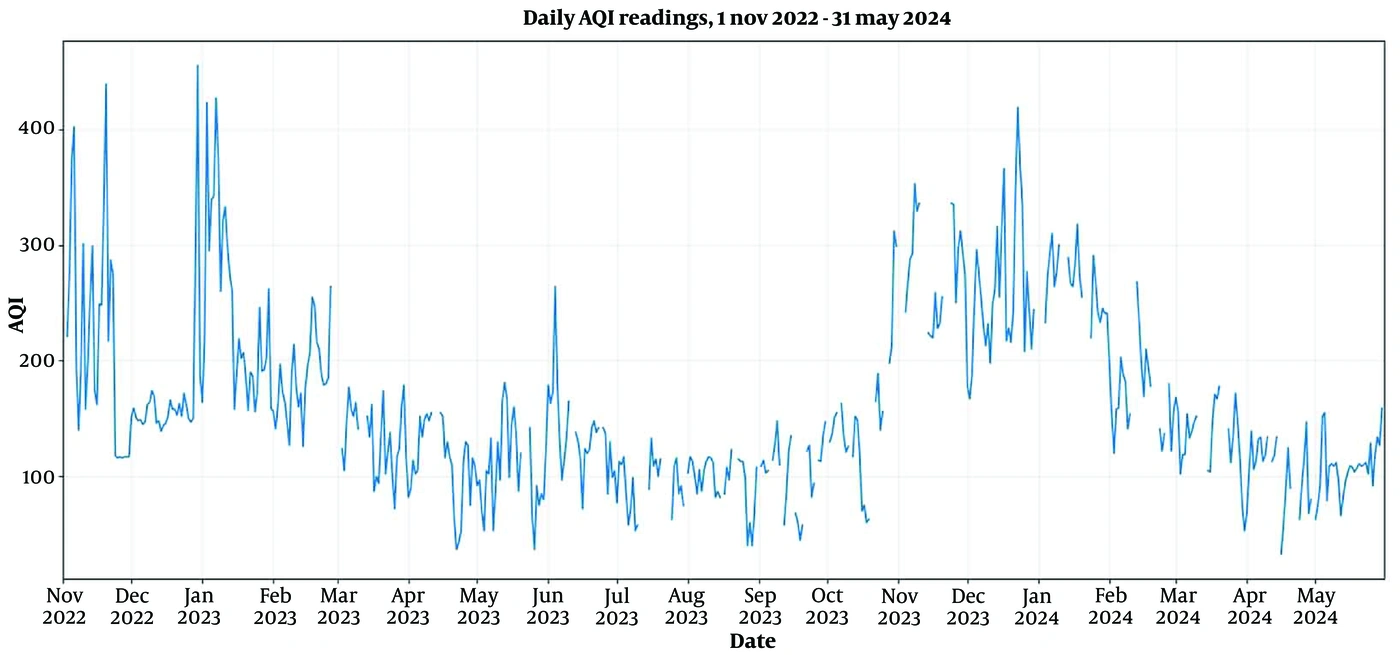
Figure 1.
Daily AQI Levels from Nov-2022 to May-2024
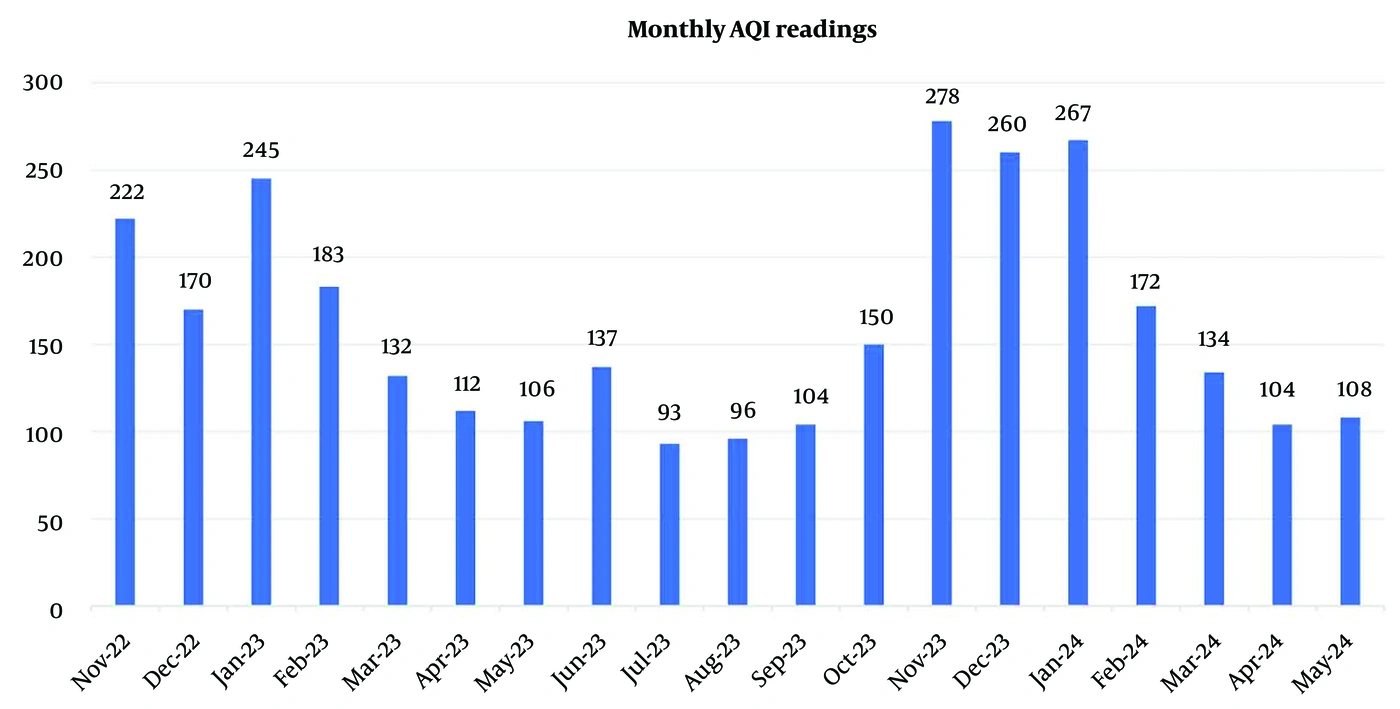
Figure 2.
Monthly AQI Levels from Nov-2022 to May-2024
4.2. Respiratory Cases
From Nov-2022 to May-2024, data on the number and types of respiratory cases were collected. Figure 3 outlines the total number of respiratory cases. Cases were highest during the Nov-2022 to Jan-2023 period, peaking at 331 cases in Jan-2023, and then declined through spring 2023. Numbers remained at lower levels through the summer and early fall of 2023 before rising again in November-2023, reaching 177 in December, after which they gradually decreased through spring 2024.
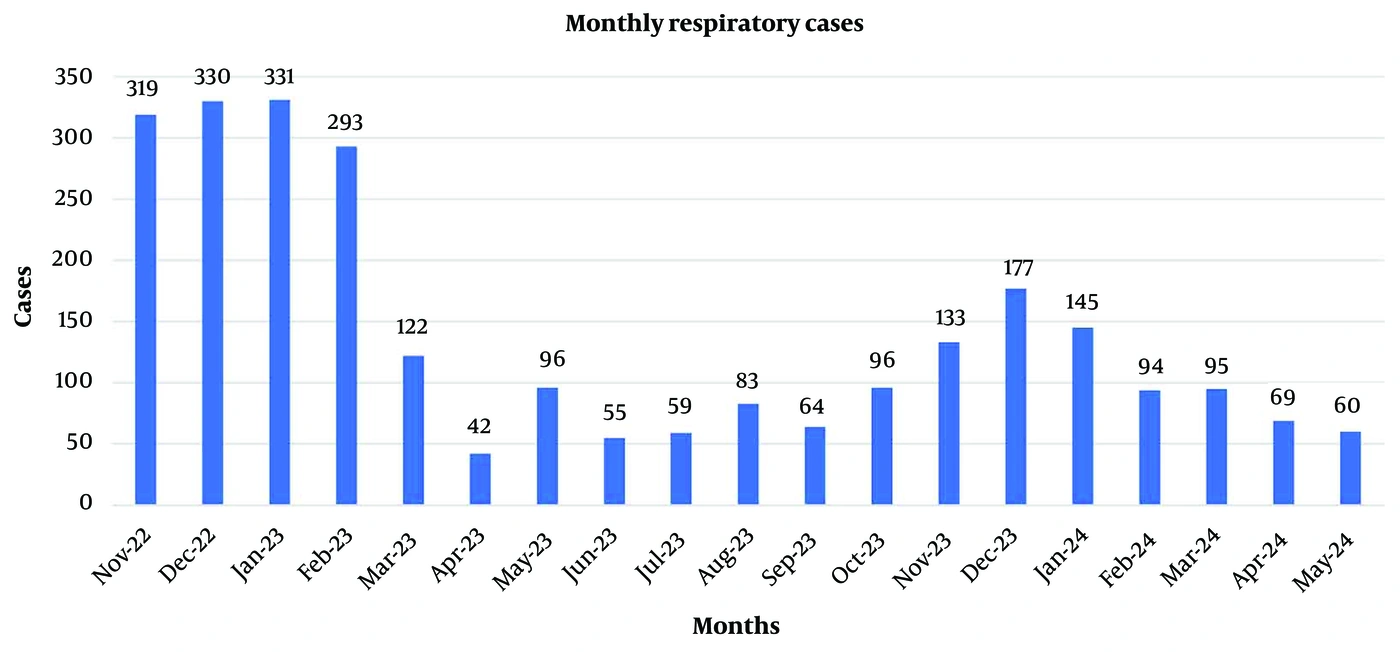
Figure 3.
Monthly count of respiratory cases from Nov-2022 to May-2024
4.3. ICD Classification
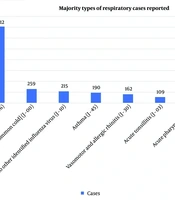
According to the ICD classification, most reported respiratory cases involved respiratory infections. Acute upper respiratory infections (J06) accounted for the highest proportion, with 1,412 cases (53.0%). These were followed by acute nasopharyngitis/common cold (J00), with 259 cases (9.7%), and influenza due to other identified influenza virus (J10), with 215 cases (8.1%). Other notable conditions included asthma (J45), with 190 cases (7.1%); vasomotor and allergic rhinitis (J30), with 162 cases (6.1%); acute tonsillitis (J03), with 109 cases (4.1%); and acute pharyngitis (J02), with 61 cases (2.3%). The remaining 255 cases (9.6%) fell under “other” respiratory-related conditions (Figure 4).
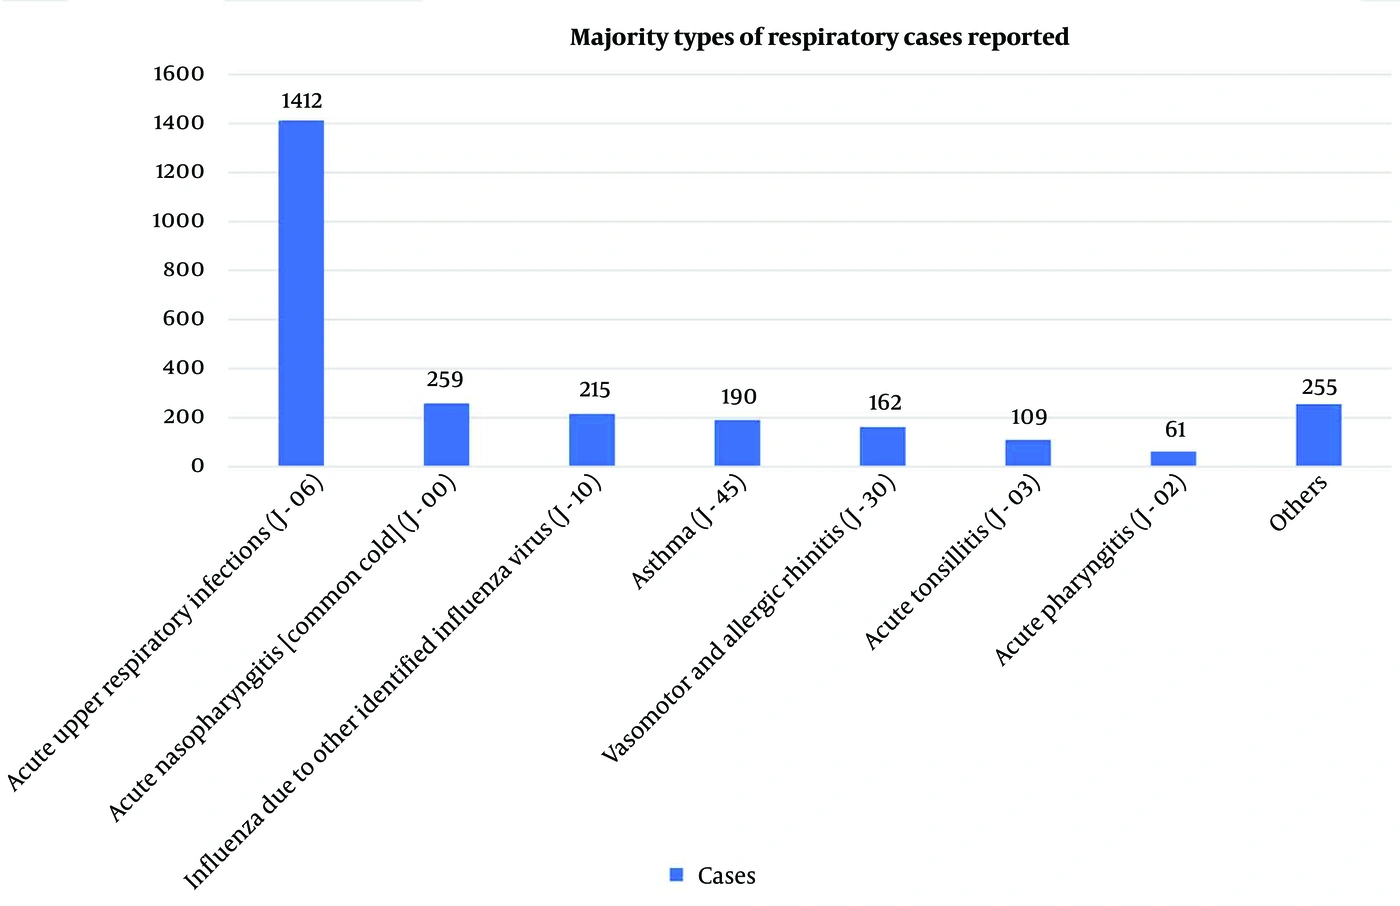
Figure 4.
Majority types of respiratory cases reported as per ICD-10 classification from Nov-2022 to May-2024
4.4. Smog and Non-Smog Period Comparison
Table 1 presents the descriptive data, whereas Figure 5 shows the time-series comparison of monthly AQI readings and respiratory cases from Nov-2022 to May-2024.
Table 1.
Descriptive Data on AQI Readings and Respiratory Cases a
| Statistical measure | AQI readings | Respiratory cases |
|---|---|---|
| Number of observations (mo) | 19 | 19 |
| Mean | 161.74 | 140.16 |
| Median | 137 | 96 |
| Minimum | 93 | 42 |
| Maximum | 278 | 331 |
| Range | 185 | 289 |
a Abbreviation: AQI, air quality index.
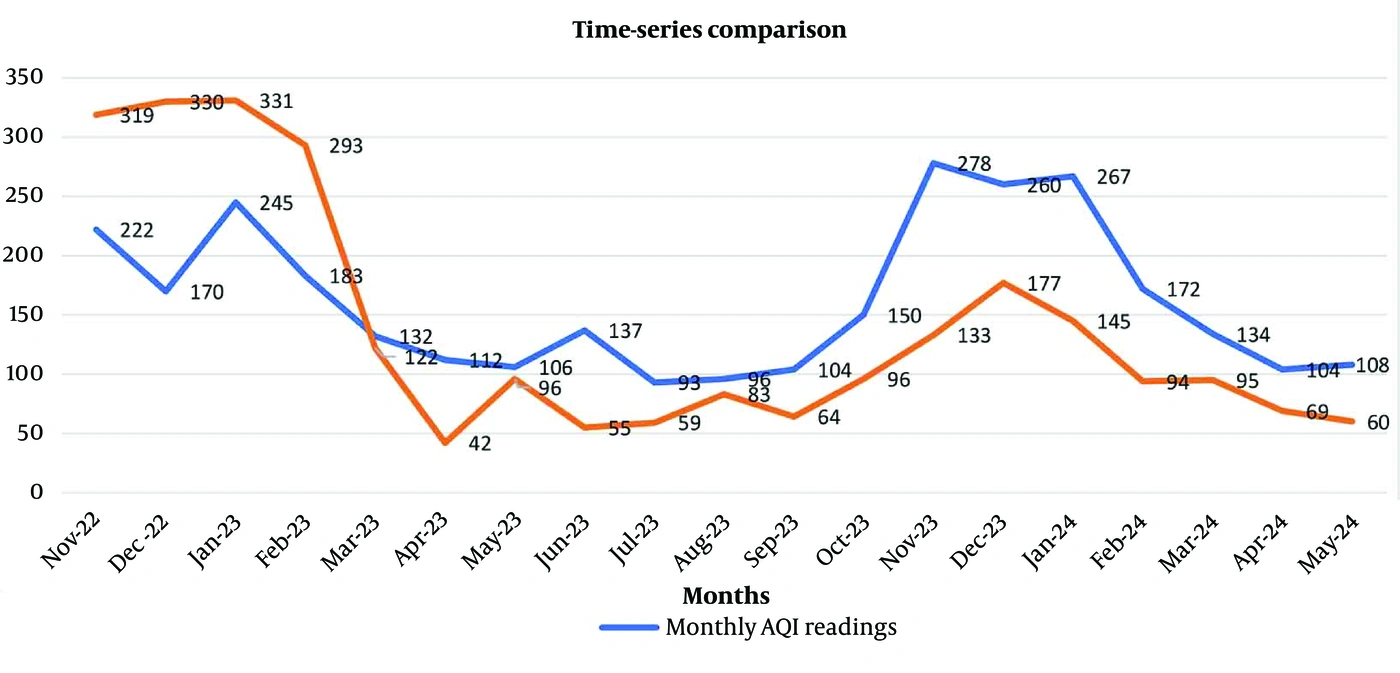
Figure 5.
Time-series comparison between monthly AQI readings and respiratory cases
The comparison of AQI and respiratory cases across smog and non-smog periods is shown in Table 2. Changes are calculated as percentages relative to the time span. A negative (−) value represents a percentage reduction, whereas a positive (+) value represents a percentage increase. The initial period is used as the baseline; therefore, no change is reflected. From Feb-2023 to Oct-2023, compared with the first smog period, average AQI diminished by 41.8%, while average respiratory cases diminished by 69.1%. From Nov-2023 to Jan-2024, average AQI elevated by 117.0%, and respiratory cases elevated by 50.0% compared with the previous non-smog period. From Feb-2024 to May-2024, average AQI diminished by 51.7%, and respiratory cases diminished by 47.6% compared with the second smog period.
Table 2.
Comparison of AQI and Respiratory Cases by Smog and Non-Smog Periods a
| Periods | Classifications | Average AQI | AQI change (%) | Average respiratory cases | Respiratory cases change (%) |
|---|---|---|---|---|---|
| Nov-2022 to Jan-2023 | Smog | 212.33 | - | 326.67 | - |
| Feb-2023 to Oct-2023 | Non-smog | 123.67 | -41.8 | 101.11 | -69.1 |
| Nov-2023 to Jan-2024 | Smog | 268.33 | +117.0 | 151.67 | +50.0 |
| Feb-2024 to May-2024 | Non-smog | 129.50 | -51.7 | 79.50 | -47.6 |
a Abbreviation: AQI, air quality index.
Table 3 shows that from Nov-2022 to May-2024, the average AQI during the non-smog period was 125.5 (categorized as Unhealthy for Sensitive Groups), whereas during the smog period, it increased considerably to 240.3 (categorized as Very Unhealthy). This indicates that air quality worsened during the smog periods, with the average AQI nearly doubling and moving toward the hazardous category.
Table 3.
Average AQI Levels During Non-Smog and Smog Periods from November 2022 to May 2024 a
| Non-Smog Period | Value | Smog Period | Value |
|---|---|---|---|
| Average AQI level | 125.5 | Average AQI level | 240.3 |
| AQI category | Unhealthy for Sensitive Groups | AQI category | Very Unhealthy |
a Abbreviation: AQI, air quality index.
Table 4 compares respiratory cases during the non-smog and smog periods. During the non-smog period, a total of 1,228 cases were reported over 13 months, averaging 94 cases per month. In contrast, 1,435 cases were reported over just 6 months during the smog period, resulting in a substantially higher average of 239 cases per month. These data indicate a more than 2-fold increase in the monthly rate of respiratory cases during the smog period, underscoring the adverse impact of smog on respiratory health. The highest numbers of respiratory cases by month were recorded in Jan-2023 (n = 331), Dec-2022 (n = 330), and Nov-2022 (n = 319), indicating higher case counts during the smog phase.
Table 4.
Respiratory Cases Reported Per Month During Non-Smog and Smog Periods from November 2022 to May 2024
| Non-Smog Period | Value | Smog Period | Value |
|---|---|---|---|
| Cases | 1228 | Cases | 1435 |
| Months | 13 | Months | 6 |
| Cases/month | 94/month | Cases/month | 239/month |
Table 5 presents a comparison of the most common respiratory cases during the smog and non-smog periods. During the non-smog period, acute upper respiratory infections (J06) were the most frequent, accounting for 655 (53.34%) of all respiratory cases. This condition also remained the most frequent during the smog period, accounting for 759 (52.89%) cases. Acute nasopharyngitis [common cold] (J00) was the second most frequently reported diagnosis during the non-smog period, with 109 (8.88%) cases; its count also rose during the smog period to 150 (10.45%) cases. Asthma (J45) was the third most frequently reported respiratory disease during the non-smog period, with 97 (7.90%) cases, whereas influenza due to other identified influenza viruses (J10) was the third most frequently reported diagnosis during the smog period, with 144 (10.03%) cases. Asthma (J45) was the fourth most frequent respiratory disease during the smog period, with 98 (6.83%) cases. Vasomotor and allergic rhinitis (J30) and acute tonsillitis (J03) were frequently reported in both periods. Pneumonia, unspecified organism (J18), was reported significantly during the smog period but not during the non-smog period.
Table 5.
Types of Respiratory Cases According to ICD-10 Classification During Non-Smog and Smog Periods, by Count
| Non-Smog | Number (%) | Smog | Number (%) |
|---|---|---|---|
| Acute upper respiratory infections (J06) | 655 (53.34) | Acute upper respiratory infections (J06) | 759 (52.89) |
| Acute nasopharyngitis [common cold] (J00) | 109 (8.88) | Acute nasopharyngitis [common cold] (J00) | 150 (10.45) |
| Asthma (J45) | 97 (7.90) | Influenza due to other identified influenza virus (J10) | 144 (10.03) |
| Vasomotor and allergic rhinitis (J30) | 95 (7.74) | Asthma (J45) | 98 (6.83) |
| Influenza due to other identified influenza virus (J10) | 71 (5.78) | Vasomotor and allergic rhinitis (J30) | 67 (4.67) |
| Acute tonsillitis (J03) | 51 (4.15) | Acute tonsillitis (J03) | 58 (4.04) |
| Acute pharyngitis (J02) | 34 (2.77) | Pneumonia, unspecified organism (J18) | 27 (1.88) |
| Other chronic obstructive pulmonary disease (J44) | 25 (2.04) | Acute pharyngitis (J02) | 27 (1.88) |
| Acute bronchiolitis (J21) | 13 (1.06) | Other chronic obstructive pulmonary disease (J44) | 24 (1.67) |
| Chronic sinusitis (J32) | 11 (0.9) | Acute sinusitis (J01) | 17 (1.18) |
| Others | 67 (5.46) | Others | 64 (4.46) |
4.5. Statistical Analysis and Exposure-Outcome Linkage
The statistical analysis included 19 observations each for AQI levels (the exposure variable) and the number of respiratory cases (the outcome variable). The findings demonstrated a high correlation (Pearson’s r = 0.60) between exposure and outcome. The observed correlation indicates that higher AQI levels, especially during the smog phase, were significantly associated (P = 0.007) with an increased number of respiratory cases during the study period, as shown in Table 6.
Table 6.
Comparison of Air Pollutant Exposure and Respiratory Case Counts
| Measure | Statistic | Value | Asymptotic Standard Error a | Approximate T b | Approximate Significance |
|---|---|---|---|---|---|
| Interval by Interval | Pearson's R | 0.60 | 0.114 | 3.058 | 0.007 c |
| N of Valid Cases | 19 |
a Not assuming the null hypothesis.
b Using the asymptotic standard error assuming the null hypothesis.
c Based on normal approximation.
5. Discussion
Most relevant research supports a connection between air pollution and respiratory diseases, particularly in relation to air pollutants and periodic changes in smog. A cohort study published in The Lancet Respiratory Medicine examined the effects of long-term exposure to PM2.5 and PM10. Specifically, the study investigated the effects of long-term exposure to PM2.5 on lung function and the development of COPD in more than 285,000 adults in Taiwan. The researchers found that higher levels of PM2.5 exposure were associated with a decline in lung function (as reflected by pulmonary function test variables) and an increased risk of developing COPD. Overall, the researchers concluded that reducing PM2.5 in the environment may help reduce respiratory diseases and related conditions. This is again suggestive of a relationship between high AQI (PM2.5) levels during the smog months, as observed in our study, and an increased number of individuals with respiratory diseases (16). In a study by Sofi et al., COPD (23.9%), followed by pneumonia (21.1%) and asthma (7%), were reported as the most common final diagnoses associated with PM and dust exposure (17). Ostro et al. conducted a study in 2010 among 45,000 women and found that chronic exposure to PM2.5 causes an increased mortality risk from cardiovascular and pulmonary diseases. These studies are also consistent with the current study, which showed higher rates of pulmonary diseases with rising PM2.5 (18). Croft et al. studied the effects of short-term increases in PM2.5 exposure on respiratory infections in 498,532 adults in New York State from 2005 to 2016. Their study reported a positive association between increasing PM2.5 and hospitalizations and emergency department visits for any type of pneumonia, as well as influenza. This is consistent with our results, in which influenza due to other identified influenza virus (J10) and pneumonia, unspecified organism (J18), caused more respiratory cases during the smog phase (19). Farahmandfard et al. examined the relationship between air pollutants (CO, O₃, SO₂, NO₂, PM₁₀, and PM₂.₅) and multiple sclerosis (MS) and observed that ambient O3 and NO2, and more consistently, CO and SO2, were associated with increased MS hospitalizations in Kerman (20). A study in Tehran highlighted the relationship between winter meteorological conditions and air pollutants (VOCs), consistent with our study, which showed an increase in air pollutants (PM2.5) during the winter months (21).
A study by Dana et al. recommended examining a wide range of pollutants to improve reliability and maintaining ventilation systems to enhance particle control (22). Similarly, Rabbani et al. concluded that effective ventilation and environmental controls help reduce airborne pathogen transmission and hospital-acquired infections (HAIs), while further research is needed to optimize ventilation strategies (23).
5.1. Recommendations
We recommend the following measures to curtail smog in Lahore. Short-term measures include issuing smog warnings or declaring emergencies, reducing vehicle emissions and market operating hours, promoting restrictions on outdoor activities and sprinkling roadsides. Long-term measures include using industrial scrubbers, immigration control, transitioning to clean energy (especially electric automobiles), urban planning, planting trees and conducting awareness campaigns.
5.2. Study Limitations
The major limitations of our study are as follows: several potential confounding factors could not be adequately assessed because of limited resources and the unavailability of individual-level data. These factors included smoking status, occupational exposure to pollutants, pre-existing respiratory conditions, and meteorological factors such as temperature and humidity. Additional diagnostic tools, such as those used to estimate oxidative stress or histamine levels during smog periods, could be beneficial. These assessments would enable us to investigate more closely the possible mechanisms underlying the effects of air pollutants and may reveal detailed physiological changes during smog exposure and possible inflammatory mechanisms triggered by smog. The lack of comparisons of these levels between smog and non-smog periods prevents a detailed understanding of the actual biological differences. Future research incorporating such assessments would help clarify the pathways through which smog exacerbates respiratory and allergic conditions.
5.3. Conclusions
Lahore, Pakistan’s most polluted city, experienced a significant increase in air pollutants, particularly PM2.5, and respiratory cases during winter smog periods. Our study provides a collective picture of the growing concern about winter smog and air pollution in relation to respiratory cases in Lahore, Pakistan. It highlights that elevated levels of air pollutants, particularly during smog periods, are connected to an elevated count of respiratory diseases. Our study helps establish that winter is the most critical period for preparing to combat smog in Pakistan. The seasonal spikes in respiratory cases reported during the winter months (Nov-Jan) highlight the growing need for better public health policies and strategies aimed at reducing air pollution during this period.