1. Background
Nitrate and its intermediates are considered undesirable compounds in water and wastewater. The nitrate contamination is an environmental problem in many sources of water (1, 2). The ecological effects and toxicology of the nitrate compounds have been reported in different studies (3, 4). Major sources of nitrate can be used for agricultural fertilizers and wastewater discharges (5, 6). The most adverse effects of nitrate can be mentioned as: eutrophication, methemoglobin, toxicity to aquatics and potential health hazards to infants and pregnant women (2, 5).
Hence, nitrate removal from water and wastewater is considered as an environmental health concern. According to the World Health Organization (WHO) recommendations, the maximum allowable concentration of nitrate in drinking water is 50 mg/L (7). Various methods for nitrate elimination were reported such as ion exchange, biological treatment, reverse osmosis, chemical reduction, and electrochemical processes (7-9). These conventional technologies have some disadvantages such as generating a large amount of intermediates, which require further treatment, continuous monitoring, and slow kinetics rate (8-11).
Electrochemical method is preferred, because of the advantages such as 1) environmentally-friendly technology, 2) high effectiveness process, 3) no addition of chemical requirements, 4) small occupied area, 5) generating small volume of sludge, 6) simplicity of the operation and maintenance, and 7) relatively low investment cost (12, 13). Electrocoagulation is an efficient, credible and low-cost method for treating a large variety of wastewater bodies such as industrial wastewater, municipal wastewater, chemical oxygen demand (COD ) removal, dyes, oil-water emulsions, and heavy metal-containing solutions (14, 15). Nitrate removal was reported using different electrodes (16, 17).
2. Objectives
During this study, we investigated the following subjects:
1) Evaluation of electrochemical potential for elimination of nitrate and its intermediates using aluminum-graphite electrodes,
2) Evaluation of combining affinity of electrocoagulation and air stripping,
3) Statistical analysis of experimental data using response surface methodology.
To the best of our knowledge and based on the literature review, optimization of electrocoagulation-reduction treatment of nitrate from wastewater using the response surface method has not been reported yet.
3. Materials and Methods
3.1. Materials
The materials, including KNO3, NaCl, KCl, Na2CO3, HCl, H2SO4, HgI2, KI, NaOH, NH4OH, (NH4)2 SO4, and NH4NO3 were purchased from Merck company in analytical grade. Stock solutions of nitrate were prepared by adding the specific values of potassium nitrate (KNO3) in deionized water. The pH was adjusted to the desired value with 1 M HCl and 1 M NaOH. The NaCl, KCl and Na2CO3 solutions were prepared as the supporting electrolytes.
3.2. Reactor Set-Up
In this study, electrocoagulation process was combined with the air stripping system (Figure 1). The process consists of the electrochemical reactor (1 L), DC power supply (TEK-8051, 30 V and 5 A), peristaltic pump (Watson Marlow 101 U/R), and graphite and aluminum electrodes. The air stripping periods are considered 5, and 15 minutes between the two cycles. These periods were selected, to eliminate ammonia and other intermediates produced around the cathode during the process.
The process used four electrodes with the arrangement of graphite/Al/graphite/Al. The dimensions of the graphite and aluminum electrodes were 150 × 60 × 5 mm and 150 × 60 × 2 mm, respectively. The distance between anode and cathode electrodes was fixed to 1 cm. Before the starting-up of the process, the anode electrodes were cleaned with 1 M H2SO4 and rinsed with deionized water to eliminate impurities from the surface of the electrodes.
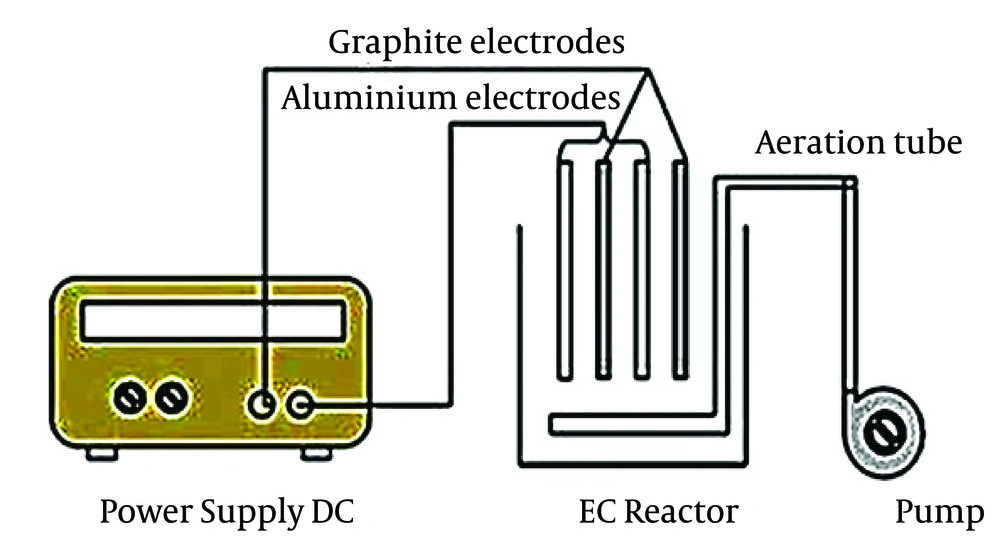
Figure 1.
Schematic Diagram of Electrochemical Reactor
3.3. Analysis
All experiments were performed according to standard methods for the examination of water and wastewater. The samples were collected from the reactor and filtered to remove solid material. The nitrate and ammonium contents were measured by UV-spectrophotometer with an absorption maximum at λ = 220 and λ = 640 nm, respectively (Rayleigh UV 9200, China) (18). The pH and ORP were measured with a pH meter (Eutech) and an ORP probe.
3.4. Response Surface Methodology
Response Surface Methodology (RSM) includes the mathematical and statistical methods for modeling and determining the model equations. Also, this method is commonly used for improving and optimizing processes (19). We find a suitable function between the responses and a set of independent variables. This approximate function must be a polynomial of independent variables. Central composite design (CCD) was used to fit this model as the most famous design. In CCD, low axial, high axial, factorial and a central point are coded as -2, +2, -1, +1, and 0, respectively.
3.5. Evaluation of Variables
For modeling and optimization, two important factors were considered: initial concentration of nitrite, and applied electric current. Based on CCD, low axial, high axial, factorial and a central point were chosen as follows:
Initial concentrations of nitrite were ≥ 50, ≥ 72, ≥ 125, ≥ 178, and ≥ 200 mg/L;
Applied electric currents were ≥ 0.05, ≥ 0.072, ≥ 0.125, ≥ 0.178, and ≥ 0.2 A;
To determine the optimum conditions, supporting electrolyte (NaCl = 1 g/L), anode/cathode: Al/graphite and detention period of 120 minutes were considered.
In the next step, based on optimum factors in RSM, effect of different supporting electrolytes (NaCl, KCl and Na2CO3), nitrate intermediates, and oxidation reduction potential were optimized.
4. Results
Table 1 shows CCD and responses of each experiment. In this study, the electric current and nitrate concentration were optimized by RSM and designed thirteen runs for developing the model and coded removal equation. Figure 2 displays the contour and 3D response surface plots for the variables. The removal trend indicated the effects of two significant variables on cathodic reduction of nitrate. The statistical values as the R-squared, adjusted R-squared and C.V% that derived from experimental data are shown in Table 2. The R-squared, adjusted R-squared, the mean and C.V% were 0.998132, 0.996798, 72.92% and 1.449454, respectively. As seen in Table 3, the prediction value is observed for models with 95% confidence interval (CI) and prediction interval (PI). Figure 3 displays the effect of different supporting electrolytes such as NaCl, KCl, and Na2CO3 on nitrate removal efficiency. Ammonia is the main intermediate of the nitrate in an electrochemical process, and its variations are illustrated in Figure 4. Finally, the variation of the oxidation reduction potential (during the electrocoagulation process at the optimum state) was investigated which its results can be seen in Figure 5.
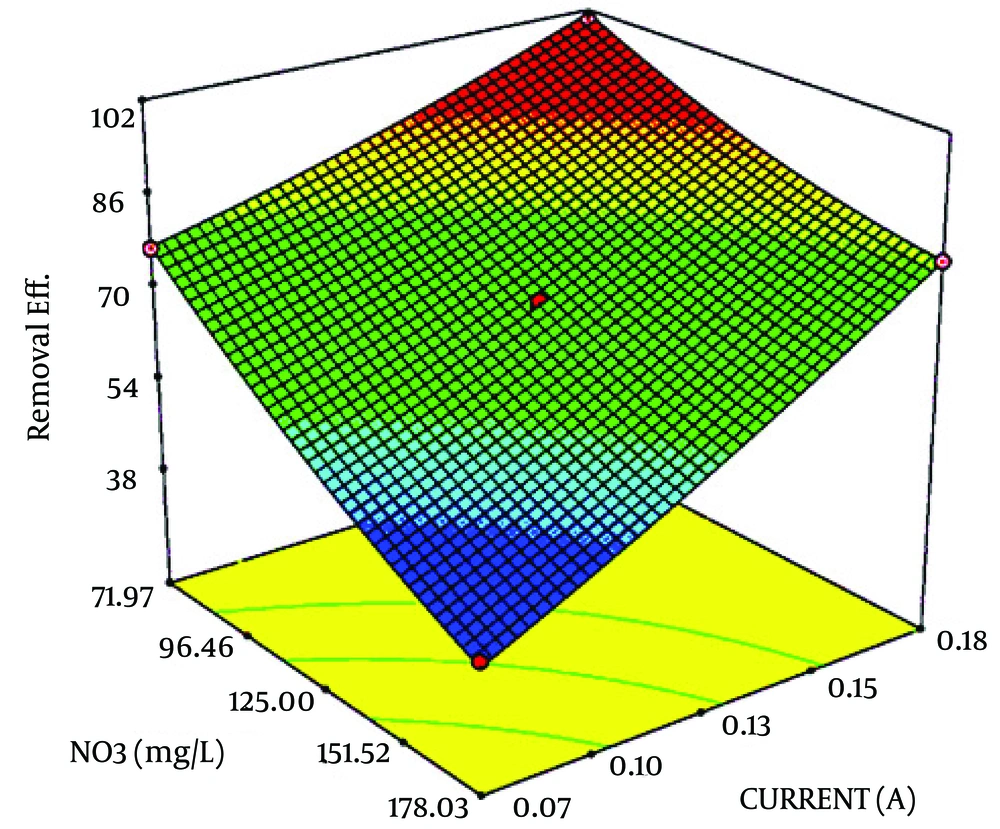
Figure 2.
Conditions: NaCl = 1 g/L, nitrate concentration range = 50-200 mg/L, applied current range = 0.05-0.2 A, anode = Al and cathode = graphite, detention time =120 minutes.
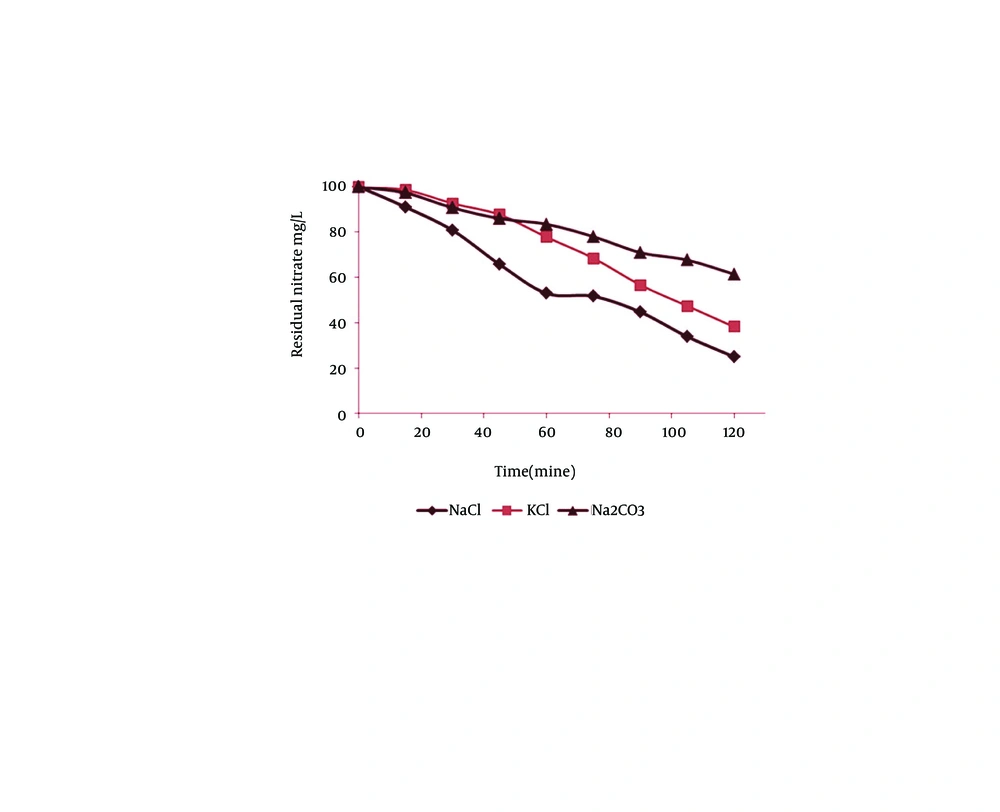
Figure 3.
NaCl, KCl, and Na2CO3 = 1 g/L, nitrate concentration = 100 mg/L, applied current = 0.10 A, anode = aluminum and cathode = graphite.
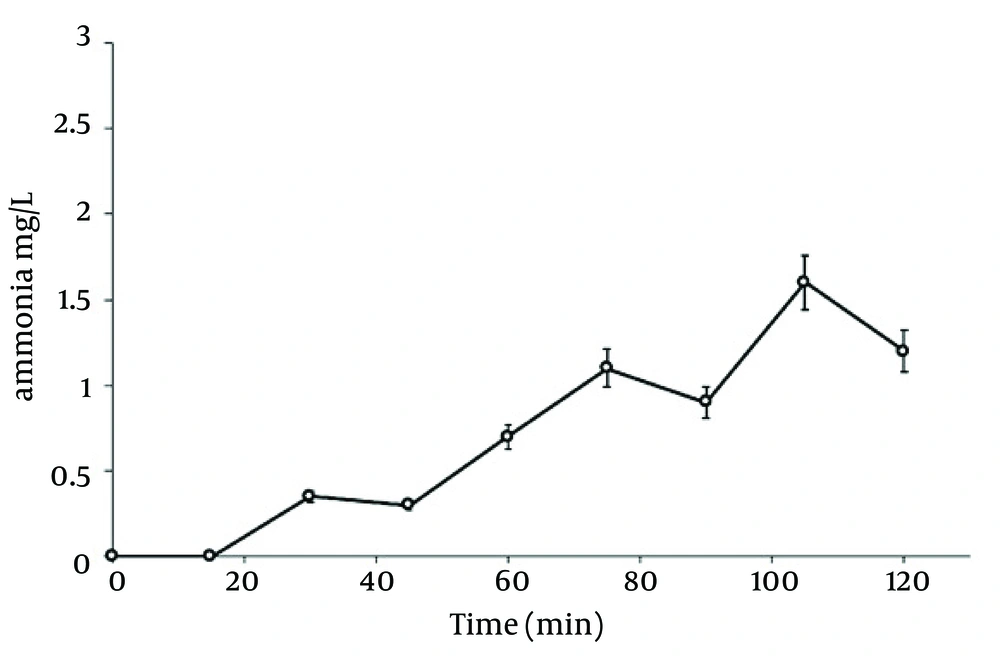
Figure 4.
Condition: NaCl = 1 g/L, nitrate concentration range = 176 mg/L, applied current range = 0.14 A, anode = Al and cathode = graphite, detention time =120 minutes.
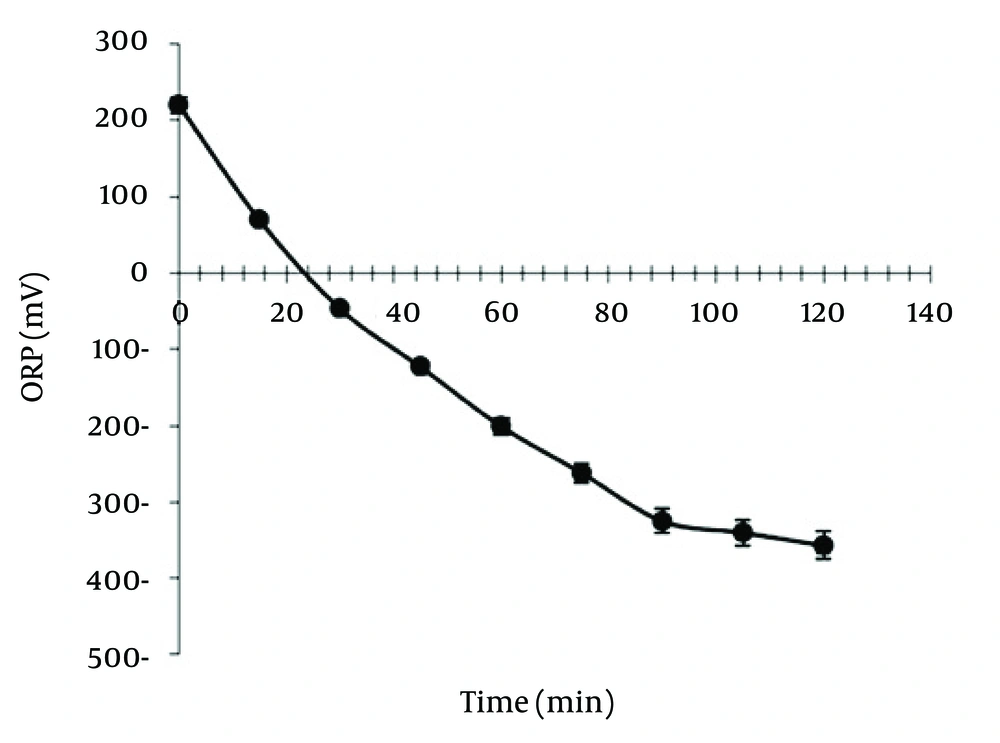
Figure 5.
Condition: NaCl = 1 g/L, nitrate concentration range = 176 mg/L, applied current = 0.14 A, anode = Al and cathode = graphite, detention time = 120 minutes.
5. Discussion
5.1. Statistical Analysis
The percentage of reduced nitrate, P Value and the variance analysis of the obtained data showed a significant value (Table 1). The P Value, lack of fit and F value of the model were achieved < 0.0001, 0.0729, and < 748.1962, respectively. Regarding the statistical values for nitrate reduced model, it displayed a high significant conformity (Table 2). Difference between R2 (0.998) and adjusted R2 (0.996) should be lower than 0.2. In addition, the coefficient of the variation percentage (CV% ~ 1.5) is the value of the reproducibility of the model and should be lower than 10% (20). Accordingly, the CV% indicates the reliability and high precision of the experimental data. Adequate precision (about ~ 88.26) is the ratio of signal, and the figure should be greater than 4 in order to be desirable. The model removal was calculated from the coded factors equation (Equations 1).
Final equation in terms of coded Factors:
According to the Figure 2, the higher removal efficiency occurred in lower initial concentration and high applied current. Also, lower removal rates can be seen in higher concentrations. Nitrate reduction rate shows a direct relation to the applied current and has reverse relationship by initial concentration. So, the 99% removal rate is observed in high current and low concentration. Bazrafshan et al. reported that the most effective removal capacities of nitrate (96%) could be achieved at 40 Volt, pH 10, and reaction time 60 minutes for initial concentration of 5 mg/L nitrate (20). The results of Lacasa et al. indicated that electrocoagulation is an effective technology for nitrate removal because nitrate anions preferentially are adsorbed onto the surfaces of growing metal-hydroxide precipitates (21).
Table 1.
The Central Composite Design and its Responses in Experimental and Coded Equation ConditionCondition
| Run | x1 | x2 | Experimental Removal | Model Removal |
|---|---|---|---|---|
| 1 | 0 | 0 | 71.2 | 70.4 |
| 2 | 0 | 1 | 98 | 88.62 |
| 3 | 0 | 1 | 100 | 88.62 |
| 4 | 0 | 0 | 69.6 | 70.4 |
| 5 | 0 | -1 | 49 | 55.04 |
| 6 | 2 | 1 | 81 | 79.04 |
| 7 | 0 | -1 | 54 | 55.04 |
| 8 | 0 | 0 | 70 | 70.4 |
| 9 | 0 | 0 | 70.8 | 70.4 |
| 10 | -1 | -1 | 70.4 | 77.37 |
| 11 | -1 | -1 | 77 | 77.37 |
| 12 | 1 | 0 | 58 | 58.18 |
| 13 | 0 | -2 | 39 | 42.54 |
Table 2.
ANOVA and Statistical analysis for Response Surface Model
| Source | Sum of Squares | Mean Square | F Value | P Value Prob > F |
|---|---|---|---|---|
| Model | 4179.503 | 835.9005 | 748.1962 | < 0.0001 |
| x1-NO3 | 1776.837 | 1776.837 | 1590.408 | < 0.0001 |
| x2-Current | 2254.443 | 2254.443 | 2017.902 | < 0.0001 |
| x1x2 | 90.25 | 90.25 | 80.78079 | < 0.0001 |
| x12 | 49.77826 | 49.77826 | 44.55543 | 0.0003 |
| x22 | 14.12609 | 14.12609 | 12.64395 | 0.0093 |
| Residual | 7.820547 | 1.117221 | - | - |
| Lack of Fit | 6.220547 | 2.073516 | 5.183789 | 0.0729 |
| Pure Error | 1.6 | 0.4 | - | - |
| Cor Total | 4187.323 | - | - | - |
| Result, Mean ± SD | 72.92308 ± 1.056987 | - | - | - |
| C.V., % | 1.449454 | - | - | - |
| Press | 46.735 | - | - | - |
| R2 | 0.998132 | - | - | - |
| Adjusted R2 | 0.996798 | - | - | - |
| Pred R2 | 0.988839 | - | - | - |
| Adequate precision | 88.26366 | - | - | - |
Table 3.
Prediction and Experimental Values with 95% Confidence Interval (CI) and Prediction Interval (PI)
| Prediction | 95% CI Low | 95% CI High | 95% PI Low | 95% PI High |
|---|---|---|---|---|
| 82.8064 | 81.52 | 84.09 | 80 | 85.62 |
5.2. Optimum Condition
The optimum condition for nitrate removal using electroreduction-flotation process was achieved using 176 mg/L nitrate and 0.14 A electric current. The nitrate removal efficiency was gained 82.8% in the optimum conditions with regard to 95% confidence interval and prediction interval (Table 3). The experimental results obtained from optimum conditions revealed the precision of the resulting data and models.
5.3. Effect of Supporting Electrolyte
The use of supporting electrolyte can decrease interior resistance of electrolyte, lower energy consumption, and increase applied frequency in an electrochemical experiment. Although the nitrate ions can serve as a supporting electrolyte in the transfer of electrons during the electrochemical process, but addition of certain salts such as NaCl, KCl and Na2CO3 can reduce the internal resistance of the electrolyte (22). According to Figure 3, nitrate reduction due to NaCl, is better than KCl and Na2CO3. Higher elimination of nitrate in the presence of NaCl may be due to higher ionization of this compound. The nitrate reduction of NaCl and KCl can occurre because of chlorine reaction on the anode electrode as follows (Equations 2 and 3):
5.4. Removal of Ammonia as an Intermediate
The main intermediates of nitrate in an electrochemical process are nitrite, NH2OH, and ammonia (Equations 4-9).
The nitrogen gas is the final environmental friendly product (23, 24). Generally, ammonia is produced during the electrochemical removal process of nitrate. It can be removed by air stripping. Figure 4 shows the various ammonia compounds during the process. The variation of the produced ammonia is due to the intermittent aeration that occurred after air is turned off. The dissolution of anode (aluminum) and produced monomeric, polymeric and amorphous species, such as Al(OH)3, Al(OH)2+, Al(OH)22+, Al2(OH)24+, Al(OH)4-, Al6(OH)153+, Al7(OH)174+, Al8(OH)204+, Al13O4(OH)247+, and Al13(OH)345+ is the main reason for the pH increase of the process (25, 26). Because of the dissolution of anode, Al3+ ions are released. The amount of aluminum released into the solution from the anode can be calculated by Faraday’s law (Equation 10).
Where WA is the amount of dissolved anode (g); I is the current intensity (A); t is the run time (s); m is the specific molecular weight (g/mol); F is Faraday’s constant (96485 A-s/mol); and n is the number of electrons involved. The overall weight loss of anode ratio during the electrochemical process to theoretical state obtained about 1.3: 1. Near the surface of cathode, the water is hydrolyzed to H2 and OH (Equations 11 and 12). The aluminumhydroxide (Equation 13) is the final product of the reaction (27).
Increasing the pH by the production of hydroxylated species can facilitate the release of ammonia to the atmosphere. Szpyrkowicz et al. (24) reported that the electroreduction of nitrate can be influenced by pH and cathodic potential. The cathodic potential depends more on anode/cathode material, than the electrolyte conditions and electric potential.
5.5. Effect of Oxidation Reduction Potential
The Oxidation Reduction Potential (ORP) is a main factor in the electrochemistry process. It is very important in the formation of intermediates of nitrogen such as NO3, NO2, and NH3. The nitrate reduction needs a reduction condition with a negative ORP. In the experiments, the ORPs were changed from +220 to -375 mV (Figure 5). With regard to the ORP, the produced nitrogen species mainly consists of the ammonia and nitrogen gases. Based on the relationship between the ORP and the concentrations of reduced and oxidized species involved in denitrification processes can be ensured that the denitrification is performed. The ORP has been widely used as a control parameter for online monitoring and control of nitrification and denitrification since 1980s (28). The operating ORP for nitrification and denitrification have been reported between -100 and +100 mV (28). Also, Ra et al. believed that the complete depletion of nitrate is occurred around -300 to -400 mV (29).
The results of this study shows that it is possible to remove the nitrate and its intermediates from wastewater, using an electrocoagulation process. According to the obtained results, it can be found that the aluminum/graphite electrodes show nitrate removal with high performance. In this process, many operational factors such as pH, supporting electrolyte, applied current, and initial nitrate concentration were found. RSM was used as an effective method and optimized the applied current and initial concentration of nitrate values at 176 mg/L and 0.14 A, respectively. Furthermore, the RSM has been applied to develop the polynomial regression equations and evaluation the relation between the nitrate reduction and the experimental factors . Finally, with regard to the results, 90% removal efficiency was obtained based on the optimized state, and this amount can be used reliably for field scales. Moreover, this process is able to reduce the nitrate according to WHO guidelines or USEPA MCL. Due to the desirable efficiency of electrocoagulation process the field scale assessment is recommended.