1. Background
Musculoskeletal disorders (MSDs) are one of the main causes of occupational injury and disability in industries of developed and developing countries that impose high costs on the economies of these countries’ industries (1-4). According to the results of a survey conducted by the world health organization (WHO) in 2013, musculoskeletal disorders (MSDs) are ranked second after respiratory diseases (5). Unlike many occupational diseases, which result from exposure to several specific risk factors, musculoskeletal disorders (MSDs) are considered as a multi-factorial injury, which is created and developed depending on risk factors, such as repetitive actions, high force exertions, awkward working postures, contact stress or pressures, vibration, and physical fatigue (6, 7). Occupational exposure to these risk factors at occupational workplaces could cause various diseases, such as Tenosynovitis, Lower Back Pain (LBP) and Carpal tunnel syndrome (CTS), in which the neck, shoulders, back and upper extremities are affected (8). Cumulative trauma disorders (CTD) are chronic work-related musculoskeletal disorders (WMSDs), which mostly influence the upper limb extremities (ULEs). Over the past decades, the prevalence of ULEs or distal upper extremities musculoskeletal disorders (DUEMSDs) has increased significantly in most industrial societies (9-12). For example, DUEMSDs comprised 13% of the total working lost days per year in the United States. Based on available statistics until 2000, CTDs are considered about 48% of total work-related diseases (13).
In many countries, small-scale industries are the main providers of new employment. In addition, these industries play an outstanding role in the economic development of countries by producing export products. In developing industrialized countries, such as Iran, development and expansion of small industries, especially in the informal sector, and improving working conditions are necessary (14, 15). The carpet weaving industry is one of the most common home-income jobs in countries such as Iran, China, Turkey, India, and Pakistan. This industry is also associated with high risk of occupational musculoskeletal disorders, respiratory diseases, injuries, eye problems, nervous disorders, and skin problems (16-18). The Iranian carpet weaving industry is considered as an informal indicator of home industries, which are one of the major industries and the largest sector of small industries, and have a special place in Iran's economy and play a great role in job creation and productivity (19).
According to available statistics, there are 1,200,000 carpet weaving workshops in 210 cities and 27,000 villages, in which about 2,200,000 people are employed full time or part time and 8.5 million people are living indirectly through the production of handmade carpets; 80% of weavers are females and young girls, which have low levels of income. Low wages, long working hours, inadequate lighting, improper conditions, safety and ergonomic working environment and conditions are some of the problems of weavers (18-20).
Based on conducted surveys among different occupations, carpet weaving is a high risk job, and workers are exposed to musculoskeletal disorders (17, 21). In a study conducted on the carpet weaving industry, the prevalence of musculoskeletal disorders in the studied population was more than the general population of the country (16). In another study conducted by Motamedzade et al. the risk factors of carpet weaving jobs was determined and jobs involving improper ergonomic conditions and static work were identified as high-risk occupations (22). Regarding hands and wrists, it should be mentioned that due to the type of knots in the weave actions with struck and inappropriate design tools, improper postures are seen, such as bending and stretching of the wrist when using a hook and cut knots, and ulna and radial deviation during dense knots and weft (19).
Unfortunately, despite the importance and vital role of carpet weaving industries and factors that influence most small industries, especially in developing countries, this industry is usually forgotten and does not receive enough attention. Since there are no studies that have examined the risk factors associated with upper extremity tasks and sub-tasks in carpet weaving jobs, the current study aimed at assessing the risk factors that cause musculoskeletal upper extremity problems and determining the risk levels of different job tasks and sub-tasks. Furthermore, this study investigated the prevalence of musculoskeletal disorders in Qom city carpet weaving workshops.
2. Methods
This cross-sectional descriptive-analytical study was conducted on 143 carpet weaving workers at a carpet weaving industry located in Qom city, south of the Tehran Province. Before the study, all participants completed an ethical consent form to participate in the study and provided consent to participate in this study. The randomized sample with a confidence level of 95% and a power effect size test of 8% by an absolute error of 25% was determined as 143 individuals.
Inclusion criteria for the study were at least 1 year experience in carpet weaving, working hours longer than 4 hours per day, and lack of history of non-work related upper limb musculoskeletal injuries (such as injuries caused by accidents, birth defects, fractures, disability, etc.). Exclusion criteria included trauma to the musculoskeletal system during the study time. At first, a hierarchical job analysis (HJA) was used to determine the tasks and sub-tasks involved in different jobs of carpet weaving industries (23). The HTA results showed 3 separate parts in carpet weaving operations, including the tree task of weave, the weft laying thick and combing, and the weft laying thin and combing. Workers employed in these jobs typically worked from 8 to 12 hours per day. Within one working day, regarding the allocated time for the weave task, the weft laying thick and comb making task, and the weft laying thin, and combing operations took 78%, 12%, and 9% of the total work time, respectively. Each of the above tasks included sub- tasks; all of the tasks with their encoding are presented in Figure 1.
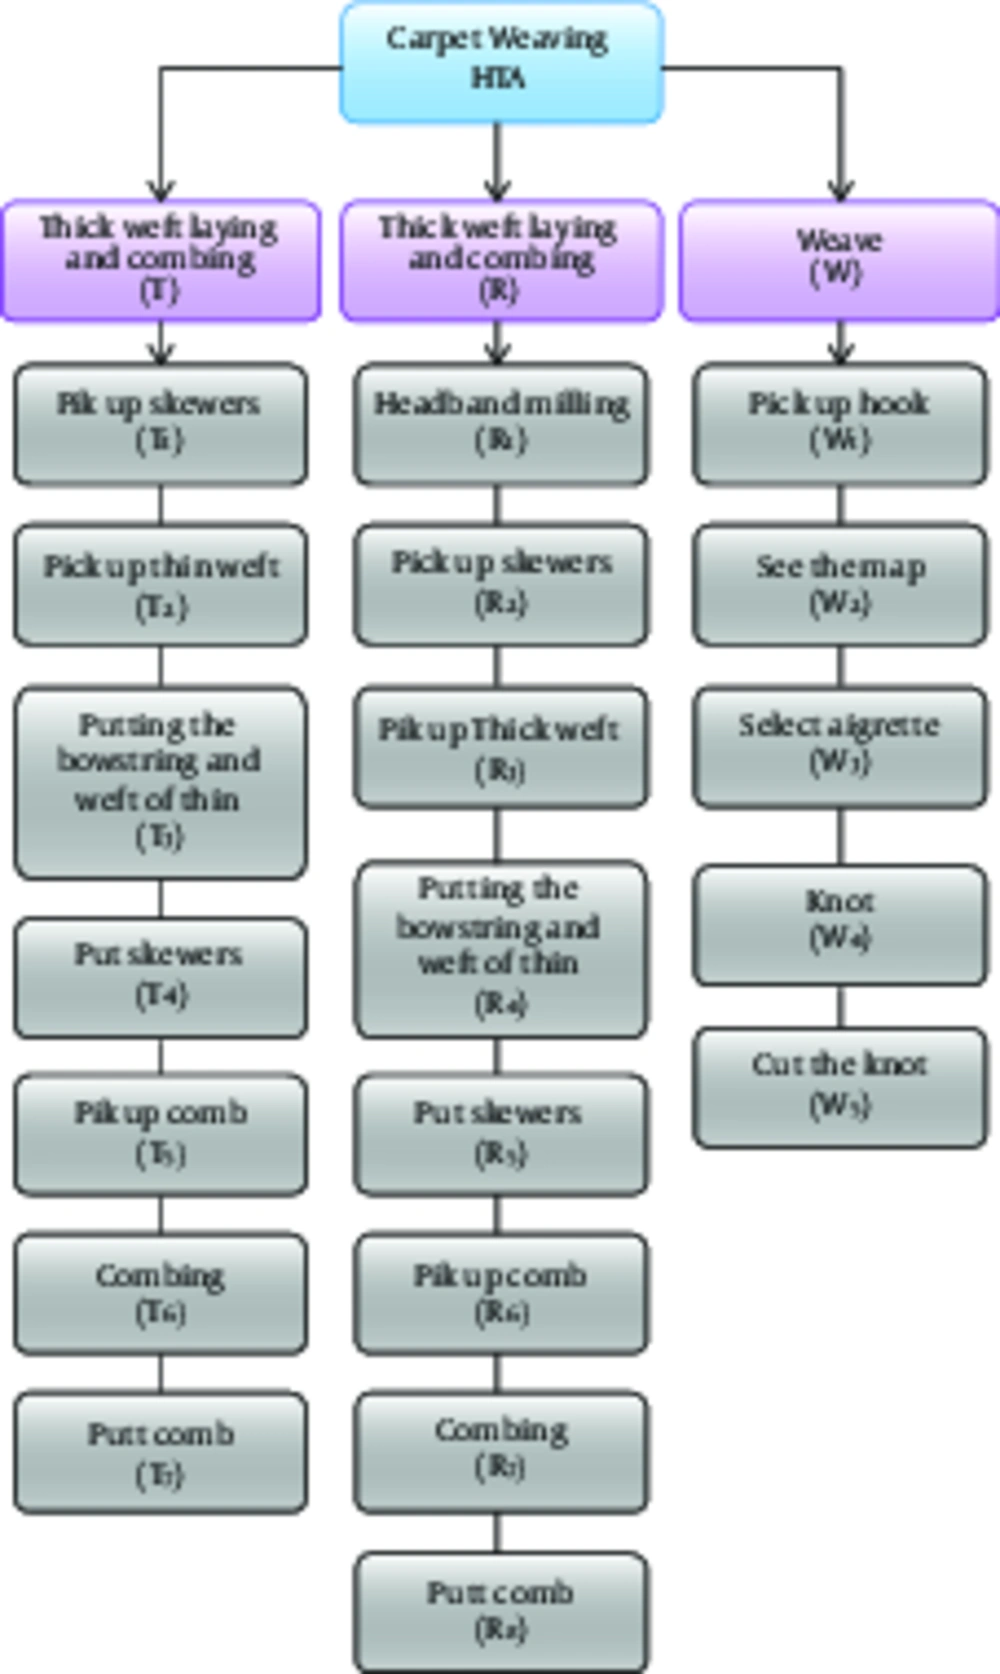
Figure 1.
The Task and Sub-Tasks Assigned by the Hierarchical Job Analysis Method in the Carpet Weaving Job and Their Encoding
For determining the prevalence of musculoskeletal disorders, nordic musculoskeletal questionnaire (NMQ) was used. This questionnaire has 2 parts, general and specific, and with regards to the purposes of the current study, only the general part was examined (24). To achieve better results, questionnaires were completed through direct interviews with the subjects, and prevalence of musculoskeletal disorders was recorded during the past year.
In order to assess the risk factors that cause musculoskeletal disorders in the upper extremity, the job strain index (JSI) was used. The job strain index (JSI) is a pen and paper scale based observational methods to determine the risk factors causing musculoskeletal disorders upper extremity was used in repetitive tasks (25). This method was presented by Moore and Garg in 1995 based on physiological, biomechanics, and epidemiological principles (26). Job strain index of 6 ergonomic risk factors, including intensity of exertion (IE), duration of exertion (DE), efforts/minutes (EM), speed of work (SW), during per day (DD), and hand/wrist posture (HWP), was determined and the final strain score was obtained by multiplying each parameter. Each variable had 5 levels of classification and provided the possibility for the observer to determine the risk factors. Also, using a fixed number for each variable made this method easy to use. For implementing this method, each job was analyzed according to its tasks, then considering the variable of each task, the degree and the severity, the score of strain index was calculated for each hand, separately. Given the range of factors to calculate the strain, all information must be entered in Table 1 to determine the multipliers of each factor, according to the schedule that was established.
Table 1.
The Parameters to Determine the Multipliers of the Job Strain Index Constituent
| Classification | Intensity of Exertion (IE) | Duration of Exertion (DE), % | Efforts/Minutes (EM) | Hand/Wrist Posture (HWP) | Speed of Work (SW) | During Per Day (DD) |
|---|---|---|---|---|---|---|
| 1 | Light | 10 > | 4 > | Very good | Very slow | 1 > |
| (1) | (0.5) | (0.5) | (1) | (1) | (0.25) | |
| 2 | Average | 10 - 29 | 4 - 8 | Good | Slow | 12 |
| (3) | (1) | (1) | (1) | (1) | (0.5) | |
| 3 | Hard | 30 - 49 | 9 - 14 | Average | Average | 2 - 4 |
| (6) | (1.5) | (1.5) | (1.5) | (1) | (0.75) | |
| 4 | Very hard | 50 - 79 | 15 - 19 | Bad | Fast | 4 - 7 |
| (9) | (2) | (2) | (2) | (1.5) | (1) | |
| 5 | At maximum power | 80 - 100 | 20 ≤ | Villainous | Very fast | 8 ≤ |
| (13) | (3) | (3) | (3) | (2) | (1.5) |
After determining the multipliers of each factor, the final score was calculated according to the following formula (25):
JSI = IE × DE × EM × HWP × SW × DD
Moore and Garg (1995) recommended a job strain index score of 5 as a discrimination criteria between a safe or hazardous condition (26). However, Drinkaus et al. (2005) proposed a classification under 4 criteria for interpreting the computed job strain index score as follows (12):
Risk level 1 (safe condition): job strain index score of less than 3;
Risk level 2 (uncertain condition): job strain index score of 3 to 5;
Risk level 3 (low-risk conditions): job strain index score of 5 to 7;
Risk level 4 (hazardous conditions): job strain index score greater than 7;
In this study, after determining the final score by the strain index, the data were analyzed using statistical package for social sciences (SPSS) (SPSS, Chicago, Illinois, USA). Also, the were were drawn by this software.
3. Results
Demographic characteristics of the studied population are presented in Table 2. Mean age of the participants was 32.6 ± 12.3. Work experience values of the subjects was 16.1 ± 11.6.
Table 2.
Demographic Characteristics of the Study Population (n = 143)
| Variable | Central and Dispersion Tendencies | ||
|---|---|---|---|
| Mean ± Standard Deviation | Min. | Max. | |
| Age, y | 32.6 ± 12.3 | 13 | 78 |
| Work experience, y | 16.1 ± 11.6 | 1 | 40 |
| Weight, kg | 64.7 ± 13.6 | 32 | 106 |
| Height, cm | 48.1 ± 11.9 | 120 | 200 |
According to the Nordic musculoskeletal questionnaire, the prevalence of musculoskeletal disorders in the study subjects during different periods is presented in Table 3. The results showed that during the last year, the most prevalent disorder was related to lower back (62.2%), upper back (60.1%), hand/wrist (55.9%), and shoulders (37.1%), respectively.
Table 3.
Musculoskeletal Disorders Reported by Carpet Weavers in Different Areas During the Last Year
| Disorders | N (%) | |||||
|---|---|---|---|---|---|---|
| Lower Back | Upper Back | Hand/Wrist | Elbow | Shoulder | Neck | |
| Yes | 89 (62.2) | 86 (60.1) | 80 (55.9) | 22 (15.4) | 53 (37.1) | 49 (34.3) |
| No | 54 (37.8) | 57 (39.9) | 63 (44.1) | 121 (84.6) | 90 (62.9) | 94 (67.5) |
The final score of the job strain index (JSI) and the risk level of sub-tasks of carpet weavers and the separation task is presented in Tables 4-6. As known, most common risk level of sub-tasks of the weaving carpet jobs were posed at 2 levels of “safe” and “hazardous”. Also including 2 sub-tasks from the 5 sub-tasks of weave tasks at the hazardous level showed a high ergonomic risk factor for this task.
Table 4.
Ratings of Variables and the Final Grade Job Strain Index (JSI) in the Sub-Tasks of Weaving
| Code of Sub-Task/Type of Hand | Intensity of Exertion | Duration of Exertion | Efforts/Minutes | Speed of Work | DurationPer Day | Hand Laterality and Wrist Posture | JSI Score |
|---|---|---|---|---|---|---|---|
| W1 | |||||||
| Right | 1 | 0.5 | 0.5 | 1 | 1 | 1.5 | 0.375 |
| Left | 1 | 0.5 | 0.5 | 1 | 1 | 1 | 0.25 |
| W2 | |||||||
| Right | 1 | 0.5 | 0.5 | 1 | 1 | 1 | 0.25 |
| Left | 1 | 0.5 | 0.5 | 1 | 1 | 1 | 0.25 |
| W3 | |||||||
| Right | 1 | 0.5 | 0.5 | 1 | 1 | 1.5 | 0.375 |
| Left | 1 | 0.5 | 0.5 | 1 | 1 | 1 | 0.25 |
| W4 | |||||||
| Right | 3 | 3 | 3 | 1.5 | 1 | 3 | 121.5 |
| Left | 3 | 3 | 3 | 1.5 | 1 | 3 | 121.5 |
| W5 | |||||||
| Right | 3 | 3 | 3 | 1.5 | 1 | 3 | 121.5 |
| Left | 1 | 3 | 3 | 1 | 1 | 1.5 | 13.5 |
Table 5.
Ratings of Variables and the Final Grade of Job Strain Index (JSI) in the Sub-Tasks of Weft Laying Thick and Combing Task
| Code of Sub-Task/Type of Hand | Intensity of Exertion | Duration of Exertion | Efforts/Minutes | Speed of Work | DurationPer Day | Hand Laterality And Wrist Posture | JSI Score |
|---|---|---|---|---|---|---|---|
| R1 | |||||||
| Right | 3 | 3 | 0.5 | 1 | 0.5 | 3 | 6.75 |
| Left | 1 | 3 | 0.5 | 1 | 0.5 | 2 | 1.5 |
| R2 | |||||||
| Right | 1 | 0.5 | 0.5 | 1 | 0.5 | 1.5 | 0.187 |
| Left | 1 | 0.5 | 0.5 | 1 | 0.5 | 1 | 0.125 |
| R3 | |||||||
| Right | 1 | 0.5 | 0.5 | 1 | 0.5 | 1.5 | 0.187 |
| Left | 1 | 0.5 | 0.5 | 1 | 0.5 | 1 | 0.125 |
| R4 | |||||||
| Right | 1 | 2 | 0.5 | 1 | 0.5 | 2 | 1 |
| Left | 1 | 2 | 0.5 | 1 | 0.5 | 2 | 1 |
| R5 | |||||||
| Right | 1 | 0.5 | 0.5 | 1 | 0.5 | 2 | 0.25 |
| Left | 1 | 0.5 | 0.5 | 1 | 0.5 | 2 | 0.25 |
| R6 | |||||||
| Right | 1 | 0.5 | 0.5 | 1 | 0.5 | 1.5 | 0.187 |
| Left | 1 | 0.5 | 0.5 | 1 | 0.5 | 1 | 0.125 |
| R7 | |||||||
| Right | 1 | 3 | 3 | 1.5 | 0.5 | 3 | 60.75 |
| Left | 1 | 3 | 3 | 1 | 0.5 | 2 | 6 |
| R8 | |||||||
| Right | 1 | 0.5 | 0.5 | 1 | 0.5 | 1 | 0.125 |
| Left | 1 | 0.5 | 0.5 | 1 | 0.5 | 1 | 0.125 |
Table 6.
Ratings of Variables and the Final Grade Job Strain Index (JSI) in the Sub-Tasks of Weft Laying Thin and Combing Task
| Code of Sub-Task/Hand Laterality | Intensity of Exertion | Duration of Exertion | Efforts/Minutes | Speed of Work | DurationPer Day | hand Laterality/Wrist Posture | JSI Score |
|---|---|---|---|---|---|---|---|
| T1 | |||||||
| Right | 1 | 0.5 | 0.5 | 1 | 0.5 | 1.5 | 0.187 |
| Left | 1 | 0.5 | 0.5 | 1 | 0.5 | 1.5 | 0.187 |
| T2 | |||||||
| Right | 1 | 0.5 | 0.5 | 1 | 0.5 | 1.5 | 0.187 |
| Left | 1 | 0.5 | 0.5 | 1 | 0.5 | 1.5 | 0.187 |
| T3 | |||||||
| Right | 1 | 0.5 | 0.5 | 1 | 0.5 | 2 | 1.5 |
| Left | 1 | 0.5 | 0.5 | 1 | 0.5 | 2 | 1.5 |
| T4 | |||||||
| Right | 1 | 0.5 | 0.5 | 1 | 0.5 | 1.5 | 0.187 |
| Left | 1 | 0.5 | 0.5 | 1 | 0.5 | 1 | 0.125 |
| T5 | |||||||
| Right | 1 | 0.5 | 0.5 | 1 | 0.5 | 1.5 | 0.187 |
| Left | 1 | 0.5 | 0.5 | 1 | 0.5 | 1 | 0.125 |
| T6 | |||||||
| Right | 3 | 3 | 3 | 1.5 | 0.5 | 3 | 60.75 |
| Left | 1 | 3 | 3 | 1 | 0.5 | 2 | 9 |
| T7 | |||||||
| Right | 1 | 0.5 | 0.5 | 1 | 0.5 | 1 | 0.125 |
| Left | 1 | 0.5 | 0.5 | 1 | 0.5 | 1 | 0.125 |
In the weave task, sub-tasks were at a safe level with the exception ofW4 and W5 sub-tasks, which were included at a dangerous risk level. In the thick weft laying and combing task, only the right hand for the R1 and R7 sub-tasks were at a dangerous risk level. Other sub-tasks were at a low and safe risk level. Also, in thin weft laying and combing task, only T6 sub-task was at a dangerous risk level and other sub-tasks were at a safe risk level.
4. Discussion
The results showed that the prevalence of musculoskeletal disorders in the upper extremities in carpet weaving jobs was significant. The results of the job strain index as high as some of the sub-tasks employed in this index showed that the values of knot and cutting knots sub-tasks for the weave task, headband and combing sub-task for the weft laying thick and combing task, combing sub-task for the weft laying thin and combing task are included in the hazardous risk level.
In this study, for assessing the risk factors causing musculoskeletal disorders of upper extremity, the strain index method was used. Assessment results in all tasks and sub-tasks of carpet workers showed that some sub-task were at the hazardous risk level. In the weave task, the most important part of the carpet weaving job, including 2 knots and cutting knots sub-tasks, was at a hazardous risk level, which can be due to the nature of the sub-tasks, particularly tiny and delicacy tasks. A high percentage of work time was allocated to knots and cutting knots sub-tasks. Doing high risk sub-tasks, such as high repetition, high-speed, quick hands and wrist movements and postures, can create an undesirable exposure (16, 19). Also, the Nordic questionnaire results and the high prevalence of hand and wrist disorders (55.9) confirmed the presence of risk factors in each task. Other studies conducted on carpet weaving occupations have approved such risk factors. The identified risk factors in previous studies, included poor posture, repetitive movements, contact stress, force during work and inappropriate environmental conditions with repetitive motions of the upper extremity (16-20, 22). The other tasks with sub-tasks at a hazardous risk level were weft laying thick and combing and weft laying thin and combing tasks. Among these tasks, the combing sub-task was at a hazardous risk level. In the combing task, the workers combed up and down regularly. However, repetitive motions with a relatively high weight comb (sometimes also reaches 2 kg) and inappropriate design tools could cause hand and wrist placement in an inappropriate manner and also place pressure on the shoulders, such as muscles of upper back and lower back (17, 19, 22). The Nordic questionnaire results and the high prevalence of lower back problems (62.1), upper back (60.1) and the shoulders (37.1) was evidence that the risk level was hazardous.
In a study steered by Choobineh et al. high prevalence of musculoskeletal disorders was reported in upper back limb, shoulders and lower back, and these results are consistent with the present study (17). Other results of the present study could be related to the age of carpet weavers; younger people (mean age: 32.6 years with average job experience of around 16.1 years) were higher in number in this study compared to other cited studies. This finding indicates low age of human forces in starting various occupations of the carpet weaving industry. High prevalence of MSDs in this study may also be related to the work experience of the carpet weavers. Consistent with this study, other studies showed that high work experience of carpet weavers could be attributed as an important risk factor in the development of DUEMSDs (20, 27).
During the past decade, studies conducted in Iran met ergonomic problems in carpet weaving, thereby important risk factors causing Distal Upper Extremities Musculoskeletal Disorders (DUEMSDs) were examined, and according to this study, various solutions were proposed to enhance or improve workstation standards in these jobs and hand tools and equipments standard criteria used in the carpet weaving industry (16-18, 20, 22, 27). However, despite these studies, as the present study indicated significant changes situation of not creating ergonomic practitioners and approaches taken by other researchers have not been implemented effectively in the job. Therefore, attending to this and increasing ergonomic standards in carpet weaving are essential.
The results showed that the prevalence of musculoskeletal disorders of the hand and fingers were high (55.9%), which may be correlated with high mobility and repetition. Since one of the main causes of the prevalence of musculoskeletal disorders of the upper extremity was excessive stress on the joints and tendons, workstations and working conditions must designed in such a way that force is in the range of motion of joints, wrists are straight and elbows are at right angle, and there is deviation of the wrist to the left or right to avoid the arms and hands being in line with the deviation from the neutral position will increase the force (8, 28).
Finally, according to the study results, the following preventive actions are recommended to prevent the development of musculoskeletal disorders of upper extremity in carpet weaving jobs: 1) Use of proper tools with wooden handle or bandaged grade, 2) Timely service and proper maintenance tool, 3) Use of adjustable benches with mattresses and back packs, 4) Working 8 hours with short rest periods between works, 5) Stretching and light exercise after any carpet weaving work, 6) Use of an ergonomic carpet frame, 7) Use of light tools,8) Proper nutrition (calcium and protein) to strengthen bones, 9) Lack of employment of workers under 15 years of professional carpet experience.
4.1. Conclusions
Knots and cutting sub-tasks in the weave task of carpet weaving jobs are the most Hazardous tasks. Implementation of ergonomic interventions focused on reducing the duration of exertion and efforts in correction of hand/wrist posture can improve workstations and reduce distal upper extremities musculoskeletal disorders risk factors in carpet weaving workers. Also, it seems that the JSI method is a sensitive and efficient ergonomic risk assessment tool for early detection of DUEMSDs, especially in carpet weaving jobs.