
1. Background
Hepatitis B is one of the most severe liver viral infections and a major global health problem, which results in one to two million deaths per year around the world (1, 2). Hepatitis B Virus (HBV) infection may progress to chronic hepatitis, liver fibrosis, cirrhosis, hepatocellular carcinoma, and death from liver failure (3). Analysis of serum hepatitis B surface antigen (HBsAg) levels is the most common method for the detection of HBV. This antigen may produce a false negative response in the early phase of the viral infection. However, after one to three months, the levels of circulating HBsAg may indicate the activity of intrahepatic HBV and predict antiviral therapy response in patients with chronic hepatitis B (CHB) (1-3). Treatment with antiviral drugs such as PEGylated interferon-alpha (Peg-IFN-a) and oral nucleoside/nucleotide analogs can result in long-lasting immune-mediated control of the disease and decrease the risk of cirrhosis and hepatocellular carcinoma (4, 5).
Recent reports proved that vitamin D has anti-fibrotic effects on human hepatic cells and plays an important role in inflammatory responses (6). Vitamin D can significantly decrease the pro-fibrotic factors in immune cells, such as T cells (2). However, population-based studies showed that up to 90% of patients with chronic liver disease had vitamin D deficiency compared to 40% - 45% of healthy populations (6). Severe vitamin D deficiency and insufficiency were reported in 34% and 47% of CHB patients, respectively (7). Some studies showed that vitamin D deficiency was associated with high HBV replication (7) and adverse clinical outcomes in CHB patients (8). Some recent research on patients with chronic hepatitis C infection also showed a relationship between liver stiffness and vitamin level (9-11). In the liver, the precursor of vitamin D is converted to its main circulating form, 25-hydroxyvitamin D [25 (OH) Vit D], by the mediatory role of cytochrome P450 (CYP). Therefore, the dysfunction of the liver in some chronic liver diseases such as viral hepatitis and non-alcoholic fatty liver disease is one of the possible results of vitamin D insufficiency or deficiency (12, 13).
Transient elastography (TE) is an imaging technology to assess changes in soft tissue elasticity resulting from specific pathological or physiological processes (14). In other words, TE is a non-invasive method used to evaluate tissue stiffness. It obtains rapid and reproducible information from a large portion of liver tissue and has a good performance for the assessment of longitude response to antiviral treatment (3).
2. Objectives
Therefore, we studied the correlation between the 25 (OH) Vitamin D level and liver fibrosis using TE in patients with hepatitis B in Khuzestan province, Iran.
3. Methods
3.1. Patients and Study Design
The current cross-sectional study was conducted on 281 hepatitis B patients, referring to the Gastroenterology Clinic of Imam Khomeini Hospital in Ahvaz, Iran, from April 2015 to September 2015. The diagnosis of hepatitis B infection was confirmed based on the presence of HBsAg measured through identical kits. Patients with a positive result of HBsAg (HBsAg+), HBV DNA ≥ 6 months, and an age of 18 - 75 years were included in the study. Patients with either of the followings were excluded from the study: regular use of vitamin D during the last six months before the study, alcohol consumption for three consecutive months before the study, fatty liver, hemochromatosis, autoimmune hepatitis, other chronic liver or kidney diseases, diabetes, osteoporosis, history of total parenteral nutrition during the past six months before the study, hypothyroidism, or Cushing’s syndrome.
The study protocol was approved by the local Ethics Committee of Ahvaz Jundishapur University of Medical Sciences (no.: IR.AJUMS.REC.1394.23), and all patients provided written informed consent before being enrolled in the study.
3.2. Measurements
In this study, 5 mL of blood was collected from patients in a fasting state, which was then centrifuged and kept at a temperature below 20°C. Serum vitamin D levels were measured by ELISA kits (Calbiotech, USA) and plasma Alanine Aminotransferase (ALT) levels by enzymatic kits (Pars Azmon, Iran).
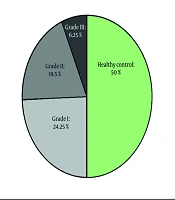
After blood sampling, patients were referred to a gastroenterologist to measure liver stiffness using a TE device (FibroScan; Echosens, France). The degree of liver stiffness was reported in kiloPascal (kPa), similar to a previous study (15). The fibrosis stage was classified according to the liver stiffness score, as follows: No or minimal fibrosis (equivalent to Metavir score F0-F1 < 7.1 kPa), moderate fibrosis (F2 = 7.1 - 7.9 kPa), severe fibrosis (F3 = 7.9 - 10.1 kPa), and advanced fibrosis (F4 > 10.1 kPa) (16).
Serum HBV DNA levels were quantified by the COBAS TaqMan HBV test (Roche Diagnostic Systems Inc. Mannheim, Germany). Moreover, serum hepatitis B early antigen (HBeAg) was measured using commercially available immunoassays (Abbott Laboratories).
Patients were categorized into three groups based on the cutoff values of 25(OH)D levels: < 20 ng/mL (vitamin D deficiency), 20 - 30 ng/mL (vitamin D insufficiency), and > 30 ng/mL (normal values of vitamin D). Then, the HBV DNA levels and liver stiffness scores were compared among those three groups.
3.3. Statistical Analysis
The mean and standard deviation were used to describe the frequency and percentage of the quantitative and qualitative variables. The levels of HBV-DNA and HBsAg were transferred to log10 IU/mL. The chi-square test was used for the categorical variables. The normality of the distribution of variables was determined by the Q-Q plot and Kolmogorov-Smirnov test.
For the univariable analysis of the data, the Pearson correlation coefficient and independent t-test were used. Multiple linear regression with a stepwise method was used for the multivariable analysis to investigate the factors associated with liver stiffness. The statistical analysis was performed using SPSS version 22 (SPSS Inc., Chicago, IL, USA). In all analyses, a P value of < 0.05 was regarded as significant.
4. Results
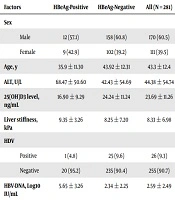
This study was performed on 281 hepatitis B patients, including 170 men (60.5%) and 111 women (39.5%), with a mean age of 43.3 ± 12.4. Twenty-one patients (7.5%) were HBeAg-positive and 260 patients (92.5%) were HBeAg-negative. The mean level of serum 25(OH) Vit. D3 was 23.69 ± 11.26 ng/ml in the patients.
Baseline epidemiological, biochemical, and virologic characteristics of all 281 hepatitis B patients are listed in Table 1. The table also shows the above-mentioned characteristics based on the status of HBeAg in the patients. It was shown that 32.4% of the patients had normal serum 25(OH) Vit. D3 levels, 31.3% had insufficient levels, and 36.3% had Vitamin D deficiency.
Table 1.
| Factors | HBeAg-Positive | HBeAg-Negative | All (N = 281) |
|---|---|---|---|
| Sex | |||
| Male | 12 (57.1) | 158 (60.8) | 170 (60.5) |
| Female | 9 (42.9) | 102 (39.2) | 111 (39.5) |
| Age, y | 35.9 ± 11.30 | 43.92 ± 12.31 | 43.3 ± 12.4 |
| ALT, U/L | 68.47 ± 50.60 | 42.43 ± 54.69 | 44.38 ± 54.74 |
| 25(OH)D3 level, ng/mL | 16.90 ± 9.29 | 24.24 ± 11.24 | 23.69 ± 11.26 |
| Liver stiffness, kPa | 9.35 ± 3.26 | 8.25 ± 7.20 | 8.33 ± 6.98 |
| HDV | |||
| Positive | 1 (4.8) | 25 (9.6) | 26 (9.3) |
| Negative | 20 (95.2) | 235 (90.4) | 255 (90.7) |
| HBV-DNA, Log10 IU/mL | 5.65 ± 3.26 | 2.34 ± 2.25 | 2.59 ± 2.49 |
Abbreviations: ALT, alanine aminotransferase; HBeAg, hepatitis B early antigen; HDV, hepatitis D virus.
aValues are expressed as mean ± SD or No. (%).
bP values of less than 0.05 (P < 0.05) are significant.
Table 2 shows the mean values of ALT (U/L), HBV-DNA (log10 IU/mL), liver stiffness (kPa), and the status of HBe-Ag (positive or negative) in the patients according to 25(OH) Vit. D3 concentration cutoff levels. According to Table 2, in patients with the 25(OH) Vit. D3 level of less than 20 ng/mL, the HBV-DNA level and liver stiffness were significantly higher than those in the patients with 25(OH) Vit. D3 concentrations above 20 ng/mL (P value < 0.001). Also, patients with vitamin D deficiency were older, with higher mean ALT levels, than patients with Vitamin D > 20 ng/mL (P value = 0.001 and 0.002 for the age and mean ALT level, respectively).
| Factors | 25(OH)Vit D3 Concentration, ng/mL | P Value | ||
|---|---|---|---|---|
| < 20 (N = 102) | 20-30 (N = 88) | ≥ 30 (N = 91) | ||
| Age | 46.80 ± 13.50 | 42.43 ± 11.99 | 40.28 ± 10.55 | 0.001 |
| Sex, % | ||||
| Male | 37.1 | 29.4 | 33.5 | |
| Female | 35.1 | 34.2 | 30.6 | |
| ALT, U/L | 59.39 ± 77.84 | 38.57 ± 38.20 | 33.16 ± 26.40 | 0.002 |
| HBV-DNA, Log10 IU/mL | 3.51 ± 2.95 | 2.19 ± 2.16 | 1.92 ± 1.87 | < 0.001 |
| HBeAg, % | ||||
| Negative | 33.8 | 31.9 | 34.2 | |
| Positive | 66.7 | 23.8 | 9.5 | |
| Liver Stiffness, kPa | 13.37 ± 9.46 | 5.83 ± 1.53 | 5.11 ± 1.94 | < 0.001 |
Abbreviations: ALT, alanine aminotransferase; HBeAg, hepatitis B early antigen.
aValues are expressed as mean ± SD.
bP values of less than 0.05 (P < 0.05) are significant.
To investigate the independent predictors of liver stiffness in CHB patients, univariate and multivariate linear regression analyses were performed. In the univariate analysis, age (P < 0.001), 25(OH) Vit. D3 levels (P < 0.001), and coinfection with hepatitis D (P = 0.001) were independently associated with liver stiffness (Tables 3 and 4).
Table 3.
Univariate Pearson Correlation Coefficient and Independent t-test Analyses of Factors Associated with Liver Stiffnessa
| Variable | Liver Stiffness, kPa | |
|---|---|---|
| R or Mean ± SD | P Value | |
| Age, y | 0.363 | < 0.001 |
| ALT (IU/L) | 0.128 | 0.032 |
| HBV-DNA, Log10 IU/mL | 0.042 | 0.481 |
| 25 (OH) D3, ng/mL | -0.580 | < 0.001 |
| Sex | 0.898 | |
| Male | 8.29 ± 6.96 | |
| Female | 8.40 ± 7.06 | |
| HDV | 0.001 | |
| Positive | 16.97 ± 13.03 | |
| Negative | 7.46 ± 5.36 | |
| HBeAg | 0.488 | |
| Positive | 9.36 ± 3.27 | |
| Negative | 8.26 ± 7.20 | |
Abbreviation: R, correlation coefficient.
aP values of less than 0.05 (P < 0.05) are significant.
Table 4.
Multivariate Linear Regression Analyses of Factors Associated with Liver Stiffnessa
| Variable | Multivariate | |||
|---|---|---|---|---|
| B | SE | Beta | P Value | |
| 25 (OH) Vit. D, ng/mL | -0.293 | 0.029 | -0.472 | < 0.001 |
| HDV (positive to negative) | 5.392 | 1.137 | 0.224 | < 0.001 |
| Age, y | 0.115 | 0.026 | 0.214 | < 0.001 |
Abbreviations: B, unstandardized coefficient; Beta, standardized coefficient; SE, standard error.
aP values of less than 0.05 (P < 0.05) are significant.
5. Discussion
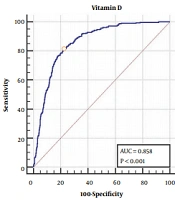
To the best of our knowledge, this is the first study to investigate the relationship between liver stiffness (measured by TE) and vitamin D levels in CHB patients in Khuzestan Province, Iran. The current study showed that the vitamin D level and liver stiffness had an inverse correlation (P < 0.001). This is consistent with the Grunhage et al. (17) study in which significantly lower levels of 25(OH) Vit. D3 was found in patients with liver stiffness of greater than 7 kPa compared to those with liver stiffness of lower than 7 kPa (28.3 ng/mL versus 22.1 ng/mL; P < 0.001) (20). Farnik et al. (7) reported a strong relationship between high levels of HBV replication and lower serum 25(OH) Vit. D3 levels in CHB patients. In contrast, a study in Southern China did not find any association between the vitamin D level and HBV viral load or fibrosis stage in CHB patients (18).
In the current study, an intense correlation was found between HBV-DNA levels and 25(OH) Vit. D3 levels (P < 0.001). This study also demonstrated an intense inverse linear correlation between serum vitamin D values and liver stiffness in hepatitis B patients. Coinfection with hepatitis D can increase liver stiffness, and there is an association between the age and liver stiffness (19). Previous studies showed that HDV infection enhanced the risk of liver cirrhosis and hepatic decompensation in patients with HBV coinfection (19). In this study, coinfection with hepatitis D was associated with higher degrees of liver stiffness. Our analysis also showed that the correlation between the patient’s age and liver stiffness was strong. Previous studies also showed that liver fibrosis was related to the patient’s age (20, 21). Sunlight exposure, diet, and vitamin D supplement are the most important factors in vitamin D levels. Sunlight exposure plays a key role in vitamin D synthesis in the skin.
Our study had some limitations. First, this investigation did not evaluate other potential confounders that may affect the serum vitamin D levels, such as dietary status and the daily duration of sunlight exposure. Second, the cross-sectional nature of this investigation did not permit to determine the causal relationships between low serum 25(OH) Vit. D3 levels and liver fibrosis. Multi-center studies with larger sample sizes are needed to evaluate the potential role of vitamin D level in liver stiffness in patients with CHB. Large prospective and cohort studies are suggested to evaluate the association between the baseline vitamin D level and liver stiffness in HBV patients.
5.1. Conclusions
This study demonstrated an intense inverse linear correlation between serum vitamin D levels and liver stiffness in hepatitis B patients. An increase in age and coinfection with hepatitis D were directly related to liver stiffness.