
1. Background
Cirrhosis is a severe, late-stage scarring (fibrosis) of the liver, typically resulting from long-term liver diseases and conditions such as hepatitis, chronic alcoholism, non-alcoholic fatty liver disease (NAFLD), and non-alcoholic steatohepatitis (NASH) (1). This serious condition is prevalent worldwide and has increasingly become a significant health burden since the 1990s (2). Previous studies indicate that the global prevalence of cirrhosis ranges from 4.5 to 9.5% of the general population (2). However, these rates are likely underestimated, as most patients remain asymptomatic (3).
Cirrhosis was ranked as the 11th leading cause of global mortality in 2016 (4). In 2017, cirrhosis and other chronic liver disorders accounted for 1.42% of all deaths in Iran (5). Additionally, the total number of deaths caused by cirrhosis in Iran gradually increased from 1990 to 2002, then declined by 2015, possibly due to the national hepatitis B virus (HBV) vaccination program (6).
Effective prevention of cirrhosis requires an understanding of its associated risk factors, which remain inadequately described. Recent developments, such as the availability of treatments for hepatitis C virus (HCV) and HBV, along with increased rates of obesity, NAFLD, NASH, metabolic syndrome, and alcohol consumption, have influenced the epidemiology of cirrhosis (7). Therefore, further studies are needed to better elucidate the risk factors for the development and progression of cirrhosis.
Cirrhosis leads to several complications, including ascites, variceal bleeding, non-bleeding varices, hepatic encephalopathy, hepatorenal syndrome, and spontaneous bacterial peritonitis (SBP) (8). The management of the disease typically focuses on stabilizing the patient's clinical condition, with liver transplantation being the only definitive treatment (9). Despite advances in medical care for cirrhosis patients, the mortality rate from infections, hepatocellular carcinoma, and complications related to cirrhosis remains high (10).
2. Objectives
Currently, there are few long-term studies investigating the characteristics of patients with cirrhosis in Iran. Therefore, this study aimed to: (1), Provide epidemiological data on patients with cirrhosis recorded in our database; (2), elucidate the prevalence and distribution of risk factors, etiologies, and complications associated with cirrhosis among patients; and (3), define the outcomes associated with cirrhosis during the 13-year data registry. These variables were compared between patients registered from 2009 - 2016 and those registered from 2017 - 2022, corresponding with the period of full hepatitis vaccination coverage.
3. Methods
This descriptive-analytical study analyzed the medical records of 3,620 patients diagnosed with cirrhosis, registered at the Shiraz Gastroenterohepatology Research Center, Shahid Motahhari clinic, Iran, between 2009 and 2022. The patients were divided into two groups based on the period of full hepatitis vaccination coverage: Group one consisted of patients registered from 2009 - 2016, and group two consisted of those registered from 2017 - 2022. The patients included in this ongoing database span all age groups, with cirrhosis diagnoses confirmed through various techniques, including ultrasound imaging (sonography), fibroscan screening, computed tomography (CT), magnetic resonance imaging (MRI), and liver biopsy, in addition to clinical and biochemical parameters. Eligible subjects are referred to the clinic by gastroenterologists, where the study's objectives are explained to each patient or their legal guardian before obtaining informed consent. A gastroenterologist subsequently confirms the diagnosis of cirrhosis following a comprehensive examination. After this confirmation, a baseline questionnaire is completed for each patient, capturing demographic, clinical, and laboratory data, disease progression details, history of alcohol and drug exposure, personal and family medical histories, and past surgical procedures. Moreover, complications and outcomes (mortality, hepatocellular carcinoma, and liver transplantation) are documented every six months. Participants are followed up via telephone for data collection, with physician visits being recorded. Participants reporting any complications or relevant outcomes are requested to share their medical records for uploading into the database. A gastroenterologist is tasked with verifying these records.
Regular alcohol use is defined as individuals who consume alcohol most weeks of the year (11), and current smokers are defined as those who have smoked cigarettes daily over the past six months (12). Data for patients registered during the initial period are evaluated retrospectively without current follow-up, whereas patients registered during the subsequent period are monitored prospectively. The local Ethics Committee of Shiraz University of Medical Sciences has granted ethical approval for the project (IR.SUMS.REC.1394.S200).
3.1. Statistical Analysis
The statistical analysis was conducted using SPSS 26. Continuous parametric and non-parametric variables are reported as means ± standard deviations (SDs) and medians [interquartile range (IQR)], respectively, while categorical variables are reported as numbers (percentages). The Shapiro-Wilk test was used to assess the normal distribution of the data. Differences between and within groups were analyzed based on data classification, using two statistical methods. For non-parametric data, the Mann-Whitney U test was used, and for categorical variables, the chi-square or Fisher's exact tests were applied. A P-value of < 0.05 was considered significant.
4. Results
Our database contains records of 3,620 patients, with 2 937 participants registered between 2009 and 2016 (group 1), and 683 registered between 2017 and 2022 (group 2). Although no significant differences were found in sex distribution and nationality, significant variations in age and marital status were observed between these two periods (P-value < 0.001) as reported in Table 1. Among participants enrolled in the first period, 84 (2.9%) reported regular alcohol consumption, compared to 90 (13.2%) between 2017 and 2022. Additionally, in the first period, 225 participants (7.7%) were current cigarette smokers, while in the second period, this frequency increased to 198 (28.3%).
| Basic Characteristics | 2009 - 2016 | 2017 - 2022 | P-Value c |
|---|---|---|---|
| Total | 2937 | 683 | - |
| Sex | 0.098 | ||
| Male | 1902 (64.8) | 468 (68.5) | |
| Female | 1035 (35.2) | 215 (31.5) | |
| Nationality | 0.716 | ||
| Iranian | 2960 (98.2) | 596 (98) | |
| Others | 53 (1.8) | 12 (2) | |
| Marital status | < 0.001 | ||
| Single | 1407 (50.6) | 107 (15.9) | |
| Married | 1376 (49.4) | 541 (80.4) | |
| Divorced | 0 (0.0) | 8 (1.2) | |
| Widowed | 0 (0.0) | 17 (2.5) | |
| Age (y) | < 0.001 | ||
| < 25 | 539 (18.3) | 20 (3.30) | |
| 25 - 34 | 263 (8.9) | 28 (4.6) | |
| 35 - 44 | 305 (10.50) | 71 (11.7) | |
| 45 -54 | 451 (15.30) | 147 (24.1) | |
| 55 - 64 | 750 (25.50) | 201 (33.00) | |
| 65 - 74 | 432 (14.7) | 109 (17. 9) | |
| > 75 | 197 (6.7) | 33 (5.4) |
a Values are expressed as No. (%).
b Between-group differences were determined using the chi-square test.
c P-values < 0.05 are significant.
Based on Table 2, it is observed that the baseline serum levels of alanine transaminase, aspartate transaminase, alkaline phosphatase, blood urea nitrogen, bilirubin, prothrombin time, international normalized ratio, and white blood cells were significantly lower (all P-values < 0.001), while the levels of albumin, protein, platelets, and hemoglobin were higher among patients registered during the second period compared to those during the first period.
| Parameters | 2009 - 2016 (n = 2937) | 2017 - 2022 (n = 683) | P – Value c |
|---|---|---|---|
| AST, IU/L | 79.00 (46.00 - 152.00) | 40.00 (30.00 - 68.00) | < 0.001 |
| ALT, IU/L | 52.00 (30.00 - 107.00) | 33.00 (22.00 - 54.00) | < 0.001 |
| ALP, IU/L | 344.00 (228.00 - 564.00) | 259.00 (193.50 - 358.50) | <0.001 |
| Albumin, g/dL | 3.10 (2.70 - 3.60) | 3.60 (3.10 - 4.20) | <0.001 |
| Protein, g/dL | 6.90 (6.10 - 7.60) | 7.10 (6.60 - 7.60) | 0.003 |
| Platelet count, 103/µL | 92.00 (54.00 - 155.75) | 98.50 (65.75 - 140.00) | 0.186 |
| WBC, µL | 6600.00 (4300.00 - 10300.00) | 5000.00 (3700.00 - 6700.00) | < 0.001 |
| INR | 1.83 (1.40 - 2.55) | 1.23 (1.09 - 1.53) | < 0.001 |
| PT | 18.00 (15.20 - 21.50) | 14.20 (13.00 - 16.40) | < 0.001 |
| Hb, g/dL | 10.60 (9.00 - 12.40) | 12.50 (10.60 - 14.30) | < 0.001 |
| FBS, mg/dL | 103.00 (84.00 - 144.00) | 103.00 (89.50 - 139.00) | 0.133 |
| Bilirubin total, mg/dL | 4.00 (1.90 - 11.56) | 1.40 (1.00 - 2.33) | < 0.001 |
| Bilirubin direct, mg/dL | 1.40 (0.60 - 4.70) | 0.47 (0.30 - 0.81) | < 0.001 |
| Creatinine, mg/dL | 1.00 (0.70 - 1.60) | 1.00 (0.90 - 1.13) | 0.760 |
| BUN, mg/dL | 18.00 (11.00 - 34.00) | 15.00 (11.00 - 19.22) | < 0.001 |
z Abbreviations: ALP, alkaline phosphatase; ALT, alanine transaminase; AST, aspartate transaminase; BUN, blood urea nitrogen; FBS, fasting blood glucose; Hb, hemoglobin; INR, international normalized ratio; IQR, interquartile range; PT, prothrombin time; WBC, white blood cells.
aValues are expressed as median (IQR).
b Between-group differences in variables were determined using the Mann–Whitney U test.
c P-values < 0.05 are significant.
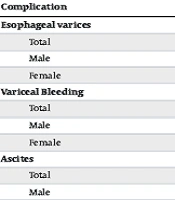
Among the patients studied, ascites was the most common complication in the first period, whereas esophageal varices were more prevalent in the second period. Except for esophageal varices (34.4% vs. 40.1%, P-value = 0.005), other complications such as ascites (52.1% vs. 31.8%, P-value < 0.001), variceal bleeding (19.9% vs. 15.7%, P-value = 0.012), SBP (14.5% vs. 6.7%, P-value < 0.001), hepatorenal syndrome (8.1% vs. 4.0%, P-value = 0.005), portal vein thrombosis (6.8% vs. 2.6%, P-value = 0.001), and hepatic encephalopathy (31.2% vs. 8.8%, P-value < 0.001) were significantly more common among patients registered during the first period compared to the second period. Additionally, there were higher rates of SBP among men in both periods (Table 3).
| Complication | 2009 - 2016 (n = 2937) | P-Value d | 2017 - 2022 (n = 683) | P-Value d | P-Value |
|---|---|---|---|---|---|
| Esophageal varices | 0.058 | 0.900 | |||
| Total | 1011 (34.4) | 274 (40.1) | |||
| Male | 678 (67.1) | 187 (68.2) | 0.005 e | ||
| Female | 333 (32.9) | 87 (31.8) | 0.710 f | ||
| Variceal bleeding | 0.038 | 0.877 | |||
| Total | 583 (19.9) | 107 (15.7) | |||
| Male | 399 (68.4) | 74 (69.2) | 0.012 e | ||
| Female | 184 (31.6) | 33 (30.8) | 0.883 f | ||
| Ascites | 0.261 | 0.059 | |||
| Total | 1531 (52.1) | 217 (31.8) | |||
| Male | 1006 (65.7) | 138 (63.6) | < 0.001 e | ||
| Female | 525 (34.3) | 9 (36.4) | 0.540 f | ||
| Spontaneous bacterial pertonitis | 0.044 | 0.012 | |||
| Total | 353 (14.5) | 32 (6.7) | |||
| Male | 212 (60.1) | 15 (46.9) | < 0.001 e | ||
| Female | 141 (39.9) | 17 (53.1) | 0.147 f | ||
| Hepatorenal syndrome | 0.355 | 0.526 | |||
| Total | 237 (8.1) | 27 (4.0) | |||
| Male | 160 (67.5) | 17 (63.0) | 0.005 e | ||
| Female | 77 (32.5) | 10 (37.0) | 0.634 f | ||
| Portal vein thrombosis | 0.524 | 0.864 | |||
| Total | 201 (6.8) | 18 (2.6) | |||
| Male | 126 (62.7) | 12 (66.7) | 0.001 e | ||
| Female | 75 (37.3) | 6 (33.3) | 0.738 f | ||
| Hepatic encephalopathy | 0.178 | 0.155 | |||
| Total | 917 (31.2) | 60 (8.8) | |||
| Male | 610 (66.5) | 46 (76.7) | < 0.001 e | ||
| Female | 307 (33.5) | 14 (23.3) | 0.105 f |
a Values are expressed as No. (%).
b Between-group differences were assessed using the chi-square test.
c P-values < 0.05 are significant.
d Comparison of sex distribution in each period.
e Comparison of total number of complication between two periods.
f Comparison of sex distribution between two periods.
In an additional analysis, we assessed the frequency of cirrhosis complications in the population aged under 15 years at two time points. However, none of the complications showed a statistically significant difference between these two time points (Appendix 1 in the Supplementary File).
Between 2009 and 2016, HBV was the most common etiology of cirrhosis, accounting for 20.6% of cases, followed by cryptogenic cirrhosis (20.1%), autoimmune hepatitis (14.1%), and HCV (11.5%). In the subsequent period, the most common etiology was HCV (30.4%), followed by cryptogenic cirrhosis (18.9%), HBV (16.8%), NAFLD/NASH (7.1%), and autoimmune hepatitis (6.8%). Notably, the prevalence of HBV (P-value = 0.030), autoimmune hepatitis (P-value < 0.001), primary sclerosing cholangitis (P-value = 0.001), and Wilson's disease (P-value = 0.010) was significantly higher among patients registered in the first period, whereas HCV (P-value < 0.001) and NAFLD/NASH (P-value < 0.001) were more common in the second period. The prevalence of intravenous (IV) drug abuse was significantly higher among patients with HBV (16.1% vs. 8.9%), autoimmune hepatitis (19.4% vs. 8.9%), and NAFLD (25.0% vs. 6.4%) in the first period compared to the second. However, it was lower among patients with HCV (27.3% vs. 50.5%) (Table 4). Males had higher rates of HBV, HCV, and alcohol-related liver diseases in both study periods compared to females. However, females had higher rates of autoimmune hepatitis, primary biliary cholangitis, and primary sclerosing cholangitis in the second period compared to males. The sex distributions of autoimmune hepatitis and primary biliary cholangitis differed significantly between the two periods (Table 5).
Table 4.
| Variables | Frequency | IV Drug Abusers | ||||
|---|---|---|---|---|---|---|
| 2009 - 2016 | 2017 - 2022 | P-Value c | 2009 - 2016 | 2017 - 2022 | P-Value c | |
| Hepatitis B | 604 (20.6) | 112 (16.8) | 0.030 | 97 (16.1) | 10 (8.9) | 0.008 |
| Hepatitis C | 337 (11.5) | 202 (30.4) | < 0.001 | 92 (27.3) | 102 (50.5) | < 0.001 |
| Autoimmune hepatitis | 413 (14.1) | 45 (6.8) | < 0.001 | 80 (19.4) | 4 (8.9) | 0.048 |
| PBC | 69 (2.3) | 8 (1.2) | 0.074 | 9 (13.0) | 1 (12.5) | 1.000 |
| PSC | 149 (5.1) | 15 (2.3) | 0.001 | 9 (6.0) | 0 (0.0) | 0.596 |
| NAFLD/NASH | 40 (1.4) | 47 (7.1) | < 0.001 | 10 (25.0) | 3 (6.4) | 0.003 |
| Wilson | 87 (3.0) | 8 (1.2) | 0.010 | 10 (11.5) | 0 (0) | 0.591 |
| Alcohol related | 71 (2.4) | 24 (3.6) | 0.083 | 26 (36.6) | 17 (70.8) | 0.005 |
| Hemochromatosis | 47 (1.6) | 5 (0.8) | 0.107 | 4 (8.5) | 1 (20.0) | 0.379 |
| Cryptogenic | 589 (20.1) | 126 (18.9) | 0.518 | 18 (3.0) | 12 (9.5) | 0.018 |
z Abbreviations: PBC, primary biliary cholangitis; PSC, primary sclerosing cholangitis; NASH, nonalcoholic steatohepatitis; NAFLD, non-alcoholic fatty liver disease.
a Values are expressed as No. (%).
b Between-group differences in variables were determined using the chi-square or Fisher's exact test for categorical variables.
c P-values < 0.05 are significant.
| Variables | 2009 - 2016 (n = 2937) | P-Value d | 2017 - 2022 (n = 683) | P-Value d | P-Value e |
|---|---|---|---|---|---|
| Hepatitis B | < 0.001 | 0.006 | 0.620 | ||
| Male | 492 (81.5) | 89 (79.5) | |||
| Female | 112 (18.5) | 23 (20.5) | |||
| Hepatitis C | < 0.001 | 0.001 | 0.238 | ||
| Male | 276 (81.9) | 157 (77.7) | |||
| Female | 61 (18.1) | 45 (22.3) | |||
| Autoimmune hepatitis | < 0.001 | < 0.001 | 0.048 | ||
| Male | 211 (51.1) | 16 (35.6) | |||
| Female | 202 (48.9) | 29 (64.4) | |||
| PBC | 0.494 | 0.002 | 0.019 | ||
| Male | 42 (60.9) | 1 (12.5) | |||
| Female | 27 (39.1) | 7 (87.5) | |||
| PSC | 0.429 | 0.016 | 0.102 | ||
| Male | 92 (61.7) | 6 (40.0) | |||
| Female | 57 (38.3) | 9 (60.0) | |||
| NAFLD/NASH | 0.333 | 0.001 | 0.320 | ||
| Male | 23 (57.5) | 22 (46.8) | |||
| Female | 17 (42.5) | 25 (53.2) | |||
| Wilson | 0.149 | 1.000 | 0.464 | ||
| Male | 50 (57.5) | 6 (75.0) | |||
| Female | 37 (42.5) | 2 (25.0) | |||
| Alcohol-related | < 0.001 | < 0.001 | 1.000 | ||
| Male | 69 (97.2) | 24 (100.0) | |||
| Female | 2 (2.8%) | 0 (0.0) | |||
| Hemochromatosis | 0.630 | 0.332 | 0.305 | ||
| Male | 32 (68.1) | 5 (100.0) | |||
| Female | 15 (31.9) | 0 (0.0) | |||
| Cryptogenic | < 0.001 | 0.173 | 0.246 | ||
| Male | 341 (57.9) | 80 (63.5) | |||
| Female | 248 (42.1) | 46 (36.5) |
z Abbreviations: PBC, Primary biliary cholangitis, PSC, Primary sclerosing cholangitis, NAFLD, Non-alcoholic fatty liver disease, NASH, Nonalcoholic steatohepatitis.
a Values are expressed as No. (%).
b Between-group differences in variables were determined using the chi-square or Fisher's exact test for categorical variables.
c P-values < 0.05 are significant.
d Comparison of sex distribution in each period.
e Comparison of sex distribution between two period.
The comparison of outcomes among registered patients with cirrhosis is presented in Appendix 2 (in Supplementary File). Among patients registered during the first period, 1.348 (45.9%) underwent liver transplantation, and 1.026 (34.9%) died during this time. These proportions were significantly higher than those observed among patients registered during the second period [199 (29.1%) underwent liver transplantation and 81 (11.9%) died; P-value < 0.001]. Notably, post-transplantation mortality rates were higher among patients registered during the first period compared to the second (P-value < 0.001), with 23.3% (n = 314) and 8.0% (n = 16) of patients who received transplants during the first and second periods, respectively, passing away.
5. Discussion
While researchers in developed countries have extensively studied the epidemiology of liver cirrhosis, unfortunately, this subject has received little focus in developing countries, possibly due to the low quality of available data (6). In this study, we aimed to assess the distribution of risk factors, etiologies, complications, and outcomes associated with cirrhosis among our registered patients.
The investigation of cirrhosis across two time periods revealed a noteworthy reduction in biochemical factors and a decrease in the prevalence of liver diseases during the second period. Data analysis showed that despite vaccination, viral hepatitis remains the most common cause of cirrhosis in both periods, and it was more prevalent among men.
Furthermore, besides the crucial role of vaccination, differences between these periods may be attributed to advancements in disease management and public health measures, where vaccination plays a key role.
Assessing baseline data showed that, despite the higher involvement of older individuals in both groups, the incidence of young people (less than 25 years) was lower in the second group. Initially, studies believed that one of the risk factors for kidney problems, including liver cirrhosis, is age (13). Studies suggest that cirrhosis is more frequently seen after the age of 50 (14) and is also more common in men than in women (8), as reflected in our study data. In this regard, in our study, HBV and HCV were the most common etiologies of cirrhosis, with a higher prevalence among men. This gender disparity may be attributed to a higher frequency of business travel and high-risk behaviors for hepatitis transmission among males compared to females, as supported by previous literature (15). Moreover, it has been observed that men exhibit lower levels of awareness regarding health issues compared to women. Consequently, cirrhosis tends to occur less frequently in women, owing to their lower prevalence of HBV, HCV, and alcohol consumption.
On the other hand, the immune response to vaccines is higher at a younger age; therefore, even if we assume that vaccine administration across different age groups is the same, which it is not, younger individuals still show a better response to the vaccine. In this context, autoimmune hepatitis causes cirrhosis at younger ages, while other factors such as NAFLD tend to cause cirrhosis at older ages (14).
In this medical registry-based study, it was observed that biochemical tests showed better results in the second period compared to the first. As we know, elevated levels of liver enzymes such as ALT, AST, and alkaline phosphatase, along with increased levels of bilirubin and immunoglobulins and lower levels of albumin, are the most important biomarkers in the diagnosis of cirrhosis. Our study indicated that in the second group, these factors were significantly reduced in patients with cirrhosis compared to the first group, which could impact their mortality. Other studies in our country share a similar view (5, 6). One study showed that deaths due to cirrhosis decreased significantly by 2015, which they believe aligns with the period of maximum coverage of hepatitis B vaccination (6). However, no study has examined the changes in biomarker levels in the years following vaccination compared to the years before, and what we have found in this study opens a window into a new realm of understanding. Nonetheless, the efforts of the Ministry of Health in effectively controlling hepatitis B and striving to meet the WHO global health goals for hepatitis C by 2030, thereby improving liver health in society, should not be overlooked. It is important to note that studies suggest that in cirrhosis patients, the anti-HBs titer is very low, especially after eight months (16).
Patients with cirrhosis exhibited ascites, esophageal varices, and hepatic encephalopathy as the most prevalent complications. Similarly, prior literature has identified these conditions as major complications of cirrhosis that may impact the quality of life and survival of affected individuals (17). The prevalence of ascites and hepatic encephalopathy was found to be lower in the second period of our study. As mentioned previously, these improvements may be attributed to enhanced disease management; moreover, with the implementation of more effective guidelines and follow-up procedures, patient recovery and the faster diagnosis of disease complications have improved over the years. Cirrhosis trends have improved worldwide, partly due to the effectiveness of available therapies for the prevention and treatment of HBV and HCV. This is evidenced by the thirty-year decline in liver disease mortality rates worldwide (4). However, HBV and HCV continue to be major causes of cirrhosis worldwide, particularly in low-income countries (18).
Our findings also indicate that autoimmune hepatitis, primary biliary cholangitis, primary sclerosing cholangitis, and NAFLD were more prevalent among women. Notably, the prevalence of NAFLD was higher among patients in the second period compared to the first period. Therefore, it is imperative to implement cost-effective strategies for maintaining screening and management of viral hepatitis and achieving early detection and prevention of cirrhosis caused by alcohol-related liver diseases and NAFLD/NASH.
Patients with cirrhosis require long-term treatment, even though liver transplantation may be the sole treatment option (19). In 2017, cirrhosis resulted in 1.32 million deaths worldwide, with approximately two-thirds occurring in men and one-third in women (4). In the current investigation, mortality and transplantation rates were comparatively greater among patients who were registered in the first period than those registered during the subsequent period, which can be attributed in part to the relatively longer duration of follow-up in this cohort. Furthermore, the mortality following liver transplantation was significantly lower in the second period, which could be due to improvements in organ preservation and matching, surgical techniques, and the prevention and management of complications.
Our study encountered several limitations. The underreporting of alcohol intake in the present study is likely influenced by cultural and religious considerations, potentially leading to an underestimation of its contribution to the prevalence of cirrhosis. Additionally, the observed differences among patients registered in two distinct periods may be partly attributed to variations in alcohol consumption, which could have increased over time. Moreover, our inclusion of only patients referred to our clinic may constrain the generalizability of our findings. Evaluating these outcomes in alternative centers with diverse age, sex distribution, or cultural attributes could yield disparate results.
5.1. Conclusions
In conclusion, patients registered in the second period exhibited better laboratory and clinical outcomes. Viral hepatitis remains the most common cause of cirrhosis in both periods and was more prevalent among men. The epidemiological characteristics of cirrhosis indicate that targeted intervention policies, such as hepatitis B vaccination, have contributed to reducing the progression of cirrhosis.