1. Background
Patients with severe liver dysfunction secondary to alcoholic liver disease (ALD) present an important clinical and social problem, given that the mortality rate in this group of patients is exceptionally high (1-3). Patients who do not respond to therapy, have been alcohol-free for at least six months, and have no other contraindications can be listed as eligible for liver transplants. For the patients who do not respond to standard treatment, extracorporeal liver support which does not eliminate the cause of the disease, but instead allows time for liver regeneration appears to be an attractive alternative that may improve the patients’ prognoses. Extracorporeal liver support can be provided using the fractionated plasma separation and adsorption (FPSA) technique with the Prometheus® system, the molecular adsorbent recirculating system (MARS) or single pass albumin dialysis (SPAD) (4-12). One of the most important factors affecting the outcome is appropriate patient selection. A vast majority of patients with severe liver dysfunction also exhibit failure in several additional organs and have poor prognoses regardless of whether extracorporeal liver support (FPSA, MARS, or SPAD) is provided. As a result, the 30-day mortality rate in this patient group often exceeds 70% (1-3).
There are only limited data available on the benefits of using extracorporeal liver support techniques in patients with severe liver dysfunction secondary to ALD who do not respond to the standard treatment.
2. Objectives
The main aim of this study was to evaluate the usefulness of applying extracorporeal liver support techniques in the treatment of this group of patients. The secondary aims were to identify the independent risk factors and to assess the predictive values of the following scoring systems: the Glasgow coma scale (GCS), the sequential organ failure assessment (SOFA), the Acute physiology and chronic health evaluation II (APACHE II), the simplified acute physiology score II (SAPS II), the model of end-stage liver disease modified by the united network for organ sharing (MELD UNOS Modification), and the modified Maddrey’s discriminant function (DF) in patients with severe liver dysfunction secondary to ALD.
3. Patients and Methods
3.1. Study Population and Data Collection
The data from a total of 23 hospital admissions of 21 patients with ALD (15 men and 6 women) aged between 24 and 58 years who were admitted to the department of anesthesiology and intensive therapy (A&IT) at the Dr Wł. Biegański Regional specialist hospital in Łódź between March 2013 and July 2015 were retrospectively analyzed. The first stage of the study involved the identification of patients who were treated in the A&IT Department for severe liver dysfunction secondary to ALD with at least one extracorporeal liver support technique, either FPSA or SPAD, between March 2013 and July 2015. Severe liver dysfunction was defined by a MELD UNOS modification score of 18 or higher. The MELD UNOS modification scores and DF scores were calculated using the collected data. The MELD UNOS modification scores were determined using an online calculator. The diagnosis of ALD in the patients was based on a history of excessive alcohol intake for several years along with clinical, laboratory, radiological, or histological evidence of liver disease.
In the second stage, the medical records of the patients were examined by focusing specifically on the each patient’s age; sex; reason for A&IT Department admission; primary and concomitant diseases; clinical stage of ALD; GCS, MELD UNOS Modification, and DF scores upon admission to the A&IT department; SOFA, APACHE II, and SAPS II scores on the first day of hospitalization in the A&IT department; the duration of stay in the A&IT department (in days); and the total duration of hospitalization. The DF scores were calculated using the collected data with an online calculator. The following parameters were also considered: the total bilirubin levels, direct bilirubin levels, bile acid levels, ammonia levels, creatinine levels, prothrombin time, prothrombin ratio (INR), and albumin levels prior to the first liver dialysis, as well as the direct bilirubin levels, total bilirubin levels, bile acid levels, ammonia levels, and INR after performing the last albumin dialysis.
3.2. Extracorporeal Liver Support Techniques Administered
3.2.1. FPSA Treatment
FPSA eliminates water-soluble and protein-bound toxins and the products that the metabolism has broken down. In the FPSA circuit, the venous blood passes through a separator with a pore size of 250 kDa (AlbuFlow, Fresenius AG, Bad Homburg, Germany). The separated plasma then passes through a neutral resin absorbent column (Prometh01, Fresenius AG, Bad Homburg, Germany) and an anion exchange resin absorber (Prometh02, Fresenius AG, Bad Homburg, Germany) to remove the albumin-bound toxins. The plasma phase is then returned to the filter and dialyzed as whole blood in a high flow dialyzer (F60S, Fresenius) to remove the water-soluble toxins (13).
After a preliminary phase involving a gradual increase in the blood and plasma flow rates in the secondary circuit, which required approximately twelve minutes, the treatment was performed with a blood flow of 180 mL/min and a plasma flow of 270 - 360 mL/min. In one case, the plasma flow rate in the secondary circuit was increased to 450 mL/min during the final hours of the procedure to increase the efficacy of FPSA. Sodium citrate was used as an anticoagulant. The duration of an individual procedure usually lasted six to 10 hours. Some procedures were completed in less than six hours because of technical problems (which were likely caused by coagulation on the albumin filter).
3.2.2. SPAD Treatment
Liver dialysis was performed using the SPAD technique with the aid of standard equipment for continuous venovenous haemodialysis. Each patient’s blood was dialyzed against a standard dialysis solution containing 2% or 4% albumin. The patient’s blood was dialyzed through a high-flux hollow-fiber hemodiafilter. The treatment was performed with a blood flow of 100 - 200 mL/min and a dialysate flow of 1,000 mL/hour. The dialysate, which was enriched with albumin following the point of single contact with the patient’s blood in the hemofilter, was then drained into the waste bag and disposed of. The procedure used 10,000 mL of dialysate containing 2% albumin or 5,000 mL of dialysate containing 4% albumin. Sodium citrate was used as an anticoagulant. Depending on the albumin concentration in the dialysate, the duration of a single procedure lasted five to 10 hours.
3.3. Statistical Analysis
The results were analyzed with the statistical package PQStat ver. 1.6. The predictive value for patient death was investigated using receiver operating characteristic (ROC) curves. The probability value of P < 0.05 was recognized as statistically significant.
3.4. Ethics Statement
This study was approved by the bioethics committee of the Medical University of Łódź (RNN/242/15/KB). Because of the retrospective nature of this study and in accordance with Polish law, no informed consent was required.
4. Results
Between March 2013 and July 2015, there were 21 patients with severe liver dysfunction secondary to ALD that were treated with extracorporeal liver support techniques during a total of 23 hospitalizations in the A&IT department. The patients’ mean age was 38 ± 9 years. Upon intensive care unit (ICU) admission, the median (interquartile range [IQR]) GCS, SOFA, APACHE II, and SAPS II scores were 15 (14 - 15), 9 (7 - 13), 17 (14 - 24) and 32 (22 - 50), respectively. The demographics and clinical characteristics of the patients with severe liver dysfunction secondary to ALD who received at least one extracorporeal liver support procedure upon ICU admission are included in Tables 1 and 2.
Table 1.
Patient Characteristics Upon ICU Admission (23 Hospitalizations)
| Number of Hospitali-Zations | Age, y | Gender | GCS Score | SOFA Score | APACHE II Score | SAPS II Score | MELD UNOS Modification Score | Maddrey’s Score | Stage of Alcoholic Liver Disease |
|---|---|---|---|---|---|---|---|---|---|
| 1 | 24 | Male | 15 | 9 | 11 | 15 | 29 | 82.86 | Alcoholic cirrhosis |
| 2 | 51 | Male | 14 | 13 | 22 | 22 | 32 | 119.6 | Alcoholic cirrhosis |
| 3 | 27 | Male | 14 | 6 | 13 | 17 | 26 | 57.47 | Alcoholic hepatitis |
| 4 | 52 | Female | 15 | 14 | 16 | 50 | 30 | 103.06 | Alcoholic cirrhosis |
| 5 | 38 | Male | 15 | 8 | 19 | 18 | 28 | 85.93 | Alcoholic cirrhosis |
| 6 | 27 | Male | 5 | 20 | 36 | 70 | 39 | 95.23 | Alcoholic cirrhosis |
| 7 | 58 | Male | 3 | 17 | 37 | 72 | 39 | 69.37 | Alcoholic cirrhosis |
| 8 | 33 | Male | 15 | 13 | 16 | 38 | 37 | 38.94 | Alcoholic hepatitis |
| 9 | 35 | Male | 14 | 14 | 25 | 54 | 42 | 94.71 | Alcoholic cirrhosis |
| 10 | 25 | Male | 15 | 8 | 17 | 34 | 33 | 147.25 | Alcoholic cirrhosis |
| 11 | 28 | Male | 15 | 8 | 17 | 29 | 28 | 76.59 | Alcoholic hepatitis |
| 12 | 43 | Male | 14 | 13 | 30 | 54 | 41 | 71.47 | Alcoholic cirrhosis |
| 13 | 38 | Female | 15 | 7 | 8 | 31 | 31 | 111.78 | Alcoholic cirrhosis |
| 14 | 35 | Male | 14 | 9 | 19 | 35 | 37 | 114.05 | Alcoholic hepatitis |
| 15 | 51 | Female | 14 | 7 | 15 | 31 | 24 | 45.01 | Alcoholic hepatitis |
| 16 | 39 | Female | 15 | 12 | 27 | 35 | 34 | 155.27 | Alcoholic hepatitis |
| 17 | 44 | Male | 15 | 10 | 18 | 44 | 43 | 105.32 | Alcoholic cirrhosis |
| 18 | 37 | Male | 15 | 11 | 14 | 28 | 33 | 82.21 | Alcoholic cirrhosis |
| 19 | 35 | Male | 15 | 6 | 9 | 18 | 29 | 83.15 | Alcoholic cirrhosis |
| 20 | 30 | Female | 15 | 5 | 15 | 20 | 25 | 55.46 | Alcoholic cirrhosis |
| 21 | 34 | Male | 15 | 7 | 11 | 24 | 30 | 42.62 | Alcoholic hepatitis |
| 22 | 43 | Male | 15 | 8 | 20 | 32 | 32 | 82.72 | Alcoholic cirrhosis |
| 23 | 38 | Female | 15 | 15 | 24 | 52 | 38 | 71.5 | Alcoholic cirrhosis |
Abbreviations: APACHE, acute physiology and chronic health evaluation score; GCS, Glasgow coma scale; SAPS, simplified acute physiology score; SOFA, sequential organ failure assessment.
Table 2.
Baseline Characteristics of All Patients, Including Survivors and Patients Who Died (23 Hospitalizations)
| Variable | Value |
|---|---|
| Age, y, Mean ± SD | 38 ± 9 |
| Males, No. (%) | 17 (73.91) |
| Alcoholic hepatitis, No. (%) | 7 (30.43) |
| Hepatic encephalopathy, No. (%) | 2 (28.57) |
| Alcoholic cirrhosis, n (%) | 16 (69.57) |
| Hepatic encephalopathy, No. (%) | 5 (31.25) |
| Length of ICU stay (days), median (IQR) | |
| Total | 9 (5 - 16) |
| Patients who survived their stay in the ICU | 8.5 (4.75 - 18.25) |
| Patients who died during hospitalization in the ICU | 10 (5-18.25) |
| Length of hospital stay (days), median (IQR) | |
| Total | 28 (14 - 46) |
| Patients who survived their stay in the ICU | 28 (12.5 - 46) |
| Patients who died during hospitalization in the ICU | 28 (12.5 - 40) |
| MELD UNOS Modification score, median (IQR) | |
| Total | 32 (29 - 38) |
| Patients who survived their stay in the ICU | 32 (28.75 - 37.5) |
| Patients who died during hospitalization in the ICU | 32.5 (28.5-38.25) |
| Maddrey’s score, median (IQR) | |
| Total | 82.86 (69.37 - 105.32) |
| Patients who survived their stay in the ICU | 83.01 (66.40 - 106.94) |
| Patients who died during hospitalization in the ICU | 82.94 (66.40 - 106.94) |
| SOFA score day 1, median (IQR) | |
| Total | 9 (7 - 13) |
| Patients who survived their stay in the ICU | 9 (7-13) |
| Patients who died during hospitalization in the ICU | 9.5 (7-13.25) |
| APACHE II score, median (IQR) | |
| Total | 17 (14 - 24) |
| Patients who survived their stay in the ICU | 17 (13.75 - 22.75) |
| Patients who died during hospitalization in the ICU | 17.5 (14.75 - 24.25) |
| SAPS II score, median (IQR) | |
| Total | 32 (22 - 50) |
| Patients who survived their stay in the ICU | 31.5 (21.5 - 45.5) |
| Patients who died during hospitalization in the ICU | 33 (23.5 - 50.5) |
| GCS score, median (IQR) | |
| Total | 15 (14 - 15) |
| Patients who survived their stay in the ICU | 15 (14 - 15) |
| Patients who died during hospitalization in the ICU | 15 (14 - 15) |
Abbreviations: APACHE, acute physiology and chronic health evaluation score; GCS, Glasgow coma scale; ICU, intensive care unit; IQR, interquartile range; SAPS, simplified acute physiology score; SD, standard deviation; SOFA, sequential organ failure assessment.
None of the patients had benefitted from prior therapy comprised of alcohol abstinence, proper nutrition, a strategy for reducing the blood ammonia levels, or steroid intake that spanned several weeks. Because of a relatively recent history of alcohol consumption, none of the patients were eligible for a liver transplant.
During a total of 23 hospitalizations, the patients underwent 111 liver dialysis procedures, including 13 dialyses using the FPSA method with the Prometheus® system and 98 procedures using the SPAD system. The median (IQR) number of performed liver dialyses was 4 (3 - 6). Selected laboratory parameters were determined prior to the first and after the last dialysis for the patients with ALD who were undergoing a round of liver dialysis procedures in the A&IT Department; these parameters are listed in Table 3.
Table 3.
Selected Laboratory Parameters Determined Prior to the First and After the Last Liver Dialysis in Patients Undergoing a Round of Liver Dialysis Procedures (n = 23)
| Parameter | All Hospitalizations (n = 23) | Hospitalizations Without Patient death (n = 13) | Hospitalizations With Patient Death (n = 10) | |||
|---|---|---|---|---|---|---|
| Prior to the First Liver Dialysis | After the Last Liver Dialysis | Prior to the First Liver Dialysis | After the Last Liver Dialysis | Prior to the First Liver Dialysis | After the Last Liver Dialysis | |
| Total bilirubin, mg/dL, median (IQR) | 28.45 (21.95 - 35.80) | 18.07 (15.36 - 29.60) | 29.21 (21.30 - 35.89) | 17.92 (15.22 - 26.99) | 28.15 (21.30 - 35.89) | 18.78 (15.56 - 30.66) |
| Direct bilirubin, mg/dL, median (IQR) | 24.44 (20.47 - 29.87) | 13.33 (11.45 - 22.77) | 25.09 (19.48 - 29.90) | 13.25 (11.37 - 21.38) | 24.21 (19.48 - 29.90) | 13.38 (11.37 - 23.08) |
| Bile acids, μmol/L, median (IQR) | 93.90 (72.90 - 126.10) | 55.75 (46.35 - 81.23) | 93.55 (71.50 - 127.83) | 55.50 (44.10 - 86.15) | 93.55 (71.50 - 124.08) | 55.50 (44.10 - 86.15) |
| Ammonia, μg/dL, median (IQR) | 82 (72.5 - 127.75) | 67 (54.5 - 94) | 82 (73 - 134.5) | 69 (54 - 96) | 82 (71.5 - 134.5) | 69 (55 - 96) |
| INR, median (IQR) | 2.34 (1.93 - 2.72) | 2.31 (1.78 - 2.89) | 2.36 (1.90 - 2.74) | 2.51 (1.84 - 2.91) | 2.34 (1.90 - 2.74) | 2.10 (1.77 - 2.91) |
Abbreviations: INR, international normalized ratio; IQR, interquartile range.
The ICU, 30-day and three-month mortality rates were 43.48%, 39.13%, and 73.91%, respectively. The significant predictors of death in the ICU included the patients’ SOFA, APACHE II, SAPS II, and MELD UNOS modification scores; the duration of stay (in days) in the A&IT department; and bile acid, creatinine, and albumin levels upon ICU admission (Table 4), as determined by the ROC analysis for single-factor models. The other factors were found to be insignificant (P > 0.05).
Table 4.
Prediction of the ICU Mortality Rate Using the Analyzed Predictors: ROC Curves for Single-Factor Models
| Risk Factor | AUC (95% CI) | P |
|---|---|---|
| GCS score | 0.6577 (0.4228 - 0.8925) | 0.2036 |
| SOFA score | 0.9923 (0.9677 - 1.0000) | 0.0001 |
| APACHE II score | 0.9000 (0.7735 - 1.0000) | 0.0013 |
| SAPS II score | 0.9346 (0.8139 - 1.0000) | 0.0005 |
| MELD UNOS Modification score | 0.9192 (0.8084 - 1.0000) | 0.0007 |
| Maddrey’s score | 0.5923 (0.3445 - 0.8401) | 0.4568 |
| Length of hospital stay, days | 0.5423 (0.2970 - 0.7876) | 0.7330 |
| Length of ICU stay, days | 0.8769 (0.6973 - 1.0000) | 0.0024 |
| Total serum bilirubin on ICU admission, mg/dL | 0.5885 (0.3466 - 0.8303) | 0.4757 |
| Direct serum bilirubin on ICU admission, mg/dL | 0.5692 (0.3292 - 0.8093) | 0.5767 |
| Bile acids on ICU admission, μmol/L | 0.7615 (0.5499 - 0.9732) | 0.0350 |
| Ammonia on ICU admission, μg/dL | 0.3792 (0.1293 - 0.6290) | 0.3390 |
| INR at time of ICU admission | 0.6808 (0.4459 - 0.9157) | 0.1450 |
| Prothrombin time, s | 0.6577 (0.4155 - 0.8998) | 0.2036 |
| Creatinine, mg/dL | 0.7885 (0.5669 - 1.0000) | 0.0200 |
| Serum albumin at time of ICU admission, g/dL | 0.7846 (0.5871 - 0.9821) | 0.0218 |
Abbreviations: APACHE, acute physiology and chronic health evaluation score; AUC, area under the curve; GCS, Glasgow coma scale; ICU, intensive care unit; INR, international normalized ratio; IQR, interquartile range; MELD, model of end-stage liver disease; SAPS, simplified acute physiology score; SOFA, sequential organ failure assessment; UNOS, united network for organ sharing.
The ROC analysis indicates the significant discriminating power of the SOFA (AUC = 0.77; 95% CI = 0.56 - 0.97; P = 0.0348), APACHE II (AUC = 0.77; 95% CI = 0.57-0.96; P = 0.0348), and SAPS II (AUC = 0.76; 95% CI = 0.56 - 0.96; P = 0.0376) scores on the 30-day mortality rate. The ROC analysis also indicates the significant discriminating power of the SOFA (AUC = 0.79; 95% CI = 0.59 - 0.98; P = 0.0389), APACHE II (AUC = 0.87; 95% CI = 0.72 - 1.00; P = 0.0078), SAPS II (AUC = 0.88; 95% CI = 0.73 - 1.00; P = 0.0070), and MELD UNOS Modification (AUC=0.80; 95% CI = 0.62 - 0.98; P = 0.0327) scores on the three-month mortality rate (Figures 1-4).
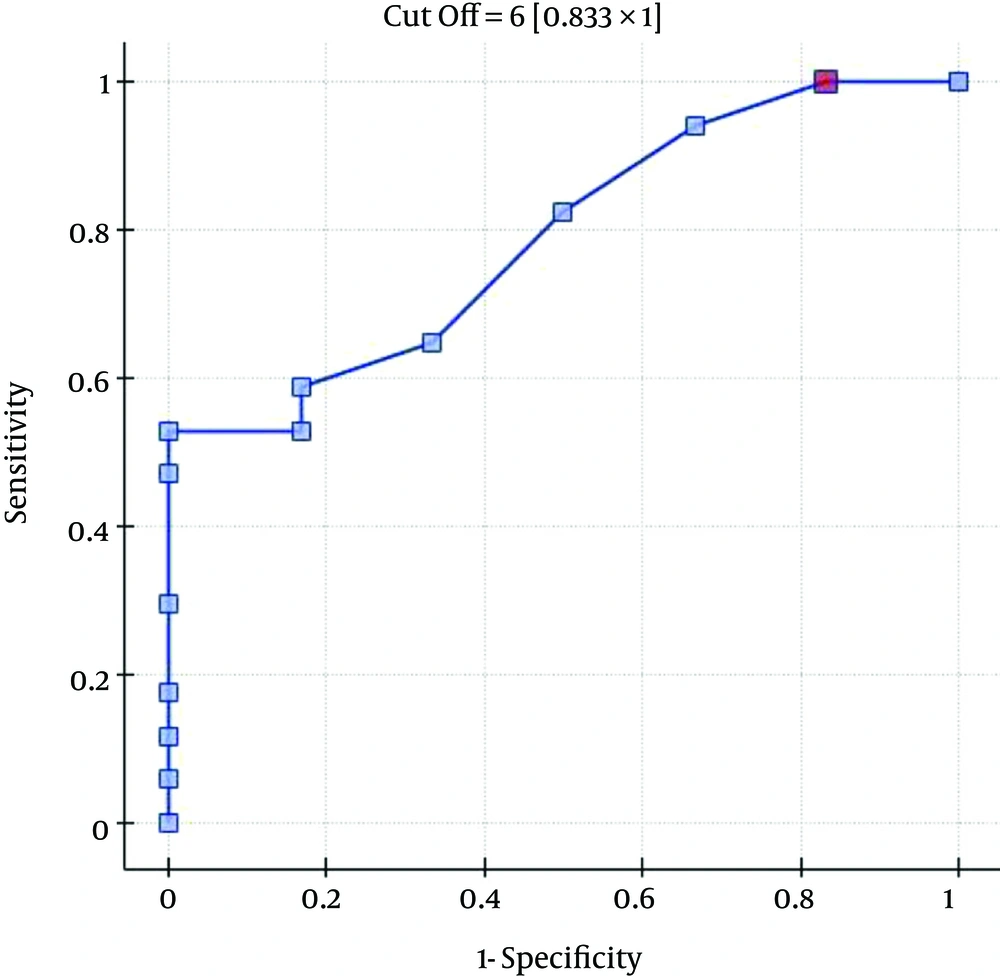
Figure 1.
ROC Curve for Predicting the Three-Month Mortality Rates Using the Patients’ SOFA Scores (Points)
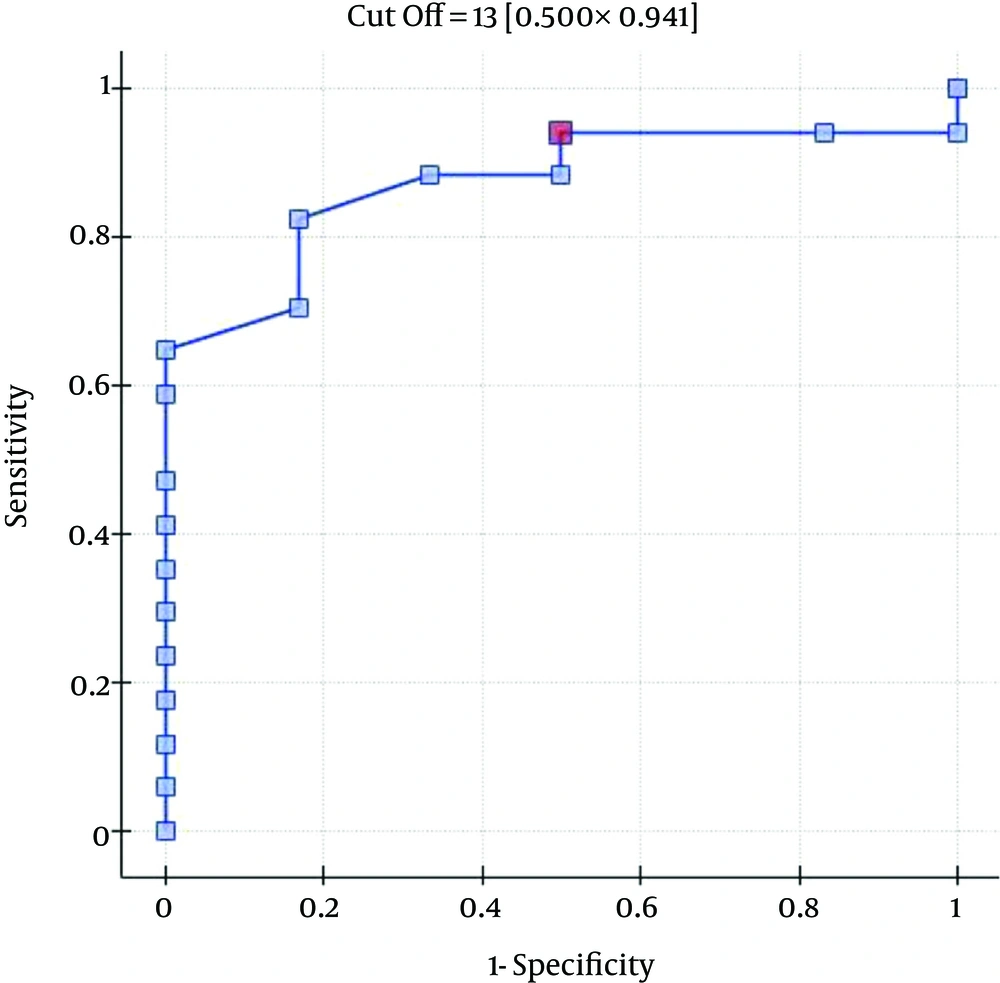
Figure 2.
ROC curve for Predicting the Three-Month Mortality Rates Using the Patients’ APACHE II Scores (Points)
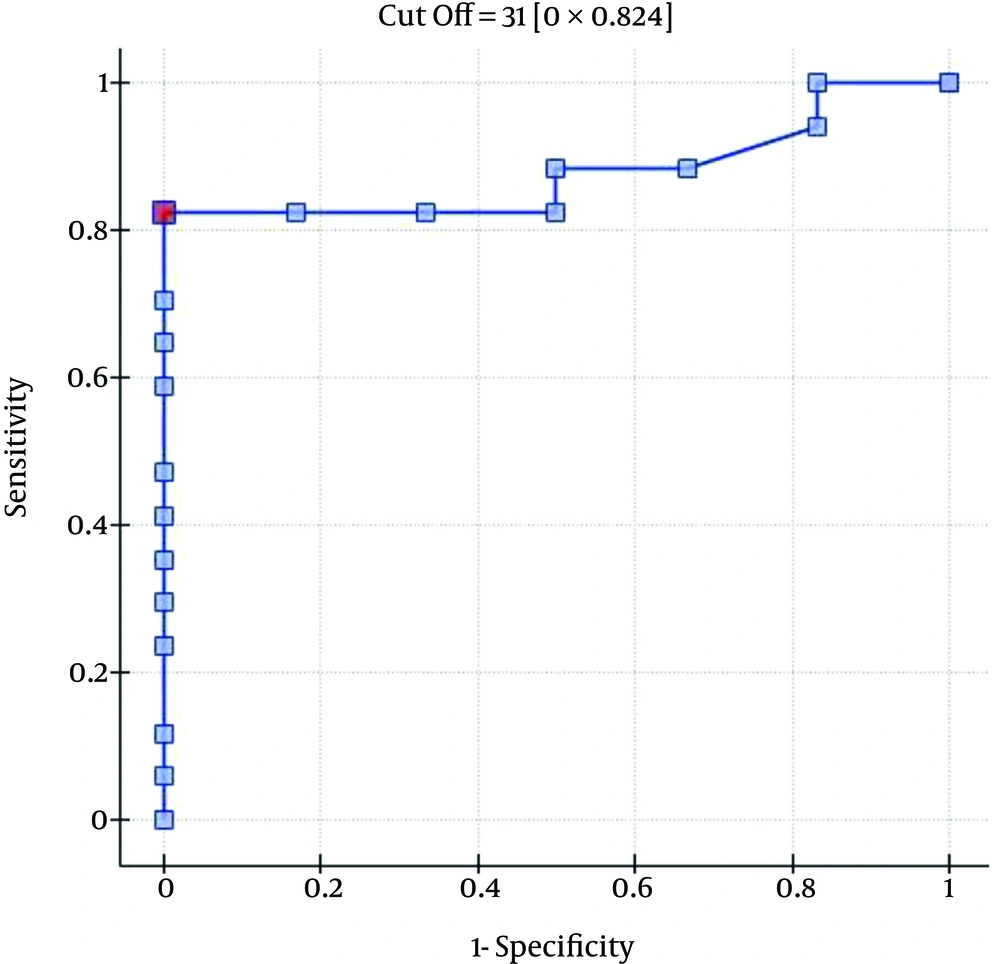
Figure 3.
ROC Curve for Predicting the Three-Month Mortality Rates Using the Patients’ SAPS II Scores (Points)
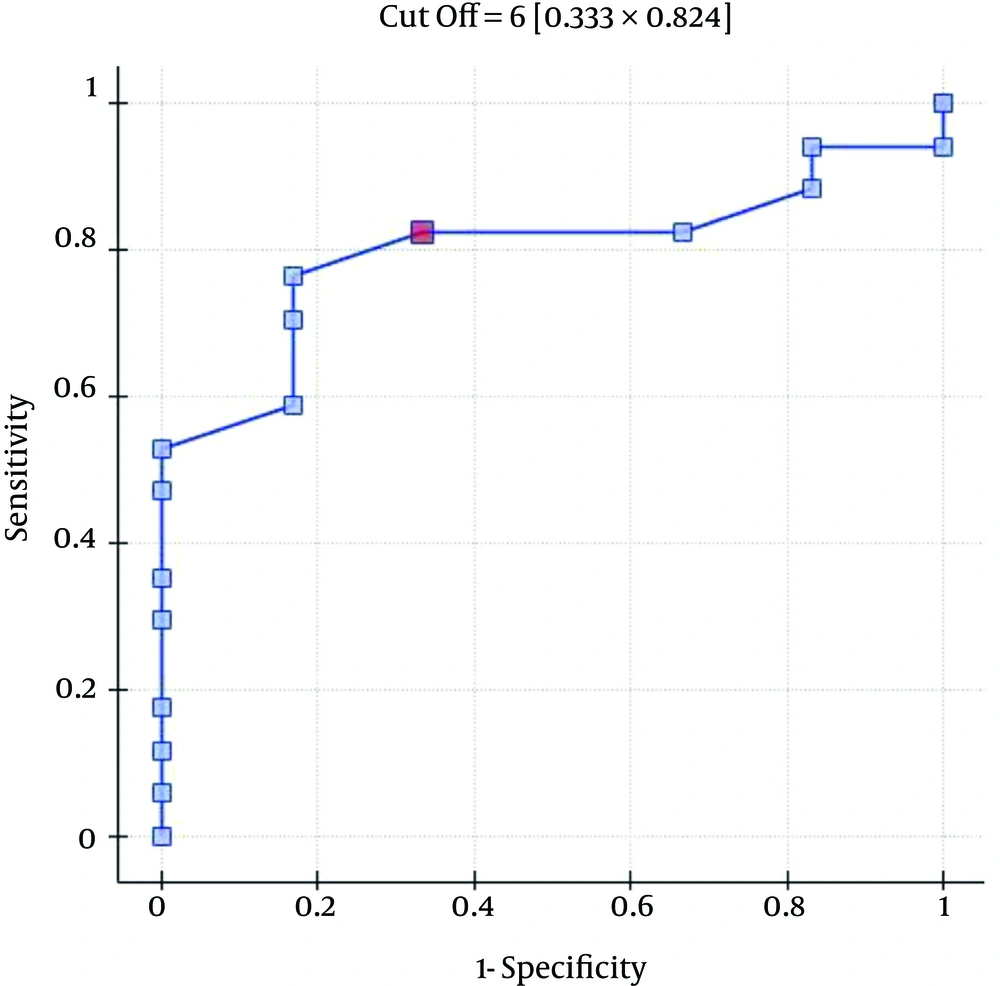
Figure 4.
ROC Curve for Predicting the Three-Month Mortality Rates Using the Patients’ MELD UNOS Modification Scores (Points)
5. Discussion
Alcohol consumption is responsible for 3.8% of global mortality and 4.6% of disability-adjusted life years because of premature death (14, 15). The burden of alcohol-related diseases is the highest in the developed world, where it may account for as much as 9.2% of all disability-adjusted life years. The available data show that the highest mean alcohol consumption is recorded in Europe (16). The attributable burden in Europe, with 6.5% of all deaths and 11.6% of all disability-adjusted life years attributed to alcohol, is the highest proportion of alcohol-related total poor health and premature death out of all world health organization regions (15, 17). Europe shows particularly large sex-related differences in this respect, with mortality rates attributable to alcohol reaching 11.0% and 1.8% for men and women, respectively. The younger population accounts for a disproportionate amount of the disease burden, with an alcohol-associated mortality of greater than 10% and 25% for female and male youth, respectively (18). There is a clear dose-dependent relationship between the amount of alcohol consumed and the likelihood of developing ALD.
The diagnosis of ALD is based on a combination of features, including a history of significant alcohol intake, clinical evidence of liver disease, and supporting laboratory abnormalities (19). The spectrum of ALD includes simple steatosis (or fatty liver), alcoholic steatohepatitis (or alcoholic hepatitis), progressive fibrosis, cirrhosis (or chronic hepatitis with hepatic fibrosis), and the development of hepatocellular cancer. Alcoholic steatosis can be found in 60% of individuals who drink > 60 g of alcohol per day (20, 21). Only a minority of the patients with steatosis progress to alcoholic steatohepatitis, and 10% - 20% eventually develop cirrhosis (22, 23). The risk of developing cirrhosis is the highest in those with a daily alcohol consumption of more than 120 g (20, 21). Genetic and non-genetic factors modify both the individual’s susceptibility and their clinical course of ALD (24).
Alcohol abuse can result in toxic liver damage. As a consequence of liver damage, a patient can develop liver failure. Currently, the only effective therapy for patients with liver failure is liver transplantation, which is a generally accepted standard of care for end-stage liver disease. The one-year survival rates approach 80 to 85%, and late graft loss from chronic rejection is uncommon (25). ALD is one of the most common indications for liver transplants in Europe and the United States (1). Early liver transplantation can improve the survival of patients with a first episode of severe alcoholic hepatitis who do not respond to medical therapy (26, 27). Liver transplantation represents the ultimate therapy for patients with alcoholic cirrhosis, with most transplant centers mandating a six-month period of abstinence from alcohol before the patient can be placed on the transplant list. Recurrent ALD alone is not an important cause of graft pathology or failure (28). However, the number of patients with severe liver failure secondary to ALD who undergo liver transplant procedures is relatively small.
If an ALD patient with severe liver dysfunction is not eligible for liver transplant for various reasons, and if conservative treatment is not effective, extracorporeal liver support may be the only feasible therapeutic alternative.
In the center in which this study was conducted, albumin dialysis treatment is provided to patients with severe liver dysfunction secondary to ALD after a previously unsuccessful attempt at conservative treatment. The basic criteria for eligibility for the procedure are hepatic encephalopathy (grade 2 or higher) and/or a total blood bilirubin level above 15 mg mg/dL. If a patient is eligible for the albumin dialysis treatment, a round of liver dialysis procedures is performed. In the process, the subsidence of encephalopathy (if present prior to the dialyses) is assessed, and the total bilirubin, direct bilirubin, bile acid, and ammonia levels are monitored. A decrease in the total bilirubin levels below 12 - 15 mg/dL, along with the subsidence of encephalopathy (if present prior to the dialyses) is an indication of the need to suspend or discontinue the albumin dialysis therapy. Upon completing their respective rounds of albumin dialysis procedures in this study, the patients were transferred back to their original hospital departments to continue conservative therapy if their clinical condition allowed for it.
ALD patients are at an increased risk of mortality at every stage of the disease. Patients with alcoholic fatty liver disease have shown a markedly higher risk of liver-related death compared to the general population (29, 30). The prognosis of alcoholic hepatitis is variable, with nearly 100% survival in mild cases compared to a relatively high short-term mortality rate among the most severe cases. The severity of alcoholic hepatitis is conventionally defined by Maddrey’s discriminant function. A value of 32 or higher indicates severe alcoholic hepatitis with an adverse prognosis, including a mortality rate of 20% to 30% within one month of presentation (31). Patients with severe ALD whose hepatitis is not responding to medical therapy have a six-month survival rate of approximately 30%. Most alcoholic hepatitis deaths occur within two months (26). The mortality of patients with alcoholic cirrhosis is also extremely high; the five-year mortality rate in patients ranges from 58% to 85% (32, 33). In hospitalized ALD patients with deep jaundice, hepatic encephalopathy, and a low prothrombin index, mortality rates can reach 50% - 75% (1-3). The main causes of death in ALD patients have been reported as variceal bleeding, liver failure, and hepatorenal syndrome or sepsis.
Based on the degree of liver dysfunction assessed using the MELD UNOS Modification scoring system (median score: 32) and Maddrey’s score (median score: 82.86), the mortality rates recorded in the present study are promising. If it had not been for their disqualifying history of alcohol intake, most of the patients would have probably been listed for an emergency liver transplant. However, we believe that further studies are required in this area.
Various scoring systems have been developed with the goal of identifying patients with ALD who are at a high risk for mortality. However, all of the current scoring systems for the evaluation of ALD severity have limitations. In practice, the most commonly used scoring systems include the model for end-stage liver disease, which was initially created to predict survival in patients with complications of portal hypertension who were undergoing elective placement of transjugular intrahepatic portosystemic shunts (1, 34-41), and Maddrey’s score. In several studies that compared the MELD score to Maddrey’s score (31), the MELD score was a more accurate predictor of mortality (42-44). This finding was also corroborated by our results.
In the present study, the SOFA, APACHE II, and SAPS II scores were shown to be better predictors of death than the MELD UNOS Modification score, the latter of which is dedicated to the assessment of patients with liver disease. Maddrey’s score was impractical for the purposes of this study, which is not surprising because it is only able to predict outcomes in patients suffering from alcoholic hepatitis. These patients accounted for only 30.43% of the participants in our study.
One of the most important factors that determines the outcome of the extracorporeal liver support procedures may be appropriate patient selection. This is because a significant majority of patients with severe liver dysfunction accompanied by failure of several additional organs have a poor prognosis, regardless of whether extracorporeal liver support is provided. In the study by Sheth et al. (44), MELD scores higher than 11 were associated with a high mortality rate in hospitalized patients with alcoholic hepatitis. The cut-off of the MELD score for determining severe alcoholic hepatitis is > 21, which has been associated with a three-month mortality rate of 20%; whereas patients with a MELD score ≤ 11 tend to have excellent survival rates (43). Taking into account the cut-off point on the ROC curve when predicting the three-month mortality for the MELD UNOS Modification scoring system, the group that may benefit the most from extracorporeal liver support includes patients with severe liver dysfunction secondary to ALD (those not responding to standard treatment) who have a MELD UNOS modification score of 18 - 30. Although it is inferior to the SOFA, APACHE II, or SAPS II scores in terms of its ability to predict mortality, the MELD UNOS modification score has its advantages, one being that it is rather uncomplicated and can be easily employed in almost every hospital department that admits patients with liver dysfunction secondary to ALD. In our view, it can be recommended for use in hospital units other than the ICU as a scoring system to identify patients with severe liver dysfunction secondary to ALD (or those failing to respond to the standard treatment) who may benefit from extracorporeal liver support procedures. In ICUs, however, a more detailed identification of these patients is possible by means of the SOFA, APACHE II, and SAPS scores. Considering the ROC curve cut-off point for the SOFA, APACHE II, and SAPS scoring systems, patients with severe liver dysfunction secondary to ALD (those not responding to the standard treatment) with scores that do not exceed the SOFA, APACHE II, or SAPS scores of 6, 13, and 31, respectively, may receive the greatest benefit from extracorporeal liver support procedures.
Our study suggests that artificial extracorporeal liver support systems are an appropriate life support option in patients with severe liver dysfunction over the course of ALD. However, in our view, the existing possibilities for albumin dialysis treatments in ALD patients with severe liver dysfunction are not sufficiently utilized. An earlier transfer of patients who fail to respond to standard therapy to hospital units with the appropriate medical equipment and devices for performing albumin dialysis may be the only therapeutic alternative and an effective means of improving the general prognosis in this patient group (45).
5.1. Conclusions
The MELD UNOS modification scoring system can be effectively used to identify patients with severe liver dysfunction secondary to ALD who can benefit from extracorporeal liver support procedures. However, in an ICU setting, the mortality of patients with ALD is more accurately predicted by the scoring systems developed for intensive care than by the systems designed specifically for liver disease. Finally, the significant predictors of death in the ICU were the patients’ SOFA, APACHE II, SAPS II, and MELD UNOS modification scores; the duration of stay (in days) in the A&IT department; and bile acid, creatinine, and albumin levels upon ICU admission. The application of extracorporeal liver support techniques in patients with severe liver dysfunction secondary to ALD appears to have been justified in the subset of patients achieving a MELD UNOS Modification score of 18 - 30. However, further studies should be conducted in this area.