1. Background
Processes, including metabolism, detoxification, and redox processes, are vital for sustaining life (1). A condition of great severity arises when this organ, already worn down by years of chronic disease, can no longer effectively shoulder its responsibilities. This is acute-on-chronic liver failure (ACLF), a medical emergency with grave consequences and a prognosis that is often unfavorable. Once diagnosed with ACLF, approximately 47.5% of patients require a liver transplant for treatment (2). This critical condition not only affects individuals already diagnosed with chronic liver disease but also surprisingly presents itself for the first time as acute liver failure in some cases (3). The diagnosis of ACLF is established when there is a failure in both the liver and one or more extrahepatic organs, thereby highlighting the systemic nature of the problem. Often accompanying this liver failure is a breakdown in one or more extrahepatic organs, with acute kidney injury (AKI) being a frequent and severe consequence with a very poor prognosis (4). As a therapeutic intervention, plasma exchange (PE), an extracorporeal treatment that removes and replaces plasma, stands out as a rapid and effective method for reducing bilirubin levels, a key biomarker in ACLF (5). The field of critical care medicine has advanced at an accelerated pace, and renal replacement therapy, which involves the use of artificial kidney machines, has become refined and is now widely used in clinical settings. Among the various modalities of renal replacement therapy, continuous renal replacement therapy (CRRT) stands out as a key treatment technique. It is frequently employed for critically ill patients who are in shock, battling endotoxemia, facing issues with sodium and water retention, and acid-base imbalances, among other serious complications (6). The combined treatment, especially with CRRT, for patients suffering from ACLF and AKI remains a subject of intense clinical debate due to its controversial efficacy. Each of these facets of the condition speaks to the complexity of managing ACLF, underscoring the need for continued research and clinical attention.
2. Objectives
The objective of this study was to assess the prognosis of patients diagnosed with acute-on-chronic liver failure (ACLF) complicated by acute kidney injury (ACLF-AKI) who underwent PE and were treated with CRRT.
3. Methods
3.1. Research Object
A retrospective analysis of clinical data from August 2015 to August 2018 was conducted for patients with ACLF combined with AKI in the Department of Infectious Diseases/Liver Disease ICU. Patients were divided into three groups based on blood purification techniques during hospitalization: Group A (medication only), group B (PE), and group C (PE combined with CRRT). A total of 198 ACLF-AKI patients were included, with 68 in Group A, 56 in group B, and 74 in group C.
3.2. Inclusion Criteria
The ACLF was defined as an increase in serum bilirubin above 12 mg/dL and an INR above 1.5 in patients with chronic liver diseases. The inclusion criteria adhered to the APASL clinical practice guidelines (7). The AKI staging diagnosis complied with the kidney disease improving global outcomes (KDIGO) criteria. The kidney criteria for organ function failure include a serum creatinine (sCr) level ≥ 2 mg/dL or treatment with hemodialysis (2, 8). Patients with hospital stays of less than 24 hours and those with malignant tumors were excluded.
3.3. Exclusion Criteria
3.3.1. Pre-existing Chronic Kidney Disease
Complicates AKI diagnosis, including CKD Stages 3b-5 and structural kidney diseases.
3.3.2. Non-hepatic Etiologies of Acute Kidney Injury
Clear alternative causes of AKI, including recent (within 7 days) exposure to nephrotoxic agents, documented urinary tract obstruction, and glomerular diseases (active urinary sediment or proteinuria > 1 g/day without typical cirrhotic features).
3.3.3. Severe Comorbidities Affecting Prognosis
End-stage conditions such as advanced malignancies (excluding HCC), AIDS-defining illnesses, and major cardiopulmonary failure.
3.3.4. Data Quality Issues
Missing critical data such as baseline creatinine, incomplete ACLF diagnostic parameters, and insufficient follow-up (e.g., death within 24 hours of admission, preventing renal outcome assessment).
3.4. Observation Indicators
Upon admission, clinical data were collected, including gender, age, and biochemical indicators before and after blood purification treatment during hospitalization. These indicators included total bilirubin (TBil), serum albumin (Alb), sCr, serum sodium (Na), international normalized ratio (INR), white blood cells (WBC), platelets (PLT), hematocrit (Hct), and arterial blood lactate (Lac). Common complications and blood purification treatment methods (medication alone, PE, or PE + CRRT) were also recorded.
The creatinine clearance rate (Ccr) was measured from 24-hour urine collections, with incomplete samples excluded if urine volume was < 500 mL or collection time was < 22 hours. The glomerular filtration rate (eGFR) was calculated using the CKD-EPI 2021 equation for sCr measured via enzymatic assay. The MELD-Na score was calculated using the United Network for Organ Sharing (UNOS) formula.
were calculated before and after treatment. The primary clinical endpoints were death during hospitalization, automatic discharge and abandonment of medical treatment, and ineffective internal medicine treatment leading to liver transplantation.
3.5. Statistical Methods
The SPSS 21.0 software was utilized for data analysis. Measurement data that were normally distributed were expressed as the mean ± standard deviation (χ̅ ± s), and the LSD-t-test was employed for comparisons. Non-normally distributed measurement data were expressed as the median and quartile range [M (Q25, Q75)], and the Kruskal-Wallis test was utilized for comparisons. Categorical variables were presented as numbers (percentages, %), and the chi-square test was used for comparisons of count data among the three groups. The Cox proportional hazards regression model was utilized for a multifactorial survival analysis to determine the influencing factors on survival time at 90 days. A P-value of < 0.05 indicated statistical significance.
4. Results
4.1. General Information
As shown in Table 1, a total of 198 patients, all suffering from AKI, were enrolled in this research study, with 68 allocated to group A, 56 to group B, and 74 to group C. No significant differences were observed in various parameters among the three groups, with all P-values > 0.05, indicating a lack of statistically significant differences.
Table 1.
Baseline of 198 Patients with HBV-Acute-on-Chronic Liver Failure Complicated by Acute Kidney Injury a
| Parameters | Group A (68) | Group B (56) | Group C (74) | Statistic | P-Value |
|---|---|---|---|---|---|
| Gender | 0.46 | 0.80 | |||
| Male | 46 | 41 | 52 | ||
| Female | 22 | 15 | 22 | ||
| Age (y); mean ± SD | 51.9 ± 14.32 | 55.33 ± 13.71 | 53.31 ± 13.58 | 0.41 | 0.67 |
| WBC (× 109/L) | 9.15 (8.58, 12.70) | 10.29 (7.92, 12.08) | 10.75 (9.33, 13.38) | 3.37 | 0.19 |
| PLT (× 109/L) | 61 (48, 115) | 84 (51, 143) | 65 (48, 132) | 1.31 | 0.52 |
| Hct (%) | 0.31 (0.24, 0.36) | 0.31 (0.26, 0.36) | 0.33 (0.27, 0.39) | 2.35 | 0.31 |
| TBil (mg/uL) | 19.53 (15.14, 23.10) | 22.63 (17.83, 26.49) | 19.86 (15.49, 24.32) | 3.42 | 0.18 |
| sCr (mg/uL) | 1.53 (1.13, 2.07) | 1.48 (1.17, 1.92) | 1.65 (1.28, 2.37) | 3.53 | 0.17 |
| Alb (g/L) | 28.87 (26.95, 32.23) | 30.20 (28.40, 33.30) | 29.30 (27.15, 34.20) | 2.57 | 0.28 |
| INR | 2.65 (2.06, 3.45) | 2.39 (2.02, 2.86) | 2.95 (2.07, 3.12) | 4.71 | 0.10 |
| MELD-Na (score); mean ± SD | 33.18 ± 6.86 | 31.32 ± 6.56 | 34.32 ± 7.34 | 0.96 | 0.39 |
| eGFR (mL/min) | 47.26 (35.14, 66.65) | 63.07 (45.77, 77.89) | 43.17 (22.02, 61.42) | 4.59 | 0.10 |
| Ccr (mL/1.73 m2) | 46.79 (31.52, 76.74) | 54.13 (44.69, 60.79) | 52.06 (22.02, 61.42) | 3.96 | 0.14 |
| Complication (%) | |||||
| Diabetic | 16.18 | 17.86 | 18.92 | 0.14 | 0.93 |
| Cardiovascular disease | 25.00 | 19.65 | 24.32 | 0.55 | 0.76 |
| Chronic lung disease | 16.18 | 23.21 | 13.51 | 0.69 | 0.43 |
Abbreviations: ACLF-AKI, acute-on-chronic liver failure complicated by acute kidney injury; WBC, white blood cell; PLT, platelet; Hct, hematocrit; TBil, total bilirubin; sCr, serum creatinine; Alb, serum albumin; INR, international normalized ratio; MELD-Na, the combined formula of serum sodium and model for end-stage liver disease; eGFR, glomerular filtration rate; Ccr, creatinine clearance.
a Values are expressed as median and quartile range [M (Q25, Q75)] unless otherwise indicated.
4.2. Results of Glomerular Filtration Rate, Creatinine Clearance Rate, and MELD-Na Scores Before and After Blood Purification Treatment in the Three Groups
The results indicate that there was no statistically significant difference in Group A. However, both Group B and Group C effectively lowered eGFR, Ccr, and MELD-Na scores in ACLF patients with AKI, both before and after treatment (P < 0.05). There were no significant differences in eGFR, Ccr levels, and MELD-Na scores between the two groups, PE and CRRT combined, after blood purification treatment (P > 0.05) (Table 2).
Table 2.
Results of Glomerular Filtration Rate, Creatinine Clearance Rate and MELD-Na Scores in Three Groups
| Groups and Timing | eGFR | Ccr | MELD-Na |
|---|---|---|---|
| A (n = 68) | |||
| Pre-therapy | 47.26 (35.14, 66.65) | 46.79 (31.52, 76.74) | 33.18 ± 6.68 |
| Post-treatment | 52.12 (45.45, 66.99) | 54.71 (43.18, 77.22) | 27.98 ± 3.83 |
| Z/t | Z = -1.71 | Z = -0.61 | t = 0.73 |
| P | 0.16 | 0.54 | 0.47 |
| B (n = 56) | |||
| Pre-therapy | 56.77 (45.77, 64.98) | 54.13 (44.69, 60.79) | 31.32 ± 6.56 |
| Post-treatment | 80.86 (41.40, 102.98) a | 77.73 (47.37, 98.05) b | 20.35 ± 5.08 c |
| Z/t | Z = -2.81 | Z = -3.67 | t = -6.07 |
| P | 0.01 | 0.00 | 0.00 |
| C (n = 74) | |||
| Pre-therapy | 50.52 (30.77, 68.53) | 52.06 (22.02, 61.42) | 34.32 ± 7.34 |
| Post-treatment | 73.56 (40.70, 90.78) a | 80.46 (56.46, 112.88) b | 19.99 ± 4.87 c |
| Z/t | Z = -5.81 | Z = 0.774 | t = -6.90 |
| P | 0.00 | 0.00 | 0.00 |
Abbreviations: eGFR, glomerular filtration rate; Ccr, creatinine clearance rate; MELD-Na, the combined formula of serum sodium and model for end-stage liver disease.
a P = 0.31 between group B and C after treatment.
b P = 0.76 between group B and C after treatment.
c P = 0.82 between group B and C after treatment.
4.3. Survival COX Proportional Hazard Regression Model Analysis
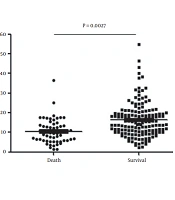
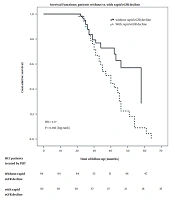
Utilizing the robust COX proportional hazards regression model, we identified three significant factors that played a substantial role in determining the survival index of our patient cohort: The eGFR, Ccr levels, and MELD-Na scores after undergoing blood purification treatment. Moreover, survival analysis revealed a worrisome correlation: Patients with lower survival rates bore a higher mortality risk, as evidenced by Figures 1 and 2. These findings, backed by rigorous statistical analysis (Table 3) (P < 0.05), offer invaluable insights into the complex dynamics of ACLF-AKI patient survival and could potentially guide future clinical practices and treatment strategies.
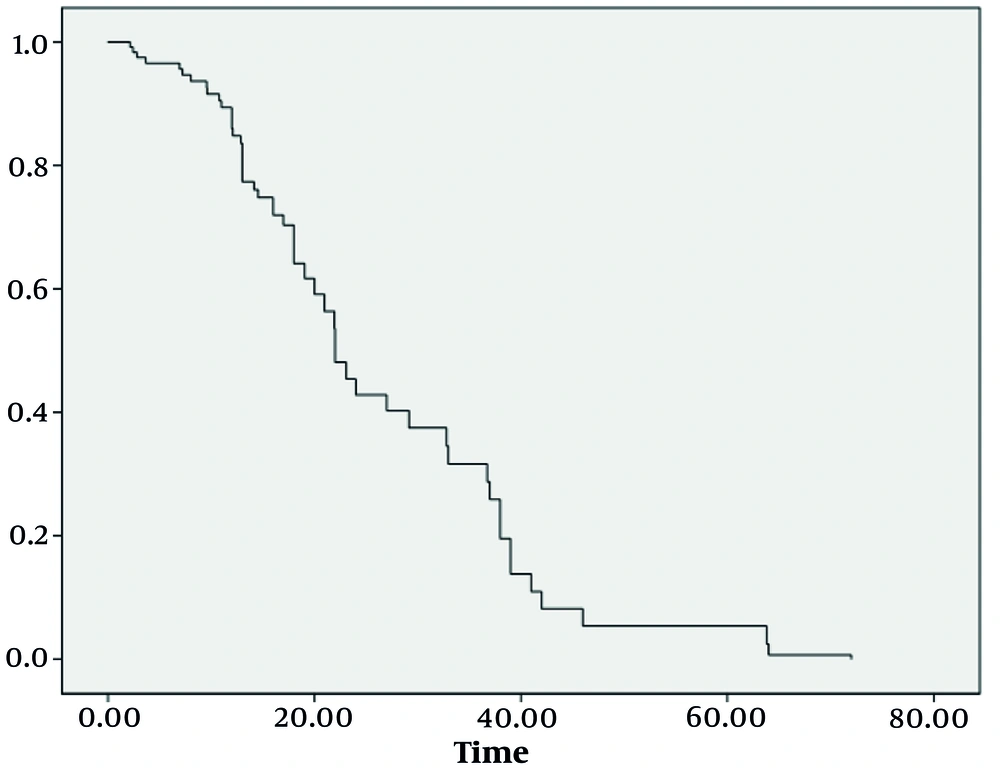
Figure 1.
Mortality hazard function
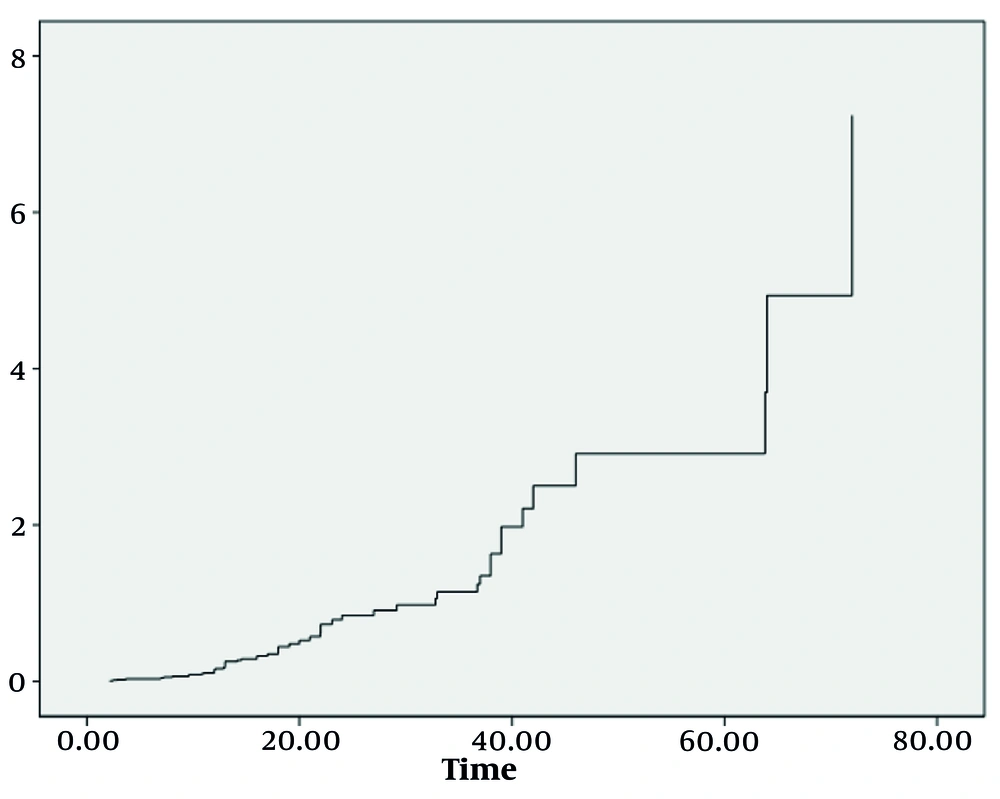
Figure 2.
Cumulative hazard function
Table 3.
Survival COX Proportional Hazards Regression Model Analysis
| Index | Β | SE | Statistic | P-Value | Exp (β) |
|---|---|---|---|---|---|
| Sex | 0.246 | 0.413 | 0.355 | 0.551 | 1.279 |
| Age | -0.027 | 0.017 | 2.618 | 0.106 | 0.973 |
| TBil | -0.002 | 0.003 | 0.819 | 0.365 | 0.998 |
| WBC | 0.016 | 0.036 | 0.194 | 0.660 | 1.016 |
| Plt | 0.000 | 0.004 | 0.002 | 0.967 | 1.000 |
| Hct | 1.010 | 1.497 | 0.455 | 0.500 | 2.746 |
| INR | -0.030 | 0.265 | 0.013 | 0.909 | 0.970 |
| ALB | -0.012 | 0.008 | 2.002 | 0.157 | 1.012 |
| Per-eGFR a | -0.003 | 0.013 | 0.052 | 0.820 | 0.997 |
| Post-eGFR2 a | -0.091 | 0.040 | 5.338 | 0.021 | 0.913 |
| Per-Ccr a | 0.000 | 0.003 | 0.038 | 0.846 | 0.999 |
| Post-Ccr a | -0.008 | 0.003 | 7.121 | 0.008 | 0.992 |
| Bef-MELD-Na | -0.012 | 0.082 | 0.022 | 0.882 | 0.988 |
| Aft-MELD-Na | 0.216 | 0.053 | 16.707 | 0.000 | 1.241 |
Abbreviations: WBC, white blood cell; PLT, platelet; Hct, hematocrit; TBil, total bilirubin; Alb, serum albumin; INR, international normalized ratio; Ccr, creatinine clearance rate; eGFR, glomerular filtration rate; MELD-Na, the combination formula of serum sodium and model for end-stage liver disease.
a Per- means before blood purification treatment; post- meas after blood purification treatment.
5. Discussion
Acute-on-chronic liver failure is a syndrome of acute decompensation on a background of chronic liver disease, distinct from either chronic liver disease or decompensated cirrhosis, and is often characterized by acute extrahepatic organ failure and high short-term mortality (7). The AKI is a common complication in ACLF patients, manifested as a rapid decline in glomerular filtration rate (GFR), rapid increase in sCr, and blood urea nitrogen, often accompanied by water and sodium retention (8). The combination of ACLF and AKI indicates a poor prognosis and a higher risk of multi-organ failure. It is reported that 22.8 - 34% of patients with ACLF experience AKI (7), and it occurs in 50% of patients hospitalized with ACLF — often as a consequence of a precipitating event, such as infection or hemorrhage (9, 10). In liver failure patients, a large amount of medium and small molecule toxins, inflammatory mediators, and harmful substances accumulate in the body, damaging remaining liver cells and affecting liver cell regeneration, forming a vicious cycle (11). Blood purification therapy can play a certain role in improving liver function (12). Plasma exchange can adsorb toxic molecules in plasma and reduce the damage of toxic molecules to organs such as the liver and kidneys (13). However, different treatment methods have their own characteristics and advantages. The CRRT has a high clearance rate for medium and small molecular solutes, improves hemodynamics, stabilizes the internal environment, and regulates electrolyte and acid-base disorders (12). The PE has a strong ability to remove large molecules and protein-bound toxic substances (13). Some studies have suggested that the combination of the two can complement each other and improve efficacy, but there is also controversy. The KDIGO guidelines, developed globally and founded on the RIFLE and AKIN criteria, use sCr and urine output as major indicators (8).
This study retrospectively analyzed 198 patients with ACLF and AKI admitted to the Infectious Disease Department of the First Affiliated Hospital of Soochow University. The patients were divided into three groups: Group A (n = 68), group B (n = 56), and group C (n = 74). The results showed no significant differences in the various indicators among the three groups upon admission (P > 0.05). With different treatment methods, the eGFR and sCr levels of groups B and C showed significant changes, and the MELD-Na score decreased significantly compared to before treatment, indicating that PE combined with CRRT treatment can rapidly improve renal function in ACLF-AKI patients in the short term, consistent with previous reports (14, 15). Further analysis revealed no significant statistical differences in eGFR and sCr results between groups B and C after blood purification treatment (P > 0.05). Extracorporeal liver support has been widely utilized to temporarily replace the liver's metabolic and excretory functions, improve biochemical indicators, stabilize the patient's condition, and create conditions conducive to native liver regeneration, thereby prolonging the survival time of patients with mid-to-late-stage liver failure (15). However, there are few cases of ACLF combined with AKI. Some studies have shown that patients do not necessarily benefit from artificial liver therapy (16), as reflected in this study. The study found that the hospital mortality rate of groups B and C did not decrease significantly compared to group A, and there was no significant difference in MELD-Na between groups B and C after blood purification treatment. As the length of hospital stay increased, the risk of death gradually increased. The MELD score assesses liver function reserve and prognosis in patients with chronic liver disease based on sCr, INR, and TBil, and predicts mortality rates in patients with end-stage liver disease (17, 18).
However, the MELD score has its own shortcomings, and studies have shown that the MELD score combined with sCr is more predictive and a potentially reliable tool for predicting the mortality rate of acute kidney injury in patients with liver cirrhosis (19, 20). If the patient's MELD score improves after two weeks of treatment, the prognosis is relatively good; conversely, if the score worsens or shows little improvement, the patient's prognosis is poor, and liver transplantation should be considered (20). Based on the study results, PE combined with or without CRRT treatment can reduce the risk of AKI in ACLF patients in the short term and rapidly alleviate renal damage, but PE combined with CRRT treatment does not have an advantage in improving acute kidney injury. Kidneys are among the most commonly affected extrahepatic organs in ACLF patients, as AKI is reported in 22.8 - 34% of such patients (7). The AKI is a common complication in patients with ACLF and can cause structural kidney damage, leading to a poorer prognosis (7, 21). In this study, ACLF-AKI patients had a very poor prognosis. The Cox proportional hazards regression analysis found that the non-recovery rate of patients was not associated with pre-treatment biochemical indicators, eGFR, Ccr, and MELD-Na scores, but was statistically different from post-treatment eGFR, Ccr levels, and MELD-Na scores (P < 0.05). The mechanism of AKI is complex, involving both structural and functional renal impairment. The ACLF-AKI can present as acute tubular necrosis, which has a poorer prognosis (21, 22). The incidence of AKI in ACLF patients is high and directly correlates with the short- and medium-term prognosis of patients. Studies have shown that if AKI does not improve continuously, the prognosis worsens, and further intervention measures should be considered (23). Therefore, it is hypothesized that early and effective reduction of renal function damage can significantly improve patient prognosis (21, 24, 25). The rapid development of the ICU has led to increased use of blood purification therapy. Artificial liver, a traditional treatment for liver failure, can rapidly reduce toxic molecules in plasma (26). The CRRT is widely used in critical patients to prevent electrolyte disorders and endotoxemia (27). The fundamental method to save ACLF-AKI patients is liver transplantation (28). Acute kidney injury is common in liver failure patients and is associated with poor prognosis. Prediction scores and easily measurable values at admission can help stratify patients for prevention, monitoring, and early intervention, ultimately improving outcomes (28).
5.1. Conclusions
Plasma exchange and CRRT can significantly improve renal damage in ACLF-AKI patients; however, combined treatment does not offer an advantage compared to PE alone. The improvement of renal function after purification treatments directly affects the prognosis of ACLF-AKI patients, and the risk of death and accumulated risk gradually increase with the extension of hospitalization.