
1. Background
Liver transplantation is an established therapeutic option for patients with end-stage chronic liver disease (1-4). Despite the development and improvement of immunosuppressive regimens and surgical techniques in the last decades, acute rejection (AR) still remains of fundamental problems in 10% - 20% of liver transplant (LT) patients and it is more common in the first few weeks post-transplantation. AR episodes are distinguished in 34% to 70% of patients, and 5% to 20% of patients will result in chronic rejection (CR), which is usually irreversible and needs re-transplantation (5-9). Currently, liver biopsy is a widely used gold standard for the examination of the rejection in liver transplant patients. Nevertheless, being invasive, difficult, and costly on one hand and accompanying by significant morbidity and low mortality on the other hand are the drawbacks of this method. Thus, presenting a non-invasive, accurate, simple, and inexpensive method for detecting AR following LT can be a useful adjunct (6, 10-12). Recent studies have shown that artificial neural network (ANN) analysis is potentially more reliable than traditional statistical models are in predicting clinical outcomes (10, 12, 13). The authority of ANN is being generic in structure, being able to learn from historical data (14). Interestingly, ANNs are computer systems inspired by human neural physiology that comprise a set of highly interconnected processing units (neurons) tied with weighted connections, and contain an input layer, an output layer, and one or more hidden layers. The input and output layers are formed by different data available for the analysis (e.g., various laboratory tests) and different outcomes, respectively (15). Learning through examples is one of the main features of ANN, which is achieved through exposure to paired input–output data (training). ANN learns to associate each of the inputs with the corresponding output by adjusting the weights of the connections between its neurons. Based on the knowledge collected during training, ANN assigns outputs to new inputs. As a result, once trained, the ANN can recognize patterns or make predictions on those data that are not selected for training or are unknown to the ANN (12, 16). ANNs as a data-modeling method have been studied in different areas of medical applications (3, 13, 14, 17-20). In the transplantation field, the use of ANNs has been considered in the prediction of fibrosis in hepatitis C virus infected liver transplant recipients (12), prediction of outcomes after liver transplantation (21), and prediction of graft failure (22). Hence, liver transplantation is a field that would largely benefit from such models. The present cross-sectional study was performed to assess the ability of ANN to predict AR in liver transplant recipients using clinical and biochemical data of the patients, and to find the most impressive post-transplantation day in terms of prediction of AR to create an ANN model for future studies.
2. Methods
2.1. Patients
Clinical and biochemical data were collected for 3rd, 7th, and 14th days post-transplantation from 210 patients transplanted between 2009 and 2015, of which 150 were non-rejection and 60 were acute rejection patients. Acute rejection was diagnosed histologically according to the established criteria (23). This study was conducted at Namazi Hospital affiliated to Shiraz University of Medical Sciences. Patients with missing data were excluded from the study. Therefore, finally a total of 148 patients were included on days 3, 7, and 14. The patients were randomly divided into two groups for each three days. The first group included the data of 24 acute rejection patients and 78 non-rejection patients. This group was used to develop trained ANN and LR models. The second group, comprising the rest of acute rejection patients (10 persons) and non-rejection patients (36 persons), was used to test the models.
2.2. Development of the Artificial Neural Networks
The neural network was developed using Python programming language V3.5.2 (https://www.python.org/) in Linux Ubuntu 16.04 LTS (https://www.ubuntu.com/) to predict acute rejection in liver transplant recipients. A feed-forward artificial neural network (FFANN) topology, also known as multilayer perceptron (MLP), was used with back propagation (BP) algorithm to build the predictive models. MLP is a neural network that has at least three layers of neurons: one input layer, one output layer, and at least one hidden layer. Neurons are tied together with weighted connections. The weighted output is then passed through a transfer function (3, 15, 24). In this study, the default transfer functions for hidden layers and output layer were tansig and purelin, respectively. Furthermore, of the 21 input variables, the following seven statistically significant variables retained for constructing ANN models: aspartate aminotransferase (IU/L), alanine aminotransferase (IU/l), alkaline phosphatase (IU/L), total serum bilirubin (mg/dL), direct serum bilirubin (mg/dL), total serum protein (g/dL), and serum calcium (mg/dL). We found one hidden layer with 10 neurons and two output neurons (rejection and non-rejection) (Figure 1). We preprocessed the input and target values: mapping them into the interval [−1, 1]. This simplifies the challenge for the network. It also ensures that targets fall into the range that your new feed-forward network can reproduce. Over-fitting is one major challenge of neural networks, meaning generating networks that are too closely adapted to the training data. One way to overcome this obstacle is to randomly apportion the data into a training set and a validation set as described above and to test the network response to validation set. In our study, the network performed accurate response to the validation set (testing set). Thus, it could be claimed that over-fitting has not happened in the training phase. The ANN was trained 10 times with 7-fold cross validation. At the end of each training session, the network was tested and the accuracy of prediction was calculated on a test group of 46 patients who were not chosen for training and whose outcome was unknown to the ANN. Then, the best network in terms of accuracy was selected.
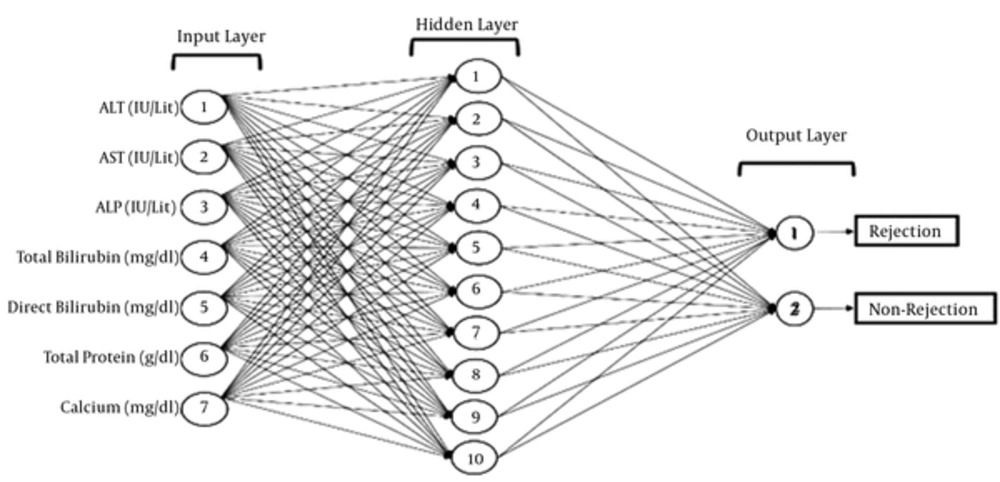
Figure 1.
The network consists of three layers, with 7 neurons in the input layer, 10 neurons in the hidden layer, and 2 neurons in the output layer. AST, aspartate aminotransferase; ALP, alkaline phosphatase; ALT, alanine aminotransferase.
2.3. Development of Logistic Regression Model
The logistic regression, a generalized linear model, was developed using Python programming language V3.5.2 in Linux Ubuntu 16.04 LTS. The training and testing datasets were the same as those applied in ANN; therefore, there were an ANN and a logistic model for training and testing datasets. The logistic regression performance was evaluated with ROC analysis using the same testing set.
2.4. Sensitivity Analysis on Artificial Neural Network Output
One of the major drawbacks of neural network models is being “black box” because of their failure to explain results or inability to generate interpretable parameters for each input variable (12, 25). To cope with this problem, sensitivity analysis was applied in order to investigate the importance of each input variable to the output.
2.5. Statistical Analysis
All statistical analyses were performed using SPSS software (SPSS: An IBM Company, version 19.0, IBM Corporation, Armonk, NY, USA). Continuous variables expressed as mean (standard deviation (SD)) were compared using independent t-test. The Chi-square test was used for categorical variables. Receiver-operating characteristic (ROC) curve analysis was performed to assess the performance or accuracy of the trained neural networks (26). The predictive performance was evaluated by calculating true-positive and false-positive fractions, positive and negative predictive values (PPV and NPV), accuracy, F-measure, likelihood ratio positive (LR+), and likelihood ratio negative (LR-). The true-positive fraction is the fraction of actual rejection properly predicted as rejection (sensitivity). The false-positive fraction is the fraction of actual non-rejection that was inaccurately predicted to rejection (1-specificity). The area under the ROC curve (AUC) was applied as an index of performance. AUCs were calculated on the results obtained from the test set. AUC may range from 0 to 1, with area of 1.0 corresponding to perfect discrimination and area of 0.5 to what is expected by chance alone (27). The optimum cut-off value to predict rejection or non-rejection was selected.
3. Results
3.1. Patients’ Characteristics
In a preliminary statistical study, different simple and routine laboratory tests of liver transplant patients including liver function tests, cell blood count, and coagulation tests on days 3, 7, and 14 after transplantation were separately assessed to choose those that were significantly different between acute rejection and non-rejection in liver transplant patients. To make equal comparative analysis among days 3, 7, 14 after transplantation, we selected the following seven statistically significant variables: aspartate aminotransferase (IU/L), alanine aminotransferase (IU/L), alkaline phosphatase (IU/L), total serum bilirubin (mg/dL), direct serum bilirubin (mg/dL), total serum protein (g/dL), and serum calcium (mg/dL). Consequently, these variables were used to initially build the inputs of the artificial neural network and a single output layer representing the probability of acute rejection (Figure 1).
The baseline characteristics of acute rejection and non-rejection in liver transplant recipients are shown in Table 1. The mean (SD) age was 38 (± 17.01) years, and the patients were predominantly men (63.5%). The underlying diagnoses of these patients were hepatitis B cirrhosis (30 patients), cryptogenic cirrhosis (27 patients), primary sclerosing cholangitis (26 patients), autoimmune hepatitis (13 patients), Wilson’s disease (10 patients), non-alcoholic steatohepatitis (9 patients), and other (33 patients).
Table 1.
Baseline Characteristics of the Acute Rejection and Non-Rejection Liver Transplant Patientsa
| Day 3 (n = 148) | Day 7 (n = 148) | Day 14 (n = 148) | ||||
|---|---|---|---|---|---|---|
| Variables | Rejection Patients (n = 34) | Non-Rejection Patients (n = 114) | Rejection Patients (n = 34) | Non-Rejection Patients (n = 114) | Rejection patients (n = 34) | Non-Rejection patients (n = 114) |
| Demographic | ||||||
| Age, y | 34.7 (13.27) | 38.05 (17.98) | 34.7 (13.27) | 38.05 (17.98) | 34.7 (13.27) | 38.05 (17.98) |
| Weight, kg | 67 (12.50) | 60.62 (18.03) | 67 (12.50) | 60.62 (18.03) | 67 (12.50) | 60.62 (18.03) |
| Gender (male/female) | (26/8) | (72/42) | (26/8) | (72/42) | (26/8) | (72/42) |
| Laboratory Values | ||||||
| BUN, mg/dL | 26.94 (16.20) | 28.56 (14.98) | 23.41 (19.67) | 19.52 (14.38) | 20.97 (13.46) | 17.55 (12.49) |
| Creatinine, mg/dL | 1.08 (0.98) | 0.98 (0.70) | 1.10 (1.19) | 1.10 (1.26) | 1.17 (1.86) | 0.95 (0.52) |
| Sodium, mEq/L | 139.20 (4.12) | 137.28 (12.38) | 139.26 (6.38) | 140.07 (3.51) | 137.50 (4.01) | 137.70 (5.08) |
| Potassium, mEq/L | 4.22 (0.44) | 4.11 (0.40) | 4.29 (1.07) | 4.03 (0.68) | 4.44 (0.61) | 4.41 (0.79) |
| Calcium, mg/dLb | 8.20 (0.71) | 7.69 (0.90) | 8.02 (1.15) | 7.78 (0.91) | 8.57 (0.80) | 7.95 (1.57) |
| ALT, IU/Lb | 976.91 (1426.87) | 404.22 (228.71) | 377.73 (230.60) | 151.35 (97.34) | 200.41 (117.12) | 87.82 (45.94) |
| AST, IU/Lb | 795.74 (1337.86) | 303.65 (176.11) | 134.29 (60.16) | 41.73 (10.92) | 55.67 (30.67) | 35.90 (22.20) |
| ALP, IU/Lb | 321.94 (210.31) | 269.91 (165.14) | 392.20 (230.29) | 315.67 (168.16) | 444.79 (234.45) | 341.55 (191.88) |
| GGT, IU/L | 17.84(4.33) | 19.08(7.16) | 15.16 (2.12) | 15.47 (3.76) | 14.33 (1.75) | 14.90 (3.08) |
| Total bilirubin, mg/dLb | 4.11 (3.78) | 3.45 (2.29) | 3.92 (3.82) | 2.23 (1.65) | 3.93 (4.66) | 1.59 (0.99) |
| Direct bilirubin, mg/dLb | 2.01 (1.84) | 2.52 (2.14) | 2.15 (2.25) | 1.21 (0.89) | 2.30 (3.09) | 1.11 (0.84) |
| Albumin, g/dL | 3.01 (0.48) | 2.87 (0.41) | 3.12 (0.53) | 3.01 (0.49) | 3.30 (0.48) | 3.25 (0.53) |
| Total protein, g/dLb | 5.36 (1.07) | 4.89 (0.73) | 5.32 (1.02) | 4.92 (0.83) | 5.65 (1.23) | 5.57 (1.01) |
| Hemoglobin, g/dL | 9.02 (1.75) | 8.62 (1.73) | 9.19 (2.03) | 9.35 (1.54) | 9.87 (1.94) | 9.49 (1.87) |
| Hematocrit, % | 27.08 (4.87) | 26.06 (4.29) | 27.93 (5.95) | 27.95 (4.08) | 32.14 (9.32) | 28.43 (5.11) |
| INR | 1.84 (0.81) | 1.76 (0.55) | 1.39 (0.37) | 1.37 (0.51) | 1.24 (0.29) | 1.29 (0.50) |
| Platelet count, 1/μL | 88865.7 (90269.6) | 67159.6 (71650.8) | 87687.1 (78435.1) | 60120.17 (43951.7) | 152938.2 (94136.0) | 145375.4 (93658) |
| WBC, cells/μL | 11468.5 (5935.07) | 9988.5 (8938.70) | 9755.88 (5617.08) | 8334.21 (4840.36) | 10126.4 (5211.7) | 10723.6 (8768.8) |
Abbreviations: ALP, alkaline phosphatase; ALT, Alanine Aminotransferase; AST, aspartate aminotransferase; BUN, Blood urea nitrogen; GGT, γ-glutamyltranspeptidase; INR, international normalized ratio; WBC, white cell.
aValues are expressed as mean (SD).
bSignificant input variables.
In this research, there were 3108 data points (21 variables) and the study population included 148 liver transplant patients with acute rejection and non-rejection, of which 102 were apportioned at random to the training set and the remaining 46 to the testing set. The variables used to build the artificial neural network were compared in the two sets (Table 2). These markers were not significantly different across the groups (P > 0.05). 23% of the patients (34 persons) were rejection cases, of which 24 episodes were used in the training set and 10 in the testing set.
Table 2.
Comparison of Clinical Features Between Training Data and Validation Data
| Day 3 (n = 148) | Day 7 (n = 148) | Day 14 (n = 148) | |||||||
|---|---|---|---|---|---|---|---|---|---|
| Variables | Training Set (n = 102) | Testing Set (n = 46) | P Value | Training Set (n = 102) | Testing Set (n = 46) | P Value | Training Set (n = 102) | Testing Set (n = 46) | P Value |
| ALT, IU/L | 532.90 (678.93) | 612.31 (964.30) | 0.571 | 208.63 (178.78) | 197.30 (193.52) | 0.728 | 114.09 (82.80) | 120.02 (94.71) | 0.705 |
| AST, IU/L | 432.84 (756.69) | 538.40 (1115.89) | 0.507 | 63.24 (48.65) | 58.28 (40.94) | 0.548 | 40.77 (28.15) | 44.84 (30.95) | 0.439 |
| ALP, IU/L | 292.41 (183.84) | 287.95 (170.34) | 0.891 | 322.25 (187.40) | 281.54 (129.42) | 0.184 | 391.69 (224.9) | 293.0 (157.25) | 0.093 |
| Total bilirubin, mg/dL | 3.49 (2.59) | 3.80 (2.99) | 0.533 | 2.56 (2.24) | 2.63 (2.51) | 0.867 | 2.23 (2.62) | 2.16 (2.73) | 0.892 |
| Direct bilirubin, mg/dL | 2.30 (1.95) | 2.44 (2.0) | 0.691 | 1.37 (1.26) | 1.45 (1.41) | 0.716 | 1.45 (1.74) | 1.47 (1.81) | 0.953 |
| Total protein, g/dL | 4.98 (0.87) | 5.09 (0.93) | 0.491 | 5.10 (0.90) | 4.90 (0.91) | 0.209 | 5.60 (1.07) | 5.52 (1.09) | 0.686 |
| Calcium, mg/dL | 7.81 (0.81) | 7.83 (1.06) | 0.897 | 7.87 (0.90) | 7.91 (0.75) | 0.800 | 8.03 (1.55) | 8.11(1.50) | 0.767 |
| Rejection/non-rejection | 24/78 | 10/36 | 0.811 | 24/78 | 10/36 | 0.811 | 24/78 | 10/36 | 0.811 |
Abbreviations: ALP, alkaline phosphatase; ALT, Alanine Aminotransferase; AST, aspartate aminotransferase.
3.2. Optimal Input Variable Data Sets and Prediction Accuracy
The sensitivity analysis of the seven variables used to initially construct the ANN is illustrated in Figure 2. The analysis indicated that the aspartate aminotransferase (IU/L) and alanine aminotransferase (IU/L) were two variables with the highest influence on the rejection outcome on days 7 and 14. Additionally, alanine aminotransferase (IU/L) and calcium were the most impressive variables in the prediction of acute rejection on day 3 whereas the other variables played minor roles.
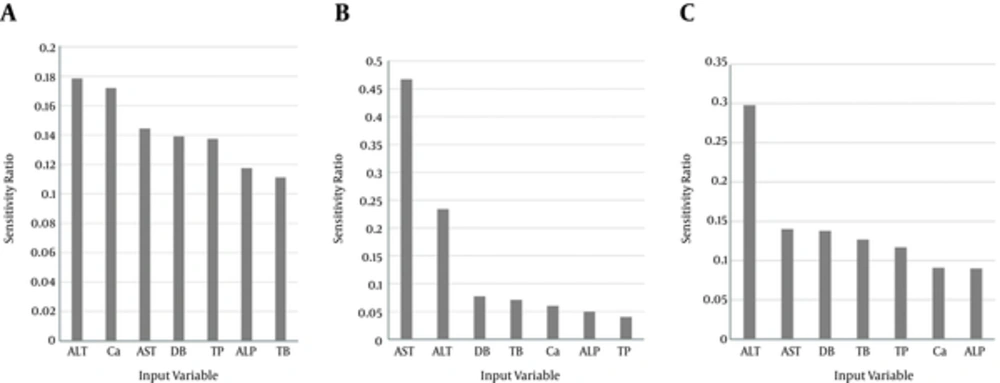
Figure 2.
Value shown for each input variable is a measure of its relative importance, with 0 representing a variable that has no effect on the prediction and 1 representing a variable that completely dominates the prediction. AST, aspartate aminotransferase; ALT, alanine aminotransferase; ALP, alkaline phosphatase; TP, total bilirubin; DB, direct bilirubin; TP, total protein; Ca, calcium.
Table 3 shows the ANN and LR performance in diagnosing the acute rejection in liver transplant patients compared to the gold standard liver biopsy. Some predictive performance indices such as accuracy, sensitivity, specificity, F-measure, positive and negative predictive values (PPV and NPV), likelihood ratio positive (LR+), likelihood ratio negative (LR-), and AUC on days 3, 7, and 14 regarding ANN and LR use in the training and testing sets at the optimum cut-off point are shown in Table 4. All performance indices were superior in the models developed by ANN to those built by LR on the three mentioned days. AUCs for training data and testing data (Figure 3) were higher in ANN models than in LR models. For training data on days 3, 7, and 14, AUCs were 0.83, 0.98, and 0.93 in ANN models and 0.58, 0.81, and 0.66 in LR models, respectively. For testing data on days 3, 7 and 14, AUCs were 0.61, 0.95, and 0.75 in ANN models and 0.50, 0.79, and 0.65 in LR models, respectively.
Table 3.
The ANN and LR Performance in Diagnosing Acute Rejection and Non-Rejection in Liver Transplant Patients, Compared to Liver Biopsy
| ANN | Logistic Regression | ||||
|---|---|---|---|---|---|
| Liver Biopsy Report | Rejection (N = 10) | Non-Rejection (N = 36) | Rejection (N = 10) | Non-Rejection (N = 36) | |
| Day 3 | Positive | 3 | 34 | 0 | 36 |
| Negative | 7 | 2 | 10 | 0 | |
| Day 7 | Positive | 8 | 34 | 3 | 35 |
| Negative | 2 | 2 | 7 | 1 | |
| Day 14 | Positive | 5 | 33 | 1 | 36 |
| Negative | 5 | 3 | 9 | 0 | |
Table 4.
Comparison of Predictive Performance of ANN (Artificial Neural Network) and Logistic Regression (LR) Using Optimum Cut-Off Point
| Day 3 (n = 148) | Day 7 (n = 148) | Day 14 (n = 148) | ||||||||||
|---|---|---|---|---|---|---|---|---|---|---|---|---|
| Training Set | Testing Set | Training Set | Testing Set | Training Set | Testing Set | |||||||
| Measure | ANN | LR | ANN | LR | ANN | LR | ANN | LR | ANN | LR | ANN | LR |
| Accuracy | 0.89 | 0.76 | 0.78 | 0.77 | 0.95 | 0.81 | 0.90 | 0.82 | 0.93 | 0.77 | 0.83 | 0.78 |
| Sensitivity | 0.72 | 0.56 | 0.57 | 0.51 | 0.94 | 0.72 | 0.87 | 0.70 | 0.86 | 0.59 | 0.68 | 0.57 |
| Specificity | 0.73 | 0.55 | 0.57 | 0.53 | 0.94 | 0.71 | 0.90 | 0.69 | 0.88 | 0.60 | 0.71 | 0.56 |
| PPV, % | 0.98 | 1 | 0.94 | 1.0 | 0.97 | 0.99 | 0.95 | 0.98 | 0.98 | 1.0 | 0.93 | 1.0 |
| NPV, % | 0.55 | 0 | 0.23 | 0.0 | 0.86 | 0.23 | 0.75 | 0.26 | 0.78 | 0.04 | 0.47 | 0.02 |
| F-measure | 0.93 | 0.86 | 0.87 | 0.87 | 0.96 | 0.89 | 0.94 | 0.89 | 0.96 | 0.87 | 0.89 | 0.88 |
| LR+ | 2.73 | 1.24 | 1.13 | 0.35 | 0.91 | 2.56 | 8.75 | 0.54 | 5.38 | 1.4 | 1.79 | 0.40 |
| LR- | 0.41 | 0.82 | 0.77 | 0.32 | 0.05 | 0.41 | 0.13 | 0.17 | 0.17 | 0.68 | 0.45 | 0.27 |
| AUC | 0.83 | 0.58 | 0.61 | 0.50 | 0.98 | 0.81 | 0.95 | 0.79 | 0.93 | 0.66 | 0.75 | 0.65 |
| Optimum cut-off point | 0.81 | 0.76 | 0.84 | 0.76 | 0.73 | 0.76 | 0.91 | 0.76 | 0.81 | 0.77 | 0.93 | 0.77 |
Abbreviations: LR-, likelihood ratio negative; LR+, likelihood ratio positive; NPV, negative predictive value; PPV, positive predictive value.
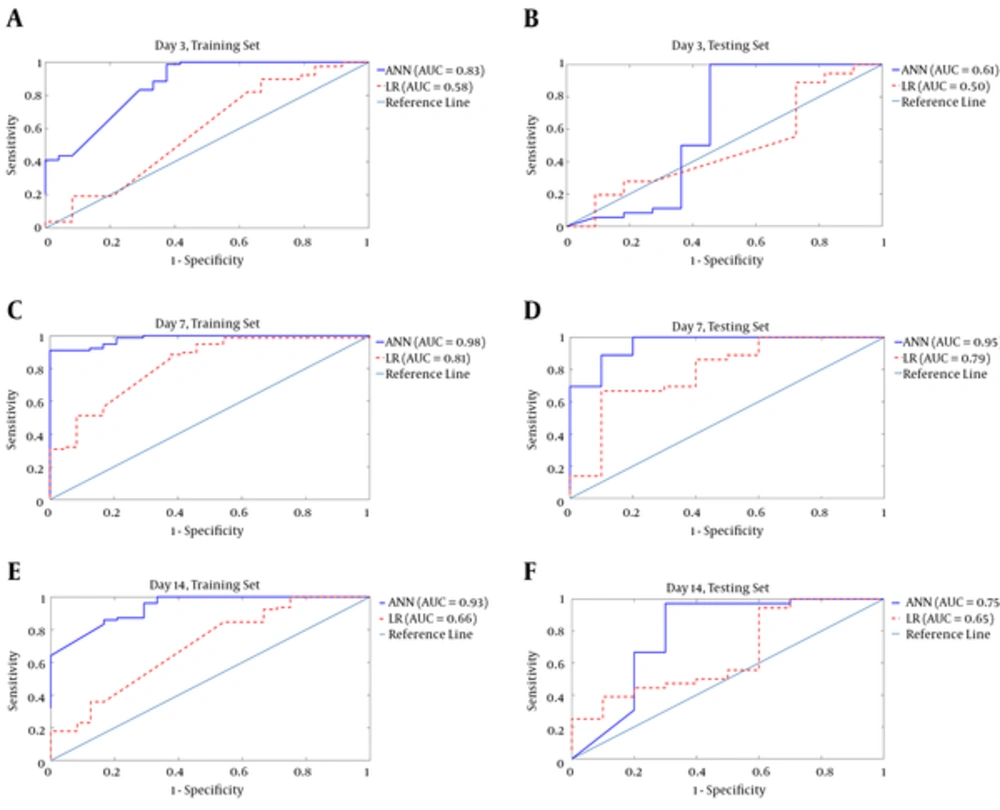
Figure 3.
A, in the training set AUCs for day 3 (ANN = 0.83 ± 0.12, LR = 0.58 ± 0.03); B, in the testing set AUCs for day 3 (ANN = 0.61 ± 0.09, LR = 0.50 ± 0.10); C, In the training set AUCs for day 7 (ANN = 0.98 0.01, LR = 0.81 ± 0.01); D, In the testing set AUCs for day 7 (ANN = 0.95 ± 0.03, LR = 0.79 ± 0.04); E, In the training set AUCs for day 14 (ANN = 0.93 0.07, LR = 0.66 ± 0.02 ); F, In the testing set AUCs for day 14 (ANN = 0.75 ± 0.10 , LR = 0.65 ± 0.07).
Finally, the ANN model on day 7 revealed the best results compared to the models on days 3 and 14, which used seven input variables, recognized correctly eight out of ten acute rejection patients and 34 out of 36 non-rejection ones in the testing set (yielding a mean accuracy, a sensitivity, and a specificity of 95%, 94%, and 94%, respectively). These values were 3 out of 10 and 30 out of 36 in LR test, respectively. Therefore, the results showed that ANN model outperformed the LR model on the three mentioned days.
Furthermore, to find any prognostic interrelationship between MELD values and acute allograft rejection, we assessed MELD values in this study. MELD values had the same effect like TP (the day 7 data) in predicting rejection and non-rejection. Based on pre-transplant MELD values, recipients were categorized as low risk (≤ 15), medium risk (16 - 25), and high risk (> 25). The ANN model along with other selected features recognized correctly eight out of ten acute rejection patients and 34 out of 36 non-rejection ones in the testing set. In the group of recipients with MELD values less than 15, two rejection and six non-rejection cases were predicted. In the second group with MELD values between 16 and 25, 5 rejection and 17 non-rejection cases were predicted. In the last group with MELD values more than 25, one and 11 rejection and non-rejection cases, respectively, were predicted. Therefore, the recipients with MELD values between 16 and 25 had the highest correlation with rejection.
4. Discussion
Acute Rejection (AR) is the most common form of liver allograft rejection. It usually happens within the first month of transplantation and its diagnosis depends heavily on the use of liver biopsy. Given that liver biopsy provides pivotal information for diagnosis and serves to guide further therapeutic decisions, it is itself a highly risky procedure, particularly in patients with impaired coagulation (9, 28). Thus, it is not appropriate for regular monitoring of liver transplant patients. For these reasons, liver transplant patients would hugely benefit from a reliable, non-invasive method of diagnosing rejection.
Artificial neural networks (ANNs) have been studied in different areas of medical applications, including diagnosis of acute myocardial infarction (29), diagnosis of thyroid function from in vitro laboratory tests (30), prediction of urinary tract infection (17), prediction of influenza vaccination outcome (19), cancer diagnosis (18, 31), prediction of delayed renal allograft function (32), predicting acute graft-vs-host disease after unrelated donor hematopoietic stem cell transplantation in thalassemia patients (33), and predicting cytomegalovirus (CMV) disease after renal transplantation (34). In the liver transplantation field, the use of ANNs has been scrutinized in prediction of fibrosis in hepatitis C virus infected liver transplant recipients (12), prediction of outcomes after liver transplantation (21), and prediction of graft failure (22). Furthermore, ANNs have been designed to predict patient survival after liver transplantation (35) and early transplant failure (36).
Although, there are some previous studies in the field of liver transplantation using ANN, to our knowledge, there is only one published study evaluating ANN in predicting acute rejection following liver transplantation. It should be noted that the variables that they used as input to build the ANN and the ANN model were different from those of our study.
In the present study, we developed an ANN model, based entirely on routine and inexpensive laboratory data, in order to diagnose acute rejection in liver transplant patients. In designing the ANN, in order to make equal comparative analysis among days 3, 7, and 14 after transplantation, seven statistically significant variables were chosen. Moreover, for testing the ANN, we used test data that were not applied for training, and the results were compared with a logistic regression (LR) model using the same data.
The ANN and LR models using optimum cut-off point had the best performance (accuracy 0.90; sensitivity 0.93; specificity 0.90; F-measure 0.94 and accuracy 0.82 sensitivity 0.70, specificity 0.69, F-measure 0.89, respectively) on day 7, compared to days 3 and 14. Furthermore, the ANN on this day recognized correctly eight out of ten acute rejection patients and 34 out of 36 non-rejection ones in the testing set.
In all training sets and testing sets, accuracy, sensitivity, specificity, F-measure, and AUC were higher in the 3, 7, and 14 days' models built by ANN than in those constructed by LR; this is consistent with other reports in which ANN outperformed LR in both training and testing (37-40).
In this study, ANN demonstrated accuracy in predicting acute rejection in liver transplant recipients at acceptable levels (AUC 0.95), which was related to day 7. Victoria et al. also reported excellent diagnostic accuracies (AUC 0.902 with sensitivity and specificity of 80.0% and 90.1% at the optimum decision threshold, respectively) when training ANN to predict acute rejection in liver transplant recipients over the first 3 months after transplantation using alanine aminotransferase, bilirubin levels, and day post-transplantation (9). Besides, Cucchetti similarly demonstrated superiority of ANN to MELD in predicting mortality of patients with end-stage liver disease (AUC 0.95). Habib et al. showed that the pre-transplant MELD score was inversely correlated with post-transplant survival based on a larger study with a longer follow-up (41). Moon et al. exhibited that the high MELD group had a significantly lower graft and patient survival rate than the low and intermediate MELD groups did (42).
Another study showed that ANN is superior to pediatric and model for end-stage liver disease (PELD-MELD) for predicting poor outcome in pediatric acute liver failure (PALF) with AUC 0.96, sensitivity 82.6%, and specificity 96% (41). Ibanez et al. also designed an LR and an ANN model to predict early transplant failure using variables from donor, recipient, and operative data. The AUC of this model in the training and validation groups was 75% and 68.7 % for logistic regression and 96% and 69.9 % for neural network, respectively (36).
The ANN assessed in this study was not developed to replace clinical judgment or liver biopsy, but rather to serve as a help in decision-making in a similar manner to other liver function test results for the diagnosis of acute rejection in the early postoperative period. It can be seen in Table 3 that the ANN output pattern is very similar to that of liver biopsy report after transplantation. Thus, it would be easy for physicians to realize and apply the results obtained from this network.
The two limitations of our study were the small sample size and the short follow-up period of our patients. These results are promising, particularly when compared to the performance of traditional statistical models on the same data set. The freedom of neural networks from a priori assumptions concerning the data, and their robustness when confronting with noisy data generated by nonlinear processes make them encouraging and well-suited tools through which we can develop predictive clinical models.
In conclusion, this research suggests that the ANN may be as a potential clinical decision-support tool for identifying liver transplant recipients at risk of rejection using clinical information and simple laboratory tests. In future research, Cohort studies using higher sample sizes, and long follow-up periods of patients could improve such new models in decision-making and patient management in actual clinical practice.
In conclusion, this research showed the proposed predictive models make an acceptable predictive power and they can be used as support methods for facilitating clinical decision-making processes and disease prognosis. In future studies, cohort studies using higher sample sizes and long follow-up periods of patients could improve such models in decision-making and patient management in actual clinical practice.