
1. Background
Urbanization is increasing in world populations and has dramatically changed human living environments (1). It is estimated that in 2050, 68% of the world population will be living in urban dwellings (2). Therefore, the new concept of urban liveability has now attracted the attention of public health specialists and politicians. A livable community is a community that can provide the basic health and mental needs of residents such as security, social interaction and inclusion, environmental sustainability, affordable and diverse housing, leisure and cultural attractions, suitable employment, education, convenient public transport, walking and cycling paths, green spaces, local shops, accessible health, and community services (3). However, nowadays, many world cities have not only been unsuccessful in fulfilling these needs but are also struggling to manage crises such as noise pollution, traffic jams, unplanned population growth, slams, inappropriate housing, and deteriorating air quality (2).
Goal 11 from the sustainable development goals (SDG) of the united nations seeks to make cities more safe, resilient, and sustainable (4). Improving health is also a global priority for 2030, with SDG goal 3, focusing on promoting well-being for all ages (5).
The effects of urbanization on human health have been under scrutiny in some studies (1). Researchers think residing in cities, urban lifestyle, and socioeconomic status are among the main causes of the increased burden of non-communicational diseases such as cancer and mental diseases. However, if urban planning is done according to liveability standards, some of this burden can be alleviated (5-7).
Global cancer incidence, mortality, and prevalence (GLOBOCAN) 2018 estimates that the shares of cancer cumulative incidence and age-standardized incidence rates (ASIR) per 100 000 population in western Asia, Iran is a part of which, were 17.51 and 168.2, respectively. GLOBOCAN 2018 also estimates that the shares of cancer incidence and deaths were 48.4 and 57.3% in Asia, respectively (8), which is more than half of the world’s deaths. World Health Organization (WHO) estimates that 9.6 million global deaths were caused by cancer in 2018, and approximately 70% of this mortality was from low- and middle-income countries (LMIC) (6).
Cancer control programs are among the main agenda for non-communicable disease (NCDs) control in Iran because cancer is the third most common cause of mortality following cardiovascular disease and road traffic accidents in this country. According to the results of the Iranian National Population-based Cancer Registry (INPCR) in 2014, the ASIRs of all cancers in Iran were 177.44 and 141.18 in 100 000 males and females, respectively. This report also shows the geographical diversities in incidence rates of cancers in Iran (9). By matching the distribution of cancer incidence with environmental and urbanization risk factors, scientists can frame new theories for cancer etiology and provide recommendations for cancer prevention and public health resource allocation (10, 11). Urban infrastructure including sources of energy, noise pollution, transportation, shelter, air pollution, social isolation, sedentary behavior, unhealthy food, and tobacco use are important determinants of population health and health equity and can influence the risk of morbidity from chronic and mental diseases (12, 13). These risks are inequitably distributed in cities and, usually, the low socioeconomic groups have the highest exposure and worst prognosis. Researchers believe that cities produce systematic health inequities based on social status (14).
Nowadays, modern cities are increasingly focusing on determining and decreasing these inequities. At least 102 cities in 53 countries use the WHO’s Urban Health Equity Assessment and Response Tool (Urban HEART) to analyze and plan for better health outcomes (5). There are national and subnational differences in the ways people understand cancer and their beliefs about this disease, what causes it, and how to prevent it. There are also differences in symptom presentation, access to early detection and diagnosis, participation in cancer screening programs, and access to preventive interventions around the world (15).
Iran is undergoing rapid urbanization. The proportion of Iran’s urban population has grown to 75.4% in 2019 and is expected to increase to 86% by 2050 (16). Urbanization in Iran provides a unique opportunity to explore the mechanisms, by which urban liveability and urban environments influence cancer epidemiology. The associations between urbanization and cancer incidences have been reported in Iran and some other countries (17-21). However, the relationship between cancer incidence and urban liveability remains largely unexplored with just a few exceptions (22, 23).
2. Objectives
In this study, we aimed at exploring the association of some urban liveability indicators and environmental risk factors with the incidence rates of 7 prevalent cancers in Iran, using province-level data.
3. Methods
3.1. Study Population and Area
Urban Liveability Index (ULI) and cancer incidence rates were inquired for all 31 provinces of Iran in 2016. The units of the analyses were provinces.
3.2. Cancer Incidence Outcomes
ASIR of 7 more prevalent cancers of Iran including lung, breast, prostate, stomach, colorectal, and liver cancer, and leukemia were inquired from the population-based cancer registry of the Iranian Ministry of Health and Medical Education for 2016.
In this database, information of patients with cancer including their address of residence is included. In cases where the addresses do not match or there are several addresses for one patient, an investigation is done to find out the correct residing address of the individual. The officials of the cancer registry claim that the recorded addresses are more than 90% accurate.
The incidence rates for each cancer, in each province were calculated by the direct standardization method, using the age structure of the Segi-Doll’s world population as the standard. A detailed description of this method can be found elsewhere (9).
3.3. ULI Data
The Global Liveable City Index (GLCI) was a framework employed by Tan et al. to construct the Asia Competitiveness Institute’s (ACI’s) liveability framework (2020). Since then, the GLCI framework has been used in several different studies (24). This framework ranks the liveability of cities by 5 themes (dimensions), each with several indicators, to operationalize measurement (24), which are: (1) economic vibrancy and competitiveness (28 indicators); (2) environmental friendliness & sustainability (29 indicators); (3) domestic security & stability (8 indicators); (4) socio-cultural conditions (43 indicators); (5) political governance (6 indicators).
In this study, these 114 practical indicators, under 5 domains, were used to estimate urban liveability.
A detailed description of the indicators used in this study can be found elsewhere (25). Data about these indicators for the year 2016 were gathered from reliable sources, including statistical yearbooks, and reports from the Environmental Protection Agency, Ministry of Health and Medical Education, Ministry of Information and Communication, Department of Tourism and Cultural Heritage, and municipalities (25). The overall scores were divided based on the 33.3 and 66.7 percentiles into 3 categories (low, medium, and high).
3.4. Statistical Analysis
Each province was treated as a single observation. The main outcomes were ASIR of cancers. Kolmogorov-Smirnov test was used to test the normality of the data; and because the data were normal, the Pearson’s correlation test was used to estimate the association between age-standardized cancer incidence rates and ULI and its domains. We also generated scatter plots to visualize the pattern of these correlations.
Given the count nature of the study outcomes that was the number of cancer cases in each province and the over-dispersion of data, negative binomial (NB) regression was performed to estimate the incidence rate ratios (IRR) and their 95% confidence intervals (CI). Explanatory variables were in three levels, below the 33rd percentile (low liveability), between the 33rd and 66th percentile (medium liveability), and above the 66th percentile (high liveability). We reported IRRs for the provinces in medium and high liveability versus those with low liveability. In these models, the total population of each province was considered the offset. Age was adjusted for all cancers, while the effect of sex was adjusted only for stomach, lung, colorectal, liver, and blood cancer. Statistical analyses were performed in Stata v14.0 (Stata crop, Texas, USA) and SPSS v 21.0. P-values less than 0.05 were considered significant.
4. Results
4.1. Urban Liveability Index
Urban liveability was calculated, using the GLCI method and the scores of 31 Iranian provinces ranged from -2.456 to 3.054 (Figure 1). Provinces were classified into 3 levels (low, moderate, and high) for each domain. Figure 1 shows the situation of provinces regarding total urban liveability and its domains. Provinces with higher scores, including Tehran, Mazandaran, and East Azerbaijan are the most livable provinces of the country.
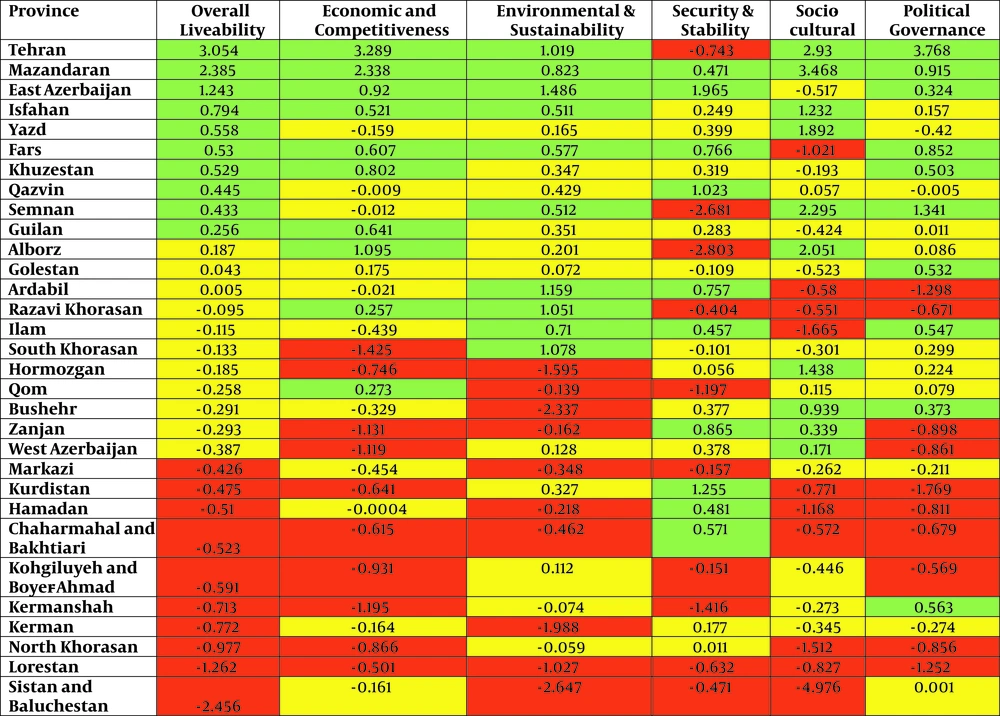
Figure 1.
Urban Liveability Index scores in different domains for each Iranian province. The green, yellow, and red colors indicate low, medium, and high liveability scores, respectively.
4.2. Cancer Incidence Rates
In 2016, 57 891 new cases of cancer were reported in all 31 provinces. ASIR for all cancers ranged from 77.09 per 100 000 in Sistan and Baluchestan Province to 204.39 per 100 000 in Yazd Province. The ASIRs of all cancers were 172.37 and 147.30 per 100 000 in males and females, respectively, and after excluding non-melanoma skin cancer, they were 153.66 and 135.88 per 100 000 in males and females, respectively. Cancers of breast (ASIR = 37.52), prostate (ASIR = 20.13), stomach (ASIR = 13.48), colorectal (ASIR = 10.40), lung (ASIR = 8.19), liver (ASIR = 3.24), and leukemia (ASIR = 2.96) were the most common cancers in Iran in 2016. Figure 2 shows the age-specific incidence rates of the 7 most common cancers of Iran, in provinces, in 2016.
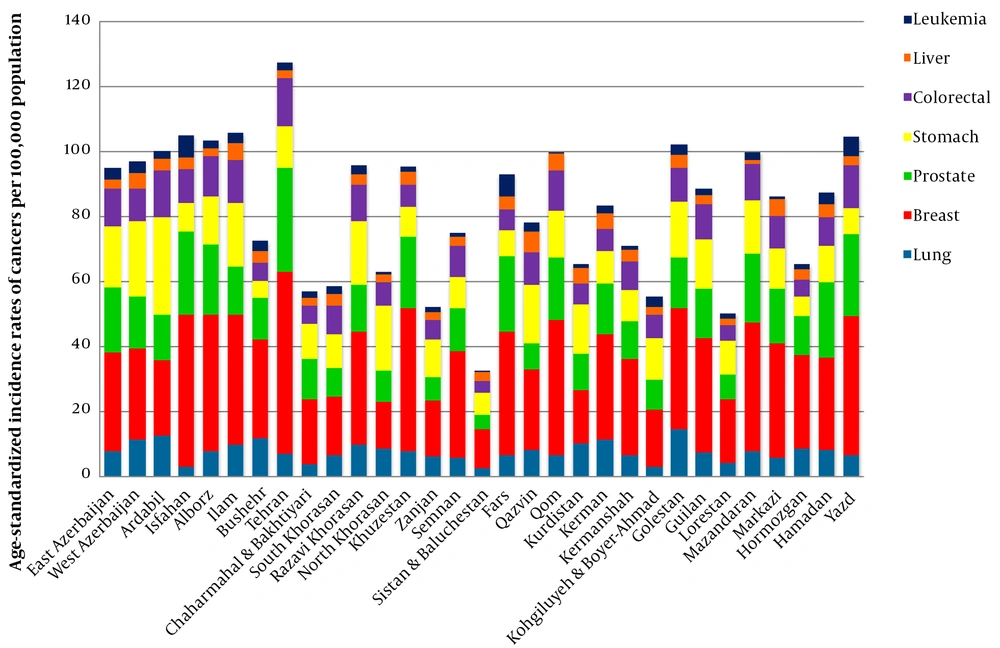
Figure 2.
Age-specific incidence rates (per 100 000) of the most common cancers in Iran in 2016.
4.3. Correlations Between Urban Liveability and Cancer Incidence Rates
Cancer incidence had a strong and significant correlation with overall liveability, especially in breast (r = 0.71, P < 0.001), prostate (r = 0.73, P < 0.001), and colorectal (r = 0.62, P < 0.001) cancers. Also, provinces with higher urban liveability had reported more leukemia, but it was not significant (r = 0.33, P = 0.063). The correlation between liver, stomach, and lung cancer incidence rates with overall liveability was not statistically significant either (Table 1, Figure 3). Correlations between cancer incidence rates and the domains of urban liveability are presented in Table 1.
Table 1.
Pearson Correlation of the Urban Liveability Index with Cancer Incidence in Iran, 2016
| Variables | Lung | Breast | Prostate | Stomach | Colorectal | Liver | Leukemia | |||||||
|---|---|---|---|---|---|---|---|---|---|---|---|---|---|---|
| r | P-v | r | P-v | r | P-v | r | P-v | r | P-v | r | P-v | r | P-v | |
| Overall liveability | 0.11 | 0.591 | 0.71 a | < 0.001 a | 0.73 a | < 0.001 a | 0.12 | 0.510 | 0.62 a | < 0.001 a | -0.14 | 0.440 | 0.33 | 0.063 |
| Economic vibrancy and competitiveness | 0.02 | 0.936 | 0.71 a | < 0.001 a | 0.73 a | < 0.001 a | 0.05 | 0.790 | 0.51 a | 0.004 a | -0.21 | 0.269 | 0.17 | 0.362 |
| Environmental friendliness & sustainability | 0.07 | 0.724 | 0.32 | 0.075 | 0.40 a | 0.028 a | 0.55 a | < 0.001 a | 0.68 a | < 0.001 a | 0.01 | 0.956 | 0.25 | 0.179 |
| Domestic security & stability | 0.22 | 0.240 | -0.23 | 0.219 | -0.02 | 0.899 | 0.21 | 0.253 | -0.13 | 0.488 | 0.19 | 0.293 | 0.35 | 0.056 |
| Socio-cultural conditions | 0.08 | 0.678 | 0.58 a | < 0.001 a | 0.53 a | 0.002 a | -0.08 | 0.666 | 0.43 a | 0.015 a | -0.23 | 0.214 | 0.17 | 0.348 |
| Political governance | -0.08 | 0.657 | 0.66 a | < 0.001 a | 0.52 a | 0.003 a | -0.27 | 0.141 | 0.35 | 0.053 | -0.12 | 0.508 | 0.09 | 0.601 |
Abbreviations: r, the correlation coefficient; p-v, P-value.
a Estimates with significant P-values at below 5% level.
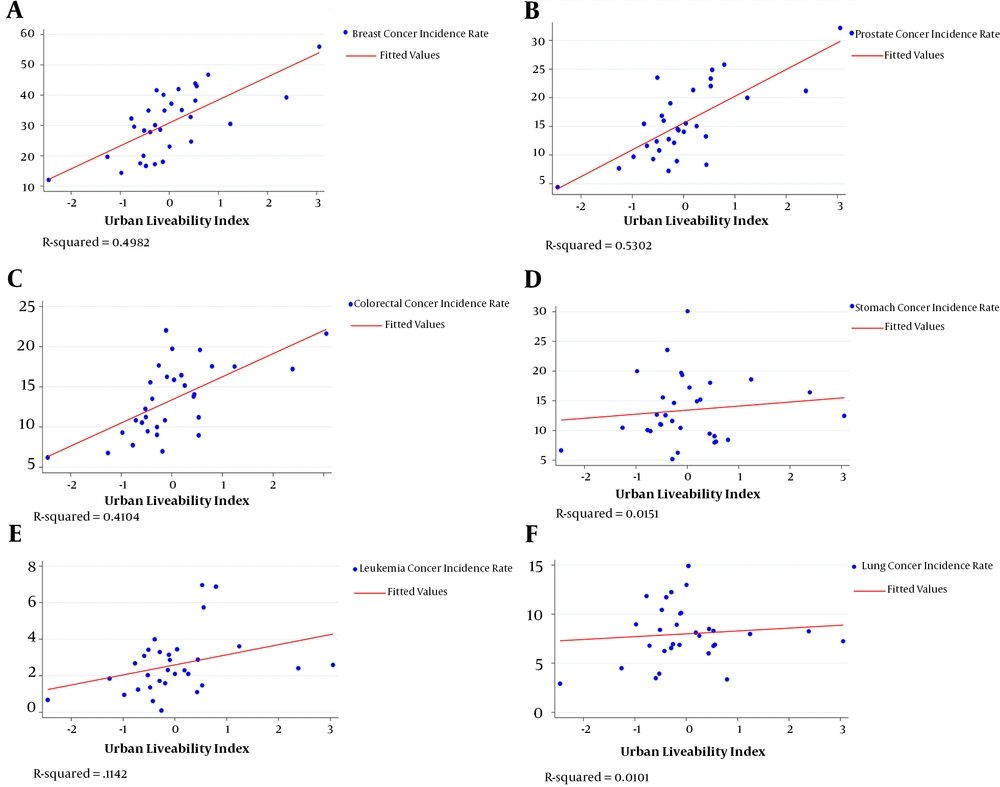
Figure 3.
The provincial-level correlation of the overall urban liveability index with breast (A), prostate (B), colorectal (C), stomach (D), leukemia (E), and lung cancer incidence (F).
Table 2 depicts the distribution and demographic characteristics of patients with cancer in low, medium, and high liveability provinces of Iran.
Table 2.
Demographic Characteristics of Patients with Cancer in Iran, 2016
| Demographic Characteristic/The Urban Liveability | Cancers | ||||||
|---|---|---|---|---|---|---|---|
| Stomach | Colorectal | Liver | Leukemia | Lung | Breast | Prostate | |
| Patient, No. (%) | |||||||
| Low | 1741 (17) | 1466 (13.6) | 578 (23.3) | 827 (16.1) | 1094 (17.8) | 1990 (13.7) | 966 (14.9) |
| Medium | 3409 (33.4) | 2883 (26.8) | 694 (28) | 1411 (27.4) | 1941 (31.6) | 3549 (24.4) | 1405 (21.6) |
| High | 5055 (49.5) | 6406 (59.5) | 1211 (48.7) | 2914 (56.6) | 3113 (50.6) | 9009 (61.9) | 4122 (63.5) |
| Mean age (SD) | |||||||
| Low | 66.93 (14.9) | 60.55 (15.6) | 67.66 (17.1) | 43.54 (31.2) | 66.26 (14.4) | 51.85 (13.7) | 72.77 (11.1) |
| Medium | 67.38 (18.3) | 62.17 (23.2) | 64.62 (18.2) | 47.55 (34.1) | 66.68 (20.8) | 51.91 (14.2) | 73.41 (10.6) |
| High | 66.97 (14.3) | 62.05 (14.6) | 65.25 (18.4) | 48.27 (34.6) | 65.37 (14.1) | 52.15 (13.8) | 71.72 (13.6) |
| Age range (y) | |||||||
| Low | 3 - 113 | 9 - 99 | 2 - 109 | 1 - 107 | 4 - 100 | 11 - 100 | 19 - 116 |
| Medium | 4 - 101 | 3 - 101 | 1 - 105 | 1 - 100 | 4 - 104 | 11 - 115 | 25 - 106 |
| High | 6 - 100 | 3 - 97 | 1 - 99 | 1 - 100 | 3 - 96 | 11 - 98 | 23 - 100 |
| Sex, No (%) | |||||||
| Male | |||||||
| Low | 1173 (17.1) | 773 (12.8) | 374 (25.1) | 494 (15.8) | 770 (18) | - | 966 (14.9) |
| Medium | 2260 (32.9) | 1633 (27) | 425 (28.5) | 857 (27.5) | 1303 (30.5) | - | 1405 (21.6) |
| High | 3432 (49.9) | 3646 (60.2) | 692 (46.4) | 1769 (56.7) | 2199 (51.5) | - | 4122 (63.5) |
| Female | |||||||
| Low | 568 (17) | 693 (14.7) | 204 (20.6) | 333 (16.4) | 324 (17.4) | 1990 (13.7) | - |
| Medium | 1150 (34.4) | 1246 (26.5) | 269 (27.1) | 554 (27.3) | 627 (33.6) | 3549 (24.4) | - |
| High | 1622 (48.6) | 2760 (58.7) | 519 (52.3) | 1145 (56.3) | 915 (49) | 9009 (61.9) | - |
Regression analyses also showed that provinces with higher urban liveability had a higher likelihood of cancer incidence and this association was statistically significant for all cancers, except for liver and stomach cancer. Provinces with a higher overall urban liveability had a higher incidence of colorectal cancer (IRR = 1.57, P = 0.002), leukemia (IRR = 1.48, P = 0.002), breast cancer (IRR = 1.26, P = 0.045), prostate cancer (IRR = 1.66, P = 0.005), and lung cancer (IRR = 1.45, P = 0.009) (Table 3).
Table 3.
The Negative Binomial Regression Analyses of the Urban Liveability Index Associated with Cancer Incidence in Iran, 2016
| The Urban Liveability Score | Stomach Cancer | Colorectal Cancer | Liver Cancer | Leukemia Cancers | ||||
|---|---|---|---|---|---|---|---|---|
| IRR (95% CI) | P-Value | IRR (95% CI) | P-Value | IRR (95% CI) | P-Value | IRR (95% CI) | P-Value | |
| Overall liveability | ||||||||
| Low | Ref | Ref | Ref | Ref | ||||
| Medium | 1.20 (0.87 - 1.66) | 0.262 | 1.31 (0.98 - 1.76) | 0.066 | 1.01 (0.75 - 1.37) | 0.912 | 1.28 (1.02 - 1.61) a | 0.032 a |
| High | 1.14 (0.83 - 1.57) | 0.387 | 1.57 (1.17 - 2.11) a | 0.002 a | 0.94 (0.69 - 1.29) | 0.737 | 1.48 (1.15 - 1.90) a | 0.002 a |
| Economic vibrancy and competitiveness | ||||||||
| Low | Ref | Ref a | Ref | Ref | ||||
| Medium | 1.12 (0.82 - 1.54) | 0.455 | 1.34 (1.02 - 1.77) a | 0.033 a | 1.48 (1.15 - 1.90) a | 0.002 a | 1.20 (0.97 - 1.50) | 0.089 |
| High | 1.17 (0.85 - 1.61) | 0.310 | 1.49 (1.12 - 1.98) a | 0.005 a | 1.22 (0.94 - 1.58) | 0.127 | 1.39 (1.10 - 1.75) a | 0.005 a |
| Environmental friendliness & sustainability | ||||||||
| Low | Ref | Ref | Ref | Ref | ||||
| Medium | 1.45 (1.09 - 1.93) a | 0.009 a | 1.47 (1.17 - 1.85) a | 0.001 a | 1.03 (0.79 - 1.35) | 0.796 | 0.97 (0.75 - 1.26) | 0.872 |
| High | 1.53 (1.14 - 2.05) a | 0.004 a | 1.79 (1.41 - 2.28) a | < 0.001 a | 0.95 (0.71 - 1.25) | 0.718 | 1.08 (0.81 - 1.43) | 0.571 |
| Domestic security & stability | ||||||||
| Low | Ref | Ref | Ref | Ref | ||||
| Medium | 1.09 (0.81 - 1.47) | 0.542 | 0.95 (0.71 - 1.27) | 0.748 | 1.11 (0.85 - 1.45) | 0.412 | 1.34 (1.07 - 1.69) a | 0.010 a |
| High | 1.36 (0.99 - 1.86) | 0.053 | 1.11 (0.82 - 1.49) | 0.492 | 1.14 (0.87 - 1.50) | 0.335 | 1.13 (0.89 - 1.42) | 0.296 |
| Socio-cultural conditions | ||||||||
| Low | Ref | Ref | Ref | Ref | ||||
| Medium | 0.92 (0.67 - 1.26) | 0.624 | 1.07 (0.80 - 1.45) | 0.615 | 1.18 (0.92 - 1.51) | 0.173 | 1.15 (0.91 - 1.46) | 0.217 |
| High | 0.78 (0.53 - 1.07) | 0.127 | 1.12 (0.82 - 1.54) | 0.454 | 0.82 (0.63 - 1.07) | 0.158 | 1.12 (0.88 - 1.44) | 0.338 |
| Political governance | ||||||||
| Low | Ref | Ref | Ref | Ref | ||||
| Medium | 0.81 (0.59 - 1.12) | 0.215 | 1.08 (0.80 - 1.45) | 0.584 | 1.26 (0.96 - 1.64) | 0.088 | 1.38 (1.11 - 1.71) a | 0.003 a |
| High | 0.88 (0.64 - 1.20) | 0.432 | 1.24 (0.92 - 1.67) | 0.142 | 1.07 (0.79 - 1.46) | 0.625 | 1.30 (1.05 - 1.62) a | 0.016 a |
| The Urban Liveability Score | Lung Cancer | Breast Cancer | Prostate Cancer | |||||
| IRR (95% CI) | P-Value | IRR (95% CI) | P-Value | IRR (95% CI) | P-Value | |||
| Overall liveability | ||||||||
| Low | Ref | Ref | Ref | |||||
| Medium | 1.45 (1.09 - 1.91) a | 0.009 a | 1.12 (0.92 - 1.36) | 0.255 | 1.02 (0.72 - 1.45) | 0.890 | ||
| High | 1.21 (0.91 - 1.61) | 0.178 | 1.26 (1.05 - 1.58) a | 0.045 a | 1.66 (1.16 - 2.36) a | 0.005 a | ||
| Economic vibrancy and competitiveness | ||||||||
| Low | Ref | Ref | Ref | |||||
| Medium | 1.36 (1.01 - 1.82) a | 0.039 a | 1.20 (0.98 - 1.47) | 0.076 | 1.43 (1.03 - 1.98) a | 0.031 a | ||
| High | 1.15 (0.86 - 1.54) | 0.336 | 1.38 (1.07 - 1.77) a | 0.011 a | 2.11 (1.48 - 3.02) a | < 0.000 a | ||
| Environmental friendliness & sustainability | ||||||||
| Low | Ref | Ref | Ref | |||||
| Medium | 1.22 (0.92 - 1.63) | 0.156 | 1.19 (0.98 - 1.43) | 0.068 | 1.16 (0.80 - 1.67) | 0.424 | ||
| High | 1.43 (1.07 - 1.91) a | 0.014 a | 1.21 (0.99 - 1.48) | 0.060 | 1.50 (1.03 - 2.18) a | 0.032 a | ||
| Domestic security & stability | ||||||||
| Low | Ref | Ref | Ref | |||||
| Medium | 1.38 (1.03 - 1.86) a | 0.029 a | 1.19 (0.99 - 1.45) | 0.063 | 1.14 (0.77 - 1.68) | 0.491 | ||
| High | 1.37 (1.01 - 1.86) a | 0.041 a | 1.03 (0.85 - 1.25) | 0.716 | 1.19 (0.80 - 1.78) a | 0.377 a | ||
| Socio-cultural conditions | ||||||||
| Low | Ref | Ref | Ref | |||||
| Medium | 1.03 (0.76 - 1.40) | 0.817 | 1.18 (0.97 - 1.44) | 0.084 | 1.18 (0.81 - 1.72) | 0.385 | ||
| High | 1.08 (0.79 - 1.48) | 0.592 | 1.08 (0.87 - 1.35) | 0.437 | 1.44 (0.97 - 2.13) | 0.065 | ||
| Political governance | ||||||||
| Low | Ref | Ref | Ref | |||||
| Medium | 0.88 (0.66 - 1.19) | 0.437 | 1.08 (0.89 - 1.31) | 0.389 | 1.24 (0.84 - 1.81) | 0.263 | ||
| High | 1.09 (0.80 - 1.48) | 0.583 | 1.34 (1.11 - 1.61) a | 0.002 a | 1.31 (0.87 - 1.98) | 0.188 | ||
Abbreviations: IRR, incidence rate ratio; CI, confidence intervals.
a Estimates with significant P-values at below 5% level.
Provinces with higher scores in the domains had also reported higher incidence rates for some cancers. Provinces with higher economic vibrancy and competitiveness had significantly more colorectal, liver, leukemia, lung, breast, and prostate cancer incidence rates.
Also, provinces with higher environmental friendliness and sustainability showed significantly more stomach, colorectal, lung, and prostate cancer incidence.
Meanwhile, provinces with higher domestic security and stability had significantly more leukemia and lung cancer, and provinces with high political governance had significantly more breast cancer and leukemia compared with low-level provinces (Table 3).
5. Discussion
This study shows that in Iran provinces with better urban liveability had higher rates of cancer incidence, particularly for prostate, colorectal, and breast cancer. Also, provincial-level, economic conditions, environmental sustainability, domestic security, and political governance performance were directly associated with cancer incidence. According to GLOBOCAN and local reports (26), Iran is a medium-risk country for cancer incidence. There is a notable diversity in the incidence of different types of cancer in different provinces of Iran and cancer has had an increasing trend in Iran in recent years (9).
In Iran, provinces with higher rates of urbanization and liveability are more likely to have a higher prevalence of NCD risk factors, which include low physical activity, obesity, and unhealthy diets (9). Rapid urbanization coupled with lifestyle changes and socio-economic development has led to changes in the pattern of health outcomes in cities (5). Historically, in LMICs, overweight and obesity were associated with high income. But, in richer countries, overweight and obesity are more common among the low socioeconomic groups (27).
A study conducted on 122 countries in 2018 showed that the incidence rate of all cancers directly increases as per capita income increases, and this relationship remained even after controlling for population aging. Economic development may cause higher life expectancy by improved and early cancer detection and case reporting but maybe also associated with environmental pollution and unhealthy lifestyles (22).
An ecological study conducted on 49 European countries reported that prostate cancer incidence varied more than 15-fold across the world, and was highest in high-income countries. Also, healthcare expenditure (RR = 1.46) and population growth (RR = 1.15), as well as computer (RR = 1.43), and mobile phone density (RR = 1.07) were associated with a higher incidence of prostate cancer, while the gross domestic product (GDP) (RR = 0.94) was inversely associated with prostate cancer (28). Another global study based on GLOBOCAN 2012 data reported that age-standardized incidence and mortality rates of lung cancer were both directly correlated with human development index (HDI) (r = 0.70, r = 0.67 ), and country-specific GDP per capita (r = 0.24, r = 0.55) (29).
Researchers have reported direct associations between PM2.5 levels and age-adjusted respiratory cancer incidence rates (30). The increasing lung cancer incidence rates in Iran are occurring along with increasing rates of environmental pollution, urbanization, and smoking (31).
According to the WHO report, air pollution, tobacco smoking, radiation, chemicals, and occupational risk factors are responsible for at least 20% of disability-adjusted life years coming from patients with cancer (32). These risk factors are more prevalent in urban than rural settings.
In a study conducted from 2006 to 2010 on 2687 counties in the United States, environmental quality index (EQI) was used as an indicator of cumulative environmental exposures at the county level. Poor environmental quality was directly associated with all-site cancer incidence rates in the total population and male and female subgroups (33). Other studies have shown a strong positive relationship between the incidence of breast and prostate cancer and poor environmental (air, water, soil) quality (33) as well.
The incidence of cancer is also affected by genetic factors. Recent research suggests that specific genetic subtypes can interact with environmental exposures and this can exacerbate the effects of harmful exposures and increase the risk of cancer (33, 34). Our results showed positive associations between prostate cancer incidences and domestic security and stability. Although we did not find any article about the relationship between cancer and domestic security and stability, it is likely that in regions with more security and stability, prostate cancer cases, which are commonly old men, are diagnosed more frequently; whereas in societies with low security and stability, because of a shorter lifetime, engagement in war, violence or poverty, men do not get screened for prostate cancer. A study conducted over 38 years in Finland showed that colon cancer incidence was on average higher among those with high education and high SES compared to those with lower education and low SES (35). In Europe, most studies have reported that colon cancer was more common in high SES groups (35, 36). A systematic review from 18 cohort studies also showed that higher education may be associated with an increased risk of breast cancer, and alcohol use and hormone therapy may play a mediating role (37).
Urbanization has affected public health with complicated mechanisms such as a change in the regional environment, land use, transportation, air quality, food safety, and lifestyle (1).
Urban residents have a faster pace of life and suffer from stress, heavier workload, less physical activity, and unhealthy eating and living habits and this lifestyle can make them more prone to cancer (38). A study in China showed that rapid urbanization changed people’s situation by changing land use, causing air, water, food, and soil pollution, imposing less physical activity, and exposing people to electromagnetic radiation, which can cause cancer (1).
The province’s adherence to the rule of law was well correlated with its cancer incidence, especially in breast, prostate, and leukemia. Corruption plays a detrimental role in healthcare systems and can damage the structure of healthcare systems in providing cancer care. In corrupted societies, where resources are not evenly distributed, poor families are not covered by healthcare and it prevents them from seeking medical advice and getting diagnosed because even if properly diagnosed, they are not able to pay for the high cost of cancer treatment. The devastating effects of corruption on cancer care have been shown in different sections such as healthcare providers, drug and medical equipment distribution, and treatment (39). Klomp and de Haan analyzed 101 countries about the relationship between governance, the health of individuals, and the healthcare sector. Their results showed that after controlling economic and demographic variables, governance was not directly related to the health of individuals; however, governance indirectly influenced health via its positive impact on income and the quality of healthcare (40).
Samuel conducted a study on 96 countries and showed that the higher the countries' level of adherence to the rule of law, the better the health of the population. Health advocates should consider that improvements in implementing the law can improve population health (41).
On the other hand, the systems of reporting epidemiological figures in these higher HDI provinces are generally more robust, and the low incidence of cancer in provinces with low governance might be because of not reporting the cases and not less incidence (29, 42). Hence, data should be interpreted with caution when these incidences are compared across provinces.
5.1. Limitations
This study had some limitations. One of the limitations is the ecological nature of the study, which precludes causality. Our results, however, do reveal an association between provincial macro indicators with levels of cancer incidence. Also, we have to keep in mind that the concept of liveability is population-based and it does not make sense for an individual.
Another limitation of the study was that the Iranian Cancer Registry does not collect comprehensive information on personal characteristics, such as comorbidities, or financial and marital status, and we could not control these variables.
However, this study used and analyzed the most reliable data of cancer and showed the geographical variations of cancer incidence in Iran.
Cancer control strategies should be implemented according to local situations in Iranian provinces and require multisector collaboration across many sectors such as healthcare, medical services, urban planning, education, finance, commerce, regulation, and others. A greater emphasis on primary prevention and early detection is needed to alleviate the effect of aging and population growth on the burden of cancers in Iran.
5.2. Conclusions
Along with the development of urban liveability, the incidence of cancers is increasing in Iran. Cancer control strategies should be implemented especially in settings with higher urbanization. This pattern also shows that urbanization may be adversely affecting human health in ways not fully understood. Further research is needed to improve the health necessities of urban dwellers.