
1. Background
The anticancer drug doxorubicin (DOX) is mentioned to exhibit a choice treating effect on many malignancies, especially hematological ones, but the liver, blood vessels, kidneys, and other organs could be harmfully hurt by the administration of this drug (1). The most vulnerable organ to DOX damage is the liver due to its main metabolic activity. DOX is proved to induce oxygen radicals such as superoxide anions, hydrogen peroxide, and hydroxyl radicals. DOX can inactivate superoxide dismutase and reduce glutathione peroxidase.
The more ROS exhibition, the higher tissue destruction. It is demonstrated that the DOX-derived radicals in the hepatic tissues can create apoptosis. The renal parenchyma may be destroyed by DOX (2). As its toxic effects on the kidneys, vessels, and liver are destructive, it encourages utilization with a warning. Later, it is essential to increase activity against oxidation of the biomolecules accompanied by anti-cancers to modulate side effects.
2. Objectives
Ten ROS molecules could be elaborated by melatonin. Managing Cichorium intybus root extract could enhance renal regeneration from pathogens and drugs.
This manuscript tries to show the effects of the simultaneous administration of chicory and melatonin on reducing kidney tissue lesions of doxorubicin.
3. Methods
3.1. Plant Materials
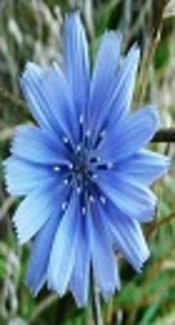
Whole plant chicory with a whole figure was gathered in 2021. Biologists identified the plants. The herb was bathed and placed in an oven to be parched. After parching, the whole herb was ground into a powder by a grind (3).
3.2. Extract Production
3.2.1. Alcoholic Extract Production
The complete plant was ground equally, and removed by the macer process with absolute Ethanol solution in a shaking and mixing container. The extract was distilled, concentrated, and dried. The amount of alcoholic liquid in the whole plant was 18% w/w and stored liquid at -4°C (4).
3.2.2. Dried Extracts Production
Approximately 100 g of C. intybus was put in the methanol (1 liter) for 24 hours and contained after filtration. In the next step, 1 liter of methanol was run on the instance remains, cooked, and purified. The product was added to the earlier primal juice. After adding water, the excess was placed in the chamber and purified. The filtrate was added to the previous crude extract. The boiling and filtering were reoperated, and the boiled water was poured into the extract. The hydroalcoholic juice was parched and frozen (5).
3.3. Animal Treatments
Thirty 20 g to 25 g, balb/c mice were selected for starting the study. After reducing stress, all animals were fed for 14 days. After health confirmation, the animals were haphazardly separated into 5 groups (n: 6).
The research was grouped as control saline (1 mL/kg P.O.); DOX with an injection of doxorubicin as 15 mg/kg I.P. (6) from Cell Pharma; chicory with the administration of the 500 mg/kg (7) C. intybus complete extract following DOX; melatonin with the administration of the 10 mg/kg (8) melatonin following DOX; both: With the administration of the chicory and melatonin as previous doses and manner following DOX.
3.4. Hematological Parameters
Twenty days after surgery, we took blood samples IV, weighed animals, and euthanized them. Factors including WBC, RBC, Blood urea nitrogen (BUN), creatinin (Cr), BUN/Cr, HCT, MCV, Hemoglobin, MCH, and MCHC were evaluated. Also, the cell counter counted Lymphocyte, Neutrophil, Monocyte, Eosinophil, and Platelet numbers. These measures are indicators of kidney (nephrotoxicity) lesions, using an automatic analyzer (Accent 200, China) (9, 10).
3.5. Histopathological Sample Preparation and Evaluation
Kidney tissue samples were fixed in 10% buffered formalin for histological study. The microscopic score was evaluated as 0 = absent. 1 = low or weak; 2 = mild; 3 = moderate; and 4 = high or frequent, and the total score was the basis of judgment (11).
3.6. Statistical Analyses
The data received from the investigation were offered as the mean-SD and analyzed by one-way ANOVA in SPSS 22.
3.7. Ethical Statement
This research was conducted under oversee of the Ethics Committee of Islamic Azad University.
4. Results
4.1. Toxicity
All animals that acquired melatonin and chicory extract maintained good body condition. In the DOX-treated animals, poor body condition and weakness were seen.
4.2. Hematological Parameters
Examination of renal function health factors, BUN, creatinine, and the BUN/Cr ratio showed nothing but the chicory-melatonin group difference with doxorubicin, chicory, and even control. There were no differences between various hematological factors, including the WBC, MCV, MCH, MCHC Lymphocyte, Neutrophil, Monocyte, Eosinophil, and Platelet numbers. In contrast, we showed significant differences in the RBC, HCT, and Hemoglobin factors between various groups. Highly difference was in the RBC phenomena as significant between chicory against DOX, melatonin, and both against chicory and control (Table 1). Also, HCT and Hb were more protected in the chicory alone group than in the melatonin group.
Table 1.
Comparing the Different Hematological Data in Various Groups of the Experiment
| Groups | Control | Doxorubicin | Chicory | Melatonin | Both |
|---|---|---|---|---|---|
| WBC (10E3/µL) | 4.47SD1.31 | 2.96SD0.43 | 3.76SD1.76 | 3.61SD1.60 | 3.70SD1.66 |
| RBC (10E3/µL) | 4.95SD1.12 | 6.20SD0.48 a | 4.67SD0.94 b | 6.64SD0.93 a, c | 6.65SD0.47 a, c |
| BUN | 22.75SD1.5 | 23.67SD3.32 | 23.60SD2.3 | 23.33SD4.08 | 17SD2.73 a, b, d |
| Creatinine (Cr) | 0.36SD0.58 | 0.45SD0.19 | 0.34SD0.1 | 0.49SD0.18 | 0.3SD0.05 |
| BUN/Cr | 64.57SD11.8 | 63.81SD31.13 | 74SD23.61 | 52.71SD18.54 | 57.76SD14.07 |
| HCT % | 23.25SD4.64 | 27.67SD2.50 | 21.80SD3.34 b | 28.83SD3.54 | 29.60SD1.94 |
| MCV (fm) | 47.70SD1.94 | 45.33SD1.72 | 48.34SD3.31 | 44.50SD2.06 | 45.16SD1.75 |
| Hb (g/dL) | 7.15SD2.10 | 9.21SD0.93 | 6.84SD1.55 b | 9.26SD1.14 a | 9.90SD0.60 c |
| MCH (pg) | 14.27SD1.14 | 14.85SD0.73 | 14.58SD0.44 | 14.11SD0.53 | 14.90SD0.644 |
| MCHC (g/dL) | 29.97SD2.83 | 32.76SD1.29 | 30.32SD2.70 | 31.76SD0.62 | 32.96SD0.71 |
| Lymphocyte (10E3/µL) | 63.75SD8.84 | 56.50SD14.59 | 47.20SD12.87 | 57.33SD13.45 | 52.80SD13.00 |
| Neutrophil (10E3/µL) | 34.50SD9.74 | 42.33SD13.99 | 51.20SD12.33 | 41.17SD12.59 | 46.00SD12.74 |
| Monocyte (10E3/µL) | 1.00SD1.15 | 0.50SD0.83 | 0.60SD0.89 | 1.17SD1.32 | 0.20SD0.44 |
| Eosinophil (10E3/µL) | 0.25SD0.50 | 0.67SD0.81 | 1.00SD1.41 | 0.17SD0.40 | 0.80SD0.83 |
| Platelet (10E3/µL) | 692.50SD613.56 | 799.83SD294.77 | 636.20SD316.74 | 687.83SD175.38 | 755.60SD541.70 |
a Difference with chicory group
b Difference with doxorubicin group
c Difference with control group
d Difference with melatonin group.
4.3. Histopathological Evaluation of the Kidneys
The renal section in the control group mice had normal tubules composed of glomerular tufts and cuboidal to column cells in the cortex and simple squamous to vacuolated cuboidal in the medullae. The DOX group showed cell swellings, inflammation, necrosis with nuclear pyknosis, and eosinophilic cytoplasm. DOX group was significantly worse than the others. Melatonin could heal the renal parenchyma better than chicory. Administration of both had the best protecting effect on renal parenchyma. (Figure 1; Table 2).
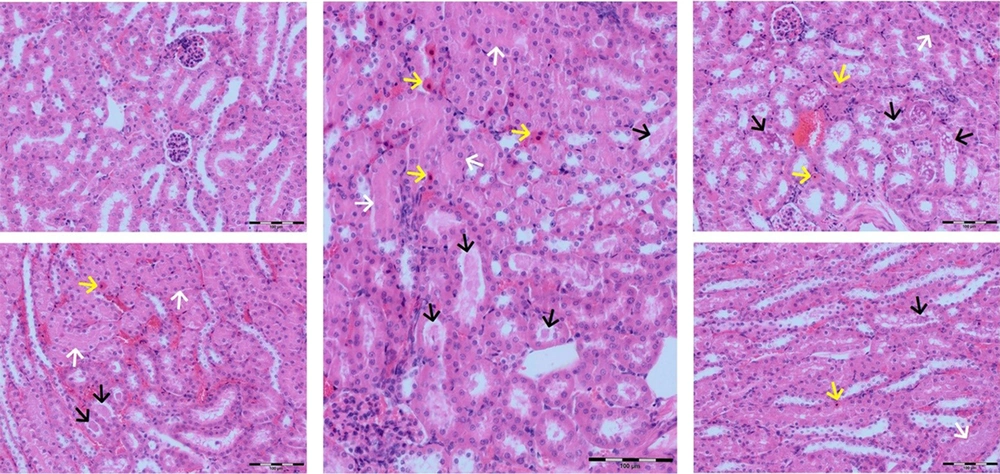
Figure 1.
Photomicrographs of kidneys. Center: Renal tissue from the DOX group is showing cell swelling, numerous single cells necrosis with pyknotic nuclei, leukocyte infiltration, and marked hyaline casts; Upper left: The control group with normal tubular epithelium; Upper right: The chicory group with lesions near DOX group. Lower left: The melatonin group with the lesions was better than the chicory. Lower right: The melatonin-chicory group with the best improvement of the lesions shows mild necrotic changes in the tubular epithelium and mild hyaline casts without leukocyte infiltration (200x; H&E). Yellow arrows: Single-cell necrosis; White arrows: Cell swelling; Black arrows: Hyaline cast.
Table 2.
The Histological Scoring of Renal Tissues from Animals of the Various Groups with DOX Treated a
| Groups | Single-cell Necrosis | Leucocyte Infiltration | Cell Swelling |
|---|---|---|---|
| Control | 0.00 ± 0.00 b | 0.00 ± 0.00 b | 0.00 ± 0.00 b |
| DOX | 2.67 ± 0.51 c | 1.00 ± 0.63 c | 3.57 ± 0.51 c |
| Chicory | 2.00 ± 0.00 c | 1.17 ± 0.40 c | 2.33 ± 0.81 d |
| Melatonin | 1.67 ± 0.51 d | 1.17 ± 0.40 c | 2.67 ± 0.51 d |
| Both | 0.83 ± 0.75 b | 0.33 ± 0.51 | 0.67 ± 0.51 d |
a They were treated with chicory extract and melatonin. Scoring was performed as 0 = absent; 1 = low or weak; 2 = mild; 3 = moderate; and 4 = high or frequent, and also the total score. Data are mean and SD and analysis was Bonferroni one-way analysis of variance test.
b Difference with the doxorubicin group
c Difference with the control group
d Chicory-melatonin
5. Discussion
Doxorubicin could start ROS in renal tissues. The kidneys cannot eliminate it by the body-stored antioxidants (12). Renal epithelial cells are destroyed when DOX is metabolized by hepatic enzymes rich in mitochondria (13). The toxic effects of a dose of 25 mg/kg of Dox on the kidneys are protein wasting casts, vacuolar degeneration, and necrosis of tubular cells after 5 days post IP injection (14). The other experiment in rats demonstrated that a 7.5 mg/kg intravenous dose of Dox could increase the kidney/body ratio and kidney weight. This heavy dose also increased serum urea, creatinine, cyclooxygenase-2, tumor necrosis factor-alpha levels, and caspase-3 expression. Finally, the serum albumin, superoxide dismutase, and glutathione were reduced compared to the control group (15). Some investigators found increased apoptotic and inflammatory agents, alteration of the Bax/Bcl-2 ratio, and high expression of the NF-κB p65 genes in the kidneys of babl/c mice due to DOX toxicity (16-18). The ischemic injury could be reduced by melatonin administration. Some investigators have shown that the endothelium may be damaged by ischemia or chemotherapy. The healing of the renal lesions will not recover adequately in the doxorubicin-received animals (19). Melatonin could stop cancer growth. Melatonin may protect cells from anticancer drugs (20). Numerous investigations have demonstrated that chicory enhances the recovery of the injuries of ROS in the kidneys (21, 22). It was proved that the increase in BUN/creatinine ratio was not affected by hydration status. The BUN/creatinine ratio is beneficial for gastrointestinal bleeding detection. A ratio higher than 100 is diagnostically related to upper gastrointestinal bleeding, and ratios lower than 100 were observed with lower intestinal hemorrhage. An increased ratio means not earning sufficient circulation of renal tissues (23). The increased serum BUN and creatinine levels could be a good indicator of renal toxicity. In this study, DOX caused nephrotoxicity, increasing BUN and creatinine serum levels, similar to those previously reported. The increased serum creatinine and BUN level are due to DOX toxicity. It actively increases the ROS in cortex tubules, results in tubular injury, and alters renal circulation (24). Examination of renal function health factors, BUN, creatinine, and the BUN/Cr ratio showed nothing but the chicory-melatonin group difference with doxorubicin, chicory, and even control. This difference showed that the administration of chicory and melatonin is much more important than the administration of chicory only in eliminating kidney lesions and its better function. There were no differences between various hematological factors, including the WBC, MCV, MCH, MCHC Lymphocyte, Neutrophil, Monocyte, Eosinophil, and Platelet numbers. This finding means the chicory and melatonin could not protect them against DOX toxicity. In contrast, we showed significant differences in the RBC, HCT, and Hemoglobin factors between various groups. Highly difference was in the RBC phenomena as significant between chicory against DOX, melatonin, and both against chicory and control (Table 1). These findings mean that chicory and melatonin could protect blood RBCs. Also, HCT and Hb were more protected in the chicory alone group than in the melatonin group. These two later factors were more than the control group in the melatonin-chicory group.
This article supposes that melatonin could reduce hydropic degeneration of the renal tubular cells. A 10 mg/kg melatonin curing with DOX can treat hydropic degeneration of the liver; 500 mg/kg chicory administration may cure hydropic degeneration and various tubular casts. Melatonin and chicory can inhibit ROS production and control cell damage by responding to ROS (25). The cooperation of chicory and melatonin prevented renal lesions in this study. Microscopic findings of DOX are hydropic degeneration, necrosis, and inflammation (26). In this investigation, the DOX group lesions were severe hydropic degeneration, moderate necrosis of tubular cells, mild leukocyte infiltration, and numerous intratubular hyaline casts. Less pathological findings were demonstrated in all treating groups than those seen in the Dox group alone. There are significant differences between chicory-melatonin versus other groups in protecting ability against DOX-induced lesions (Table 2; Figure 1).