


1. Background
Cancer represents a major global health challenge with a high incidence rate worldwide (1). Gastric cancer (GC) is the fifth most common type of cancer globally (2). However, once the cancer has metastasized to the serosa, the 5-year survival rate is below 5% (3). Medical professionals use intelligent computer applications to improve clinical decision-making, thereby reducing the potential for errors and saving time (4). Given the low survival rate, it is critical to identify appropriate methods for predicting cancer (1). These methods rely on the effective factors identified in GC. Thus, selecting effective factors to enhance the performance of prediction models is crucial (5).
Identifying the risk factors associated with GC is crucial to enable early diagnosis. Given the large number of risk factors involved, it is necessary to use feature selection methods to reduce the number of factors (6). Feature selection involves identifying relevant features for a given problem while discarding redundant or irrelevant ones, to improve classification accuracy (7). The aim of feature selection methods is to decrease the number of necessary features while improving classification accuracy (8). This method comprises 4 approaches, namely filter, wrapper, embedded, and ensemble (9).
Li et al. (10) used the minimal redundancy maximal relevance (mRMR) algorithm, sequential forward selection (SFS), and K-nearest neighbor classifier to classify lymph node metastasis in GC. Thara and Gunasundari used the infinite feature selection mechanism (IFS) and similarity preserving feature selection (SPFS) to predict GC (11, 12). Qi et al. (13) developed a new feature selection method, using sequential feature selection. To predict Parkinson's disease, Saeed et al. employed various filter and wrapper methods to select features (14). Got et al. achieved superior performance to that obtained using each feature selection method separately by using the whale optimization algorithm and the filter-wrapper feature selection method (15). Singh and Singh used a hybrid filter-wrapper feature selection method that involved 4 stages of validation, filter, wrapper, and classification with an appropriate model for disease diagnosis, resulting in acceptable performance (8). Mandal et al. developed a 3-stage wrapper-filter feature selection framework involving an ensemble formed by 4 filter methods to classify diseases (16). Afrash et al. (17) used the relief feature selection algorithm with 6 classifiers to predict the early risk of GC.
Many previous studies have used expensive methods such as imaging and endoscopy. Some of these methods also have harmful effects on human health. Therefore, in this study, data related to the lifestyle of individuals with GC and healthy individuals were used because these data were collected without the need for expensive and harmful methods. However, since many variables in the field of lifestyle affect the incidence of GC, selecting effective features is of great importance. Therefore, to identify effective features, feature selection methods including filter, wrapper, and filter-wrapper have been compared on this type of data. For this comparison, 4 classifiers include k Nearest Neighbor (kNN), Decision Tree (DT), Random Forest (RF), and Gradient-Boosted Decision Trees (GBDT).
Based on this study, there are a few potential technical gaps that could be addressed: (A) Lack of effective feature selection methods: While there have been previous studies that have used feature selection methods for predicting GC, there may still be gaps in the effectiveness of these methods. This study aims at comparing and evaluating different feature selection methods to identify effective ones for predicting GC based on lifestyle data. (B) Limited use of lifestyle data for predicting GC: Many previous studies have used expensive and invasive methods such as imaging and endoscopy for predicting GC. However, our study aims at using lifestyle data, which is less invasive and more readily available. (C) Need for improved prediction accuracy: GC has a low survival rate, particularly once it has spread to the serosa. Therefore, accurately predicting the risk of GC is critical for early diagnosis and treatment. This study aims at identifying effective feature selection methods to improve the accuracy of predicting GC.
In addition to the introduction section, which discusses the objectives, rationale, and related research, this study consists of 4 other sections, including Methods, Results, Discussion, Conclusions, and Introducing the Tool. In the Methods section, we introduced the methodology used in this study, including dataset preparation and various feature selection methods. In the Results section, we presented the results of accuracy, precision, recall, F1-score, and AUC-ROC based on the calculations performed. The Discussion section compared and examined the results of this study with other similar research. The Conclusions section discussed the practical implications of the results obtained from this study. Finally, in Introducing the Tool section, we introduced the software tool used in this study.
2. Objectives
This study aimed at comparing the performance of various feature selection methods in identifying influential factors related to GC based on lifestyle using machine learning models. The ultimate goal was to enhance early detection and treatment of the disease.
3. Methods
In the initial phase of the study, a dataset of the hospitals and clinics affiliated with Shahid Beheshti University of Medical Sciences and Health Services (SBMU) was utilized. Subsequently, feature selection techniques were employed to identify personal lifestyle-related factors that have a significant impact on GC. The model was, then, validated, using the k-fold method. Following this, each of the classifier models, including DT, RF, GBDT, and kNN was developed and assessed, using the collected data on each of the influential factors. In this study, we used TRIPOD reporting guidelines. The implementation of the designed model was carried out through the use of Python and Jupyter Tool V. 6.4.5.
3.1. Dataset
This study is extracted from the Ph.D. thesis entitled "Designing an intelligent model in Predicting the Pattern of GC in Iran". This research has been approved by Council No. 36 of the Vice-Chancellor in Research Affairs of Islamic Azad University, Science and Research Branch. Then, the 98th Committee of Vice-Chancellor in Research Affairs of SBMU approved it.
In the present study, we used existing medical records, all patients' information was considered confidential, and their identity information was eliminated. Moreover, written consent was received from all patients in this dataset before the authors received it. Therefore, a number was allocated to each patient, and this number was entered into the software anonymously. So, information that leads to the disclosure of patients' identities was not published by the main study team. The data were coded and labeled in a way that masked the identities of the predictors and outcome variables. Each variable was assigned a unique identifier that was unrelated to its content, ensuring that the assessors remained blind to the specific predictors being assessed.
The thematic scope of the study consists of people with GC covered by the hospitals and clinics of SBMU. The spatial scope of the study encompasses the selected hospitals and clinics of this hospital. Besides, the temporal scope of the study consists of the period 2013 - 2021.
The dataset was two classes, including people with and without GC. Based on this dataset, 51 factors were identified as effective factors (Table 1). Since some of these factors should have been categorized into several sub-factors to enter the software, we used one-hot encoding and the number of these factors has reached 86 effective factors. One-hot encoding is a commonly employed technique in machine learning for handling categorical data.
Table 1.Factors Affecting Gastric Cancer Based on the Personal Lifestyle of Individuals a
| No. | Factors | No. | Factors | No. | Factors |
|---|---|---|---|---|---|
| 1 | Sex | 22 | History of helicobacter pylori | 43 | Consumption of spicy foods |
| 2 | Age | 23 | History of acid reflux | 44 | Consumption of refined beans |
| 3 | Height | 24 | Radiation history | 45 | Consumption of fried foods in oil |
| 4 | Weight | 25 | Stomach ache | 46 | Consumption of carbonated beverages |
| 5 | Residence | 26 | High blood pressure | 47 | Consumption of vegetables |
| 6 | Education | 27 | High blood fats | 48 | Fruit consumption |
| 7 | physical activity (daily) | 28 | Feeling discomfort in the abdomen after a meal | 49 | Smoking |
| 8 | Alcohol | 29 | Flatulence | 50 | Job |
| 9 | Breakfast | 30 | Early satiety | 51 | Monthly family income |
| 10 | High-salt diet | 31 | Belching | ||
| 11 | Eating fast | 32 | History of aspirin use | ||
| 12 | Dust exposure | 33 | History of taking stomach pills | ||
| 13 | Facing with cement | 34 | History of metformin use | ||
| 14 | Exposure to metals | 35 | History of use of glipizide, gliclazide and glibenclamide | ||
| 15 | Exposure to volcanic material | 36 | Consume red meat | ||
| 16 | Exposure to air pollution | 37 | Consumption of fish | ||
| 17 | Family history of gastric cancer | 38 | Tea consumption | ||
| 18 | Family history of other cancers | 39 | Consumption of hot drinks | ||
| 19 | History of esophageal cancer | 40 | Consumption of pickles | ||
| 20 | History of gastric ulcer | 41 | Consumption of frozen foods | ||
| 21 | History of gastric surgery | 42 | Consumption of salty foods |
a In this table, 51 factors affecting gastric cancer are shown, which were collected based on the data of gastric cancer patients in the hospitals of SBMU.
Moreover, the characteristics of the study population are listed in Table 2. In our dataset, missing data were observed to be zero for all variables.
Table 2.Characteristics of the Study Population a
| Factors | People with Gastric Cancer (n = 173) | People without Gastric Cancer (n = 157) |
|---|---|---|
| Female | 115 (66.5) | 103 (65.6) |
| Age, y | 51 ± 18.4 | 51 ± 18.3 |
| Height, cm | 170 ± 10.7 | 167 ± 10.7 |
| Weight, kg | 70 ± 17.4 | 71 ± 19.93 |
a Values are expressed as No. (%) or mean ± SD.
3.2. Feature Selection
There are two dimensionality reduction methods: feature selection and extraction. The feature selection method chooses solely a set of the first options that contain relevant info. In distinction, feature extraction transforms the input area into a lower-dimensional mathematical space to preserve the foremost relevant information. New opportunities will not be created throughout feature selection; however, through feature extraction (18).
Using dimensionality reduction techniques must be selected to prevent over-fitting caused by a large number of factors and a small sample size. The feature selection method is a strategy for preprocessing high-dimensional data that can lead to more straightforward, more understandable, and better-performing models in data mining methods (19).
There are 3 types of feature selection methods. The first type is the “Filter method”, which operates independently of learning algorithms. The second type is the “Wrapper method”, which depends on learning algorithms, and the third type is the combined “Embedded method”, which selects features based on a specific learning algorithm (20).
Filter and wrapper techniques are the two most typical feature selection techniques. The benefits of those models are unit standard procedure cost and smart generalizability. Researchers have agreed that no "best" (absolute) technique exists for feature selection. Thus, this study uses the “Filter" and "Wrapper” methods." A comparison of the execs and cons of those two ways has been summarized in Table 3.
| Method | Filter Method | Wrapper Method |
|---|---|---|
| Pros | Independent of learning model Fast execution; appropriate for high dimensional data; Generalizability | Better performance attainability; considering the interaction between features; Recognizing feature interactions of higher order. |
| Cons | Ignorance of Interactions between features; unable to handle the redundancy problem; Lack of interaction with the learning algorithm | High cost in terms of execution times; susceptible to overfitting; Creating a learning algorithm from scratch for each subset. |
a A comparison of the advantages and disadvantages of filter and wrapper methods is shown.
3.2.1. Filter Method
Filtering methods are usually used as a pre-processing step. The filter method is independent of any machine learning algorithm. Instead, features are selected based on their scores in various statistical tests for their correlation with the outcome variable (Table 4). Here the correlation is a subjective term.
Table 4.Classification of Statistical Tests Based on the Type of Features and the Response of Feature Selection Methods a
| Feature/Response | Continuous | Categorical |
|---|---|---|
| Continuous | Pearson’s correlation | LDA b |
| Categorical | ANOVA | Chi-square |
a Statistical tests are determined based on the type of features and the response of the methods. For example, if the selected features and the response of the method are categorical, the chi-square test is used.
b Linear discriminant analysis
Since the features and response of the feature selection method are categorical, the chi-square statistical test should be used, whose formula and the notation in the equation are as follows:
∑: The summation symbol, which indicates that the values inside the parentheses should be summed up.
C: Degrees of freedom, which is the number of categories minus one.
3.2.2. Wrapper Method
In wrapper methods, our aim is to utilize a selected set of features to train a model. By analyzing the insights gained from the initial model, we make decisions regarding the addition or removal of features within the subset. This method includes the following three groups:
- Forward Selection
- Backward Elimination
- Recursive Feature Elimination
3.2.3. Embedded Methods
Embedded methods combine the qualities of filter and wrapper methods. It is implemented by algorithms that have built-in feature selection methods.
3.3. Classification Algorithms
3.3.1. Decision Tree
A decision tree (DT) is among the most frequently used algorithms in data mining, where DT serves as a predictive model applicable to both regression and classification models. According to the DT structure, predictions generated by the tree are explained as a set of rules. Each path from the root to a DT leaf represents a classification rule. Finally, the desired leaf is labeled with the class with the highest number of records.
3.3.2. Random Forest
DT serves as one of the most popular models in hybrid methods. Robust models consist of several trees, known as forests. The trees making up a forest can be shallow or deep. Shallow trees have low variance and high bias, rendering them suitable for hybrid methods. In contrast, deep trees have low bias and high variance, making them ideal for bagging methods focused on reducing conflict.
3.3.3. Gradient-Boosted Decision Trees
The gradient-boosting algorithmic program is among the foremost powerful machine learning algorithms introduced over the past 20 years. Though this algorithmic program was designed to wear down classification issues, it can even be applied for regression. Gradient boosting aimed at developing a technique for combining the output of many "weak" classifiers to get a strong “committee”.
The purpose of the gradient boosting algorithmic program is to consecutive apply the weak classification algorithmic program to repeatedly changed versions of the information, thereby manufacturing a sequence of weak classifiers.
3.3.4. K-Nearest-Neighbor
The nearest neighbor method (aka kNN) is an instance-based learning method and is among the simplest ML algorithms. The classification of a sample in this algorithm is based on a majority (plurality) vote from its neighboring samples. The sample is assigned to the most prevalent class among its k nearest neighbors, where k is a small, positive integer. When k equals 1, the sample is directly assigned to the class of its closest neighbor. It is important to choose an odd value for k to prevent any ties in the classification process.
The performance of each of the above classifiers is compared, using the area under the ROC curve and F1 curves, calculated using the following formulas and notations:
TP: True Positive (refers to the number of correct positive predictions made by the model)
TN: True Negative (refers to the number of correct negative predictions made by the model)
FP: False Positive (refers to the number of incorrect positive predictions made by the model)
FN: False Negative (refers to the number of incorrect negative predictions made by the model)
4. Results
4.1. Feature Selection
Filter-wrapper hybrid methods are used because there is no best technique for feature selection. So, the filter technique is applied first to the practical issue knowledge collected; hence, the wrapper technique is applied to the output. Four standard classifiers utilized in similar alternative studies (DT, RF, GBDT, and kNN) were evaluated. Finally, 3 methods (filter, wrapper, and filter-wrapper methods) were compared.
4.1.1. Filter Method
In this step, data collected on 86 efficiency factors are entered into the filter part of the model. Since the features and response of the filter method are categorical, we have used the chi-square statistical test. Therefore, features that have a P-value above 0.05 have been removed due to their lower correlation with the response of the filter method.
4.1.2. Wrapper Method
In this step, 23 efficiency factors determined by the filter method are imported into the wrapper section of the model, producing the following output. The procedure involves initially considering all features and subsequently eliminating the least significant feature in each iteration, aiming at enhancing the model's performance. This process continues until no further improvement is discernible through feature removal. Finally, Linear Support Vector Classification has been used as a classifier model.
Figure 1 illustrates the dispersion of the 23 efficiency factors generated by the filter model according to their relative importance.
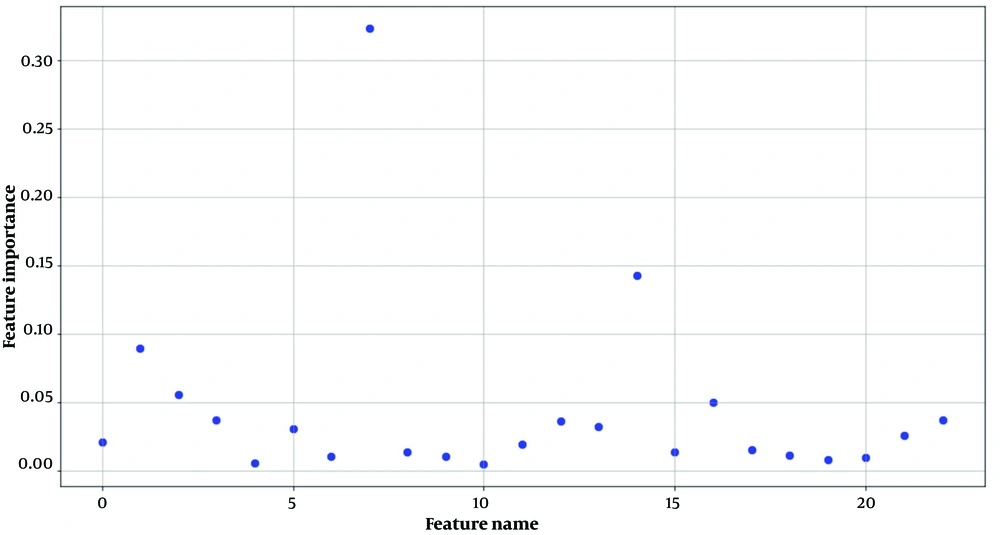
Figure 1.
Dispersion diagram of factors selected by the wrapper method.
Accordingly, 5 factors were identified influencing GC based on personal lifestyle including education, physical activity (days per week), history of gastric surgery, consumption of salty foods, and consumption of spicy foods.
4.2. Cross-Validation (CV)
Several parameters in many classification models can control complexity. The good values for the complex parameters were found to achieve the best prediction performance in the new data, resulting in the best model. To achieve this objective, the input data undergoes a partitioning process known as k-fold cross-validation, where it is split into k = 10 sets comprising both training and testing datasets.
4.3. Implementing Classifier
The performance of each of the above classifiers was compared, using the area under the ROC curve and F1 score. As shown in Table 5, when the filter-wrapper method is used, the area under the ROC curve and F1 score are higher (95.8%, 94.7%) than the other methods. Furthermore, it can be seen that in the Filter-Wrapper method, the GBDT classifier performs better. After the Filter-Wrapper method, the RF classifier and wrapper method have more areas under the ROC curve and F1 score (95.7%, 93.6%). Finally, the filter method and the RF classifier have more areas under the ROC curve and F1 score (95.6%, 91.7%) than other classification methods of this method. This model is shown in Figure 2. Moreover, the area under the ROC and PR curves are presented in Appendices 1 to 4 in the Supplementary File.
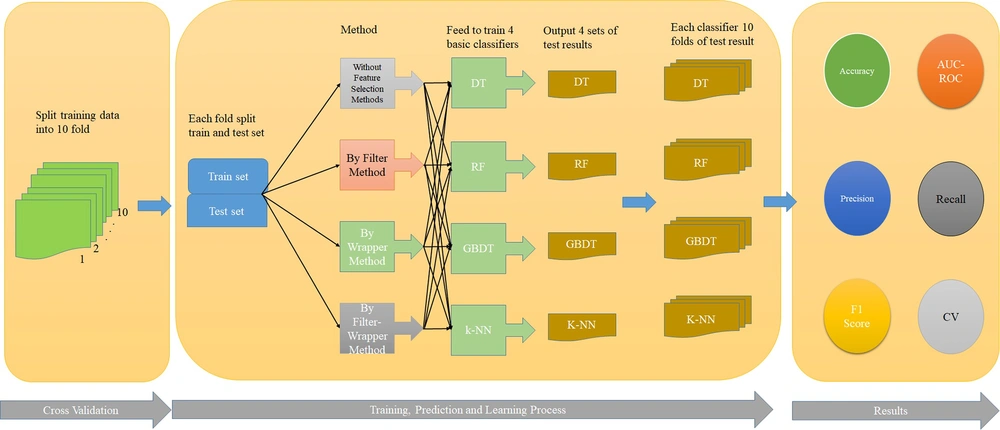
Figure 2.
Components of the model
Table 5.A Comparison of the Classifiers for Performance
| Method and Classifier | CV | Precision | Recall | F1 Score | Accuracy | AUC-ROC |
|---|---|---|---|---|---|---|
| Without feature selection methods | ||||||
| GBDT | 0.980 | 0.960 | 0.952 | 0.947 | 0.962 | 0.952 |
| RF | 0.977 | 0.960 | 0.953 | 0.917 | 0.994 | 0.956 |
| kNN | 0.862 | 0.734 | 0.734 | 0.680 | 0.810 | 0.897 |
| DT | 0.936 | 0.939 | 0.915 | 0.899 | 0.939 | 0.915 |
| By filter method | ||||||
| GBDT | 0.982 | 0.960 | 0.949 | 0.942 | 0.958 | 0.948 |
| RF | 0.984 | 0.960 | 0.952 | 0.929 | 0.978 | 0.952 |
| kNN | 0.953 | 0.859 | 0.906 | 0.857 | 0.965 | 0.952 |
| DT | 0.947 | 0.949 | 0.940 | 0.937 | 0.947 | 0.939 |
| By wrapper method | ||||||
| GBDT | 0.971 | 0.939 | 0.954 | 0.940 | 0.971 | 0.955 |
| RF | 0.977 | 0.939 | 0.958 | 0.936 | 0.984 | 0.957 |
| kNN | 0.961 | 0.889 | 0.906 | 0.857 | 0.963 | 0.948 |
| DT | 0.909 | 0.909 | 0.932 | 0.928 | 0.940 | 0.930 |
| By filter-wrapper method | ||||||
| GBDT | 0.976 | 0.939 | 0.958 | 0.947 | 0.973 | 0.958 |
| RF | 0.976 | 0.929 | 0.954 | 0.941 | 0.969 | 0.955 |
| kNN | 0.972 | 0.919 | 0.950 | 0.934 | 0.969 | 0.955 |
| DT | 0.928 | 0.929 | 0.940 | 0.935 | 0.950 | 0.936 |
Abbreviations: GBDT, gradient-boosted decision trees; RF, random forest; Knn, k nearest neighbor; DT, decision tree.
5. Discussion
In this study, we proposed a filter-wrapper hybrid method for feature selection in predicting GC based on personal lifestyle. Our results showed that the GBDT classifier using the filter-wrapper method outperformed other classifiers with a higher area under the ROC curve (95.8%) and F1 score (94.7%). This method can reduce costs and prevent physical complications compared to endoscopic image-based diagnosis.
Comparing our results to previous studies, we found that our method performed better than other classifiers and feature selection methods. For example, Biglarian et al. (22) created a neural network model with an accuracy of 85.6%. 436 GC patients, who underwent surgery between 2002 and 2007 at Taleghani Hospital in Tehran, Iran were included in the study. Feng et al. (23) achieved an accuracy of 76.4% by using 490 patients, who were diagnosed with GC between January 2002 and December 2016 in diagnosing GC and CT images. Zhu et al. (24) achieved an accuracy of 89.16 % by using the CNN model to diagnose GC based on endoscopy images. A total of 993 endoscopic images of GC tumors were acquired from the Endoscopy Center of Zhongshan Hospital for their study. Wu et al. (25) reached an accuracy of 78.5% by using deep learning models and endoscopy images. The study utilized a dataset comprising 100 consecutive patients who underwent magnifying narrow-band (M-NBI) endoscopy at Peking University Cancer Hospital between June 9, 2020, and November 17, 2020.
Taninaga et al. (26) conducted a study at a single facility in Japan, involving 25 942 participants who underwent multiple endoscopies between 2006 and 2017. They employed the XGBoost algorithm to predict GC and achieved an accuracy rate of 77.7%. Amirgaliyev et al. (27) compared 4 following algorithms: Logit, k-NN, XGBoost, and light GBM, and concluded that Boost has better accuracy (95%) than other algorithms. Mortezagholi et al. (28) compared 4 following algorithms: SVM, DT, and naive Bayesian, and concluded that SVM has better accuracy (90.08%) than other algorithms.
The filter-wrapper hybrid method was used in our study because it combines the advantages of filter and wrapper methods. We first removed irrelevant features based on the P-value defined in the filtering step, then imported the remaining features into the wrapper model to make the model run faster. Finally, 5 features were selected as factors influencing GC based on personal lifestyle.
In conclusion, our study provides a promising approach for predicting GC based on personal lifestyle, using the GBDT classifier and the filter-wrapper hybrid method. The proposed method can help reduce the cost and physical complications of endoscopic image-based diagnosis. We hope that our findings will contribute to future research in this field.
5.1. Conclusions
Cancer is a major health issue that is also one of the leading causes of death around the world. GC is one of the most common types of cancer. Because many factors influence GC, identifying the most important factors is necessary. On the other hand, reducing the number of factors by feature selection methods can increase the performance of predicting models.
The factors affecting GC were identified based on personal lifestyle, according to the methods used including filter, wrapper, and filter-wrapper methods. Then, 4 classifiers were created, using the feature selection methods. The results revealed that the developed filter-wrapper method and GBDT classifier outperformed the higher performance than other classifiers and feature selection methods. As a result, physicians can use this model as a decision support system (DSS) to make preliminary identifying GC risk factors. Further, by developing predictive models, they can predict GC probability based on factors related to people's lifestyles.
5.2. Introducing the Tool
We used Python as the programming language to develop the proposed GBDT classifier and filter-wrapper method. Python is a popular choice for machine learning due to its simplicity, versatility, and rich libraries that offer a wide range of functionalities for machine learning applications. We utilized Jupyter Notebook, an open-source web application, to generate and distribute documents that incorporate live code, equations, visualizations, and narrative text. This allowed us to organize and document our work effectively and share it with other researchers in a reproducible manner.
Additionally, we utilized SciKit-learn, a widely-used Python library for machine learning, which offers effective tools for data mining and analysis. In the implementation, we modified some of the default parameters in the classifiers to obtain the best possible results for our dataset. We also utilized various Python libraries such as pandas, Numpy, and Matplotlib for data processing, manipulation, and visualization.
We acknowledge that the codes used in this study are available from the corresponding author upon reasonable request.




