1. Background
Patient education (PE) is a central component in the self management of diabetes complications in both prevention and treatment (1-3). It is one of the major management strategies for prevention and treatment of diabetic foot ulcer (DFU). Patient involvement is vital for the successful care of DFUs. The primary task of the health care team is to boost patient’s self confidence, improve patient awareness and provide support. Usually, patients and their families provide 95% of the care needed to manage diabetic complications (4).
Poor knowledge of foot care practices is an important risk factor for foot problems among diabetics. Studies have demonstrated deficiencies in knowledge and practices regarding foot care, particularly among rural populations with diabetes (5). Recent Cochrane reviews found that foot care knowledge and self-reported patient behavior appear to be positively influenced by education (6, 7).
Patient information leaflets (PILs) are globally accepted instruments to educate patients regarding diseases, medications, and lifestyle modifications (8). Pictogram-based PILs (P-PILs) are the advanced version of PILs (9-11). When designing PILs, the most important elements to be considered are literacy and the individual’s comprehension level. Good readability, layout, and design are important factors for developing PILs (12-14).
User-testing is intended to assess the readability of a document by a group of selected test subjects (13). User-testing ensures that the information is legible, clear, and easy to use, hence patients could locate and understand vital information within the PILs (13, 15-17). An internationally accepted Baker able leaflet design (BALD) criteria was employed for good design characteristics of PILs. A well-designed PIL with good readability scores assists patients to comprehend the content of PILs that may in turn improve their knowledge, attitude and practices (KAP) towards disease management (18).
2. Objectives
This study aimed at preparing and investigating the validation of PILs and performing readability testing of PIL for DFU patients.
3. Methods
3.1. Preparation of Patient Information Leaflet
The PIL was prepared by referring different model leaflets, which were available from various online sources such as “Patient UK”, www.diabeticfoot.org.uk, and www.diabetes-healthnet.ac.uk (19-21). “Diabetes in Scotland” website was used to compare different versions of published leaflets (22). Information was also gathered from resources, such as “Micromedex”, “Up-to-date”, “Medline”, and “Medscape” database (23). Content of the PIL included advice on daily care, dressings, footwear, and treatment of DFUs. The PIL was prepared based on the standard guidelines (10, 15). The content, design, and pictograms of the PIL were validated by an expert committee consisting of a physician, a surgeon, and 3 academic pharmacists. The changes were made in the PIL as per the expert committee’s directions for content validation. The BALD method was employed to assess the layout and design characteristics of PIL. The validated English version of PIL (Figure 1) was translated to Kannada, the local language, by a language expert. The process of translation included 3 steps; forward translation, backward translation, and finally patient-testing.
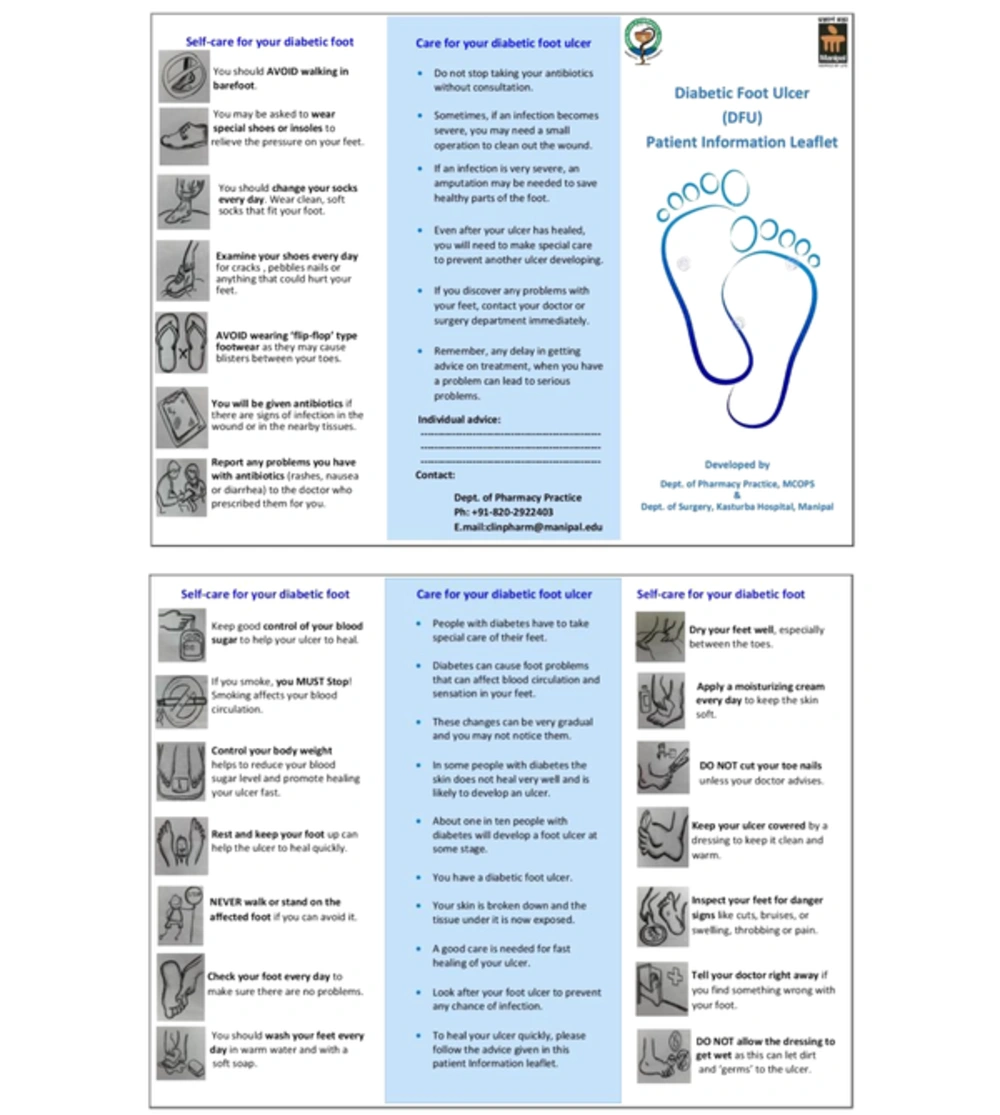
Figure 1.
Patient Information Leaflet for DFU (English)
3.2. Assessment of Readability of Patient Information Leaflet
Readability of the developed PIL was evaluated by 2 method readability formula, Flesch reading Ease/Flesch-Kincaid grade level (FRE/FK-GL) and user-testing (10, 15, 24, 25).
3.2.1. Flesch /Flesch-Kincaid Readability Test
The study used an adult literacy readability calculator, known as the ‘FRE’ and the ‘FK-GL’ to estimate the ability required to read the PIL, using a formula based on sentence length and frequency of polysyllable words in the content. The FRE score rates texts on a 0 to 100 point scale. A higher score indicates that the document is easier to read and understand (24).
3.2.2. User-Testing Readability Test
Readability of the PIL was also assessed by the user-testing method (10). A user-testing questionnaire, both English and Kannada, consisting of 10 closed-end (Yes/No) questions, was prepared based on the content of the PIL. The questionnaire was validated for face validation before assessing the knowledge of the patients. During user-testing, the questionnaire was administered to the DFU patients for assessing baseline knowledge. Next, PIL of either English or Kannada version was given to the patients, based on their choice, and they were allowed to read the PIL for 20 minutes. Next, the patients were again administered the user-testing questionnaire to re-assess the knowledge. At the end, the response was evaluated using the following formula.
After knowledge assessment by user-testing, a questionnaire was used in both English and Kannada to assess user-opinion regarding the PIL, on content, layout, and design. The questionnaire consisted of 4 questions with a score ranging from 1 to 5. The interpretation of the final scores is given below. User-opinion questionnaire was validated by the expert committee in a similar fashion. Test-retest reliability of the user-testing and user-opinion questionnaires were assessed with a sub-sample of 20 randomly selected DFU patients, for which, Kannada and English versions of both questionnaires were administered twice, a week apart.
The interpretation of the user-opinion scores was as follows:
Good: “16 - 20” score
Average: “10 - 15” score
Poor: “< 10” score
3.3. Study Design and Subjects
A quasi-experimental pre-and post-design evaluation of PILs within the intervention group (IG) without a control group (CG) was carried out by 34 DFU patients with prior approval of institutional ethical clearance obtained from Kasturba hospital (KH), Manipal, India (IEC 143/2012). The inclusion criterion of the study was recent diagnosis of DFU and provision of a written informed consent. Socio-demographics, such as age, gender, and educational status of the patients were collected, in addition to economic status.
3.4. Statistical Analysis
The intra-class correlation coefficients (ICC) were computed to assess the test-retest reliability of both user-testing and user-opinion questionnaires. The ICC values ≥ 0.9, 0.7 to 0.89, and < 0.7 were considered as highly reliable, moderately reliable, and weakly reliable, respectively. Descriptive statistics were used to summarize the data. The user-testing scores, both baseline and after 20 minutes, were compared using paired t test. P values < 0.05 were considered statistically significant. Data were entered and analyzed using SPSS version 20.0 software.
3.5. Sample Size
The minimum sample size of the study was calculated as 33, based on the change in patient’s knowledge of user-testing scores from baseline to post-intervention score. Sample size was calculated using nMaster software with the following formula.
Where,
Mean of the two standard deviations (σ) = 10
Z1 - α/2 for α (5%) = 1.96
Z1 - β for 80% power = 0.84
Minimum significant difference in the two groups (d = 5)
4. Results
4.1. FRE/FK-GL Readability Test Score
During the development of PIL, readability was assessed using an online readability calculator. Readability of the PIL was reassessed after periodic modification, demonstrating steady improvement in readability scores after each modification. The best FRE score and FK-GL scores were 73.9 and 6.1, respectively (Table 1).
Table 1.
PIL Readability Tests Score (Final Version)
| Readability Formula | Grade |
|---|---|
| Flesch-Kincaid grade level | 6.1 |
| Gunning-Fog score | 8.5 |
| Coleman-Liau Index | 10.5 |
| SMOG index | 6.3 |
| Automated readability index | 5.9 |
| Average grade level | 7.5 |
Abbreviation: SMOG: Simple Measure of Gobbledygook.
4.2. Leaflet Design
The mean BALD assessment score for English version and Kannada version of PIL were 27 and 26, respectively.
4.3 User-testing readability study
4.2.1. Demographics of Study Subjects for User-Testing and User-Opinion of PIL
Thirty-four newly diagnosed patients with DFU were included in the user-testing. Demographic details of the patients are shown in Table 2.
Table 2.
Demographic Details of Patients with DFU (N = 34)a
| Parameters | Values |
|---|---|
| Age (Mean ± SD), y | 58.3 ± 7.4 |
| Gender | |
| Male | 26 (76.5) |
| Female | 08 (23.5) |
| Educational status | |
| Primary school | 06 (17.7) |
| Middle school | 08 (23.5) |
| High school | 14 (41.2) |
| Intermediate | 03 (8.8) |
| Graduate | 03 (8.8) |
| Socio-economic status | |
| Upper | 02 (5.9) |
| Upper middle | 05 (14.7) |
| Lower middle | 12 (35.3) |
| Upper lower | 08 (23.5) |
| Lower | 07 (20.6) |
Abbreviation: SD, Standard Deviation.
aValues are expressed as No. (%).
4.2.2. User-Testing and User-Opinion Scores of the PIL
Out of 34 patients, 20 (58.8%) preferred Kannada PILs and 14 (41.2%) preferred English PIL. The overall pre and post user-test on knowledge assessment mean scores of the PIL significantly improved from 43.4 to 69.7 (Table 3). Overall user-opinion on legibility and content of the PIL was reported as good by 82.4% (Table 4).
Table 3.
User-Testing Scores of Patient Information Leaflets a
| Type of PIL Users | Pre-test Score | Post-test Score | Mean Difference ±SD | P Value |
|---|---|---|---|---|
| English (n = 14) | 45.8 ± 10.6 | 74.3 ± 11.5 | 28.5 ± 11.1 | 0.0001 |
| Kannada (n = 20) | 41.1 ± 11.4 | 65.1 ± 10.9 | 24.0 ± 9.8 | |
| Overall (n = 34) | 43.4 ± 9.5 | 69.7 ± 11.3 | 26.3 ± 10.5 |
aData are presented as mean±SD.
Abbreviation: SD, Standard Deviation; PIL, Patient Information Leaflet.
Table 4.
User-Opinion Scores of Patient Information Leafletsa
| User-Opinion Category | No. of Patients |
|---|---|
| English | |
| Good | 11 (78.6) |
| Average | 03 (21.4) |
| Poor | - |
| Kannada | |
| Good | 17 (85.0) |
| Average | 03 (15.0) |
| Poor | - |
| Overall | |
| Good | 28 (82.4) |
| Average | 06 (17.6) |
| Poor | - |
aValues are expressed as No. (%).
4.2.3. Test-Retest Reliability of User-Testing and User-Opinion Questionnaire
Out of 20 patients with DFU, 12 were assessed for Kannada and the remaining 8 were assessed for the English versions of the questionnaires. The ICC reliability for both versions of the questionnaire ranged from 0.91 to 0.96 (Table 5).
Table 5.
Test Re-Test Reliability of User-Testing and User-Opinion Questionnairesa
| Type of Questionnaire | Test 1 (Day 1) Score | Test 2 (Day 7) Score | ICC Value | P Value |
|---|---|---|---|---|
| User testing English (n = 8) | 44.6 ± 11.3 | 44.2 ± 10.1 | 0.91 | P = 0.085 |
| User testing Kannada (n = 12) | 43.2 ± 12.4 | 42.9 ± 13.2 | 0.96 | |
| User opinion English (n = 8) | 17.2 ± 4.4 | 17.5 ± 3.1 | 0.92 | |
| User opinion Kannada (n = 12) | 16.4 ± 8.4 | 16.8 ± 5.6 | 0.93 |
Abbreviations: SD, Standard Deviation; ICC, Intra-Class Correlation Coefficient.
aValues are expressed as mean ± SD.
5. Discussion
This study was the first of its kind in India that developed a PIL for patients with DFU and was evaluated for both readability and user-testing. The only previous study in India, conducted on PIL for DFU, was “Preparation and readability assessment of patient information leaflets for diabetic foot ulcers” by Roy et al., in which the readability formula method was employed (16).
If the FRE score of a PIL is < 60, the text is considered to be difficult to read by the general public. In this study, mean readability scores of the PIL were found to be 73.9. These scores suggest that the readability of the PIL is “fairly easy”. The higher the readability, the better is the acceptance of the PILs by the patients (15).
The FK-GL gives a score equivalent to a school grade level. This score can be converted to a reading age by adding 5. The FK-GL of the PIL gave a score of 6.1, which approximately equates to a reading age of between 11 and 12 years old. A previous study on readability of PIL for DFU reported a FK-GL score of 7.1 (16). Gunning-Fog index estimates the years of formal education needed to understand written text on a first reading. It is usually used to confirm whether the text could be read easily by the intended audience (24, 25). Gunning-Fog score of the PIL was 8.5, indicating that the text was readable and understandable. Coleman-Liau index of the text of PIL was 10.5, which means the PIL was at a grade level of 10.5, or roughly appropriate for a 10th to 11th grade (24, 25). A SMOG index of 6.3 is equivalent to 6th or 7th grade reading level. The SMOG index readability formula measures the years of education a person needs to fully understand a written text (26). A similar SMOG index was reported in a previous study (16). Automated Readability Index (ARI), which rates the understandability of the text, was 5.9, which equates to upper primary school level (6th grade), age 11 to 12 years (16, 24, 25).
A grade level is equivalent to the number of years of education a person has had. The average grade level of the text was 7.5, against the value of 10 to 12, expected from a person, who has completed high school in India. Text to be read by the general public in western countries is generally aimed at a grade level of ≤ 8 (25). Therefore, it could be concluded that these values may be applied meaningfully in the Indian context.
As per the BALD criteria, a PIL scoring > 20 (Total score is 32) is considered as “good” in layout and design characteristics (18). The PIL developed in this study scored > 25 in both English and Kannada versions and were similar to an English PIL prepared by the authors in a previous study (16).
In this study, user-testing was employed along with the FRE/FK-GL method to assess the PIL readability. User-testing is more reliable than the assessment by the formula method because PILs in any language could be tested (10, 15). Unlike previous studies, the authors also evaluated user-opinion in addition to user-testing of the PIL (17). It was found that 82.4% gave a good rating to content, legibility, and design of the PILs. The ICC value of the user-testing and user-opinion questionnaires was > 0.9 and considered as highly reliable. The study proved that the post-intervention user-testing scores significantly improved from 43.4 to 69.7 (P < 0.05) with the use of PILs. Similarly, other studies performed on the impact of PILs in recalling the information provided, in various conditions such as cancer, smoking, renal failure, asthma, diabetes, hypertension, peptic ulcer, and angina showed a significant effect (11, 18).
The main strengths of the study were adequate number of participants and response rate to the questionnaires was high. Against the minimum requirement of 20 patients, the authors performed the user-tests on the basis of one-to-one, face-to-face, structured sets of interviews in 34 patients with DFU (10).
5.1. Conclusion
The study demonstrated that the PILs were well-received by the patients with DFU, also indicating significant improvement in patient knowledge level after reading the PILs. The PILs met the standards of fairly easy readability and good layout design criteria required for PE. The reading age required to understand the PIL was appropriate for the target group. The user-opinion reported that the majority of the patients rated the PILs’ content, legibility, and design as good. The study concluded that pharmacist-led PE with PILs had a significant positive impact on the patient’s knowledge on DFU.