
1. Context
The “results section” is the heart of the paper, around which the other sections are organized (1). Research is about results and the reader comes to the paper to discover the results (2). In this section, authors contribute to the development of scientific literature by providing novel, hitherto unknown knowledge (3). In addition to the results, this section contains data and statistical information for supporting or refuting the hypothesis proposed in the introduction (4).
“Results section” should provide an objective description of the main findings, clearly and concisely, without interpretation (5, 6). The authors need to use an interesting combination of text, tables, and figures to answer the study questions and to tell the story without diversions (7). The systemic assessment of published articles highlights the fact that the literature frequently suffers from selective reporting of results only for certain assessed outcomes, selective reporting of statistical analyses, and confused, ambiguous, incomplete, or misleading presentation of data (8, 9).
In this section of our series on the principles of biomedical scientific writing (10, 11), we describe the function, content, and organization of the “results section” in a scientific paper (mostly for hypothesis-testing papers) and provide common recommendations that can help authors to write this section more effectively.
2. The Function of the Results Section
The function of the “results section” is to present the main results of experiments described in the materials and methods section (12, 13) and to present the supporting data in the form of text, tables, and figures (13). This section should answer the basic question: “What did the authors find in research?” By providing the results, authors try to elucidate the research data, making it to the point and meaningful (13).
3. Content of the Results Section
The “results section” includes both results and data that are presented in text, tables, and figures. Results are presented in the text; data (the most important) are presented in figures and tables, with a limited amount presented in the text (13). Statistically relevant parameters including sample size, P values, and the type of statistics used are also presented in this section (13).
3.1. Difference Between Data and Results
Data and results are not the same (14); providing results but no data vs. data but no results should be avoided (14, 15). Results are general statements in the main text that summarize or explain what the data (facts and numbers) show (13, 14); in other words, results are text descriptions of what is important about data (16) and give meaning to the data (15). When reporting data or results, make sure that they are logical (2). See Box 1 for more differences between results and data.
aThe text presented in square brackets is data and the remainder is a result.
3.2. The Appropriate Format for Presenting Data/Results
Depending on how the data best support the findings of the study, the “results section” is structured as text, tables, and figures (12) and should consist of a dynamic interplay between text and figures/tables; the most important data are usually presented in both formats (17). The reader should select the mode of presentation in a way that optimizes comprehension of the data; however, as a general rule, if you want to present three or fewer numbers, you should use a sentence; otherwise, you consider a table or a graph (18).
Selecting the best format for presenting results/data depends on the level of details (exact values or patterns) to present (19). Tables are useful to present specific information or exact values (19), and function as reference tools for readers (20) whereas figures are useful to show comparisons and patterns (19), functioning as analytic tools (20).
Tables are meant to summarize large amounts of data, to organize and display data more clearly than words, to compare groups of data, to simplify found information, and to facilitate calculations (19). A table typically has three or more interrelated columns and three or more interrelated rows; otherwise, presenting the information in the text may be more appropriate (19).
The functions of figures include: (1) showing the underlying patterns of data that are not presentable in text or tables, (2) displaying data more clearly than they can be done in text or tables, (3) more summarizing a large amount of data than they can be done in text or tables, and (4) improving the understanding and locating the specific information easily and rapidly (21).
3.3. Results
The primary content of this section includes the most relevant (but not all) results corresponding to the central question posed in the introduction section, whether they support the hypothesis or not (12, 13). The secondary findings, e.g., results related to secondary outcomes and subgroup analyses, may also be reported in this section (22). Results must be presented for both experimental and control groups (13). Results of each item mentioned in the materials and methods should be given in the results section (12, 15).
The text of the “results section” should state and summarize the main results and explain the data presented within tables and/or figures (23); reiteration of all numbers presented in tables and figures is not recommended (22); however, readers must be given the main messages derived from a table or figure without having to interpret the data themselves (7). It means that if there is a large amount of data in a table or figure, restating a key piece of data in the text is acceptable and helps the reader zero in on important data (14).
3.3.1. Reporting Negative Findings
Authors are highly recommended excluding irrelevant results but not ignoring valid anomalous results that contradict the research hypothesis or do not support the current scientific literature (22). The Feynman, says “if you are doing an experiment, you should report everything that you think might make it invalid-not only what you think is right about it” (24). Although reporting null or negative findings is not as straightforward as positive findings, it may lead to reexamining current scientific thinking, and guide scientists towards unabridged science (25). Reporting negative findings can also prevent the replication of the study and prevent the waste of time and resources (25). The ignorance of null or negative findings also leads to an overestimation of an effect size or treatment effect in available data (9).
3.3.2. Referring to Unpublished Results
3.3.3. Methods or Interpretation in the Results Section
Generally, the “results section” is not the place for presenting methods and experimental details or interpreting data (14). When experiments are described in this section, if a result leads to additional experiments, it is better to report the new experimental details in the “results section” (14). Sometimes authors want to refer to a specific experiment or method in results; in these cases, they should not repeat experimental details, but preferably use a transition phrase to link methods with results (14). To justify the rationale behind the experiment, using topic sentences/phrases (e.g. in order to determine whether…) provides an overview before giving details (12); however, in this case, the method statement should not be used as a topic sentence and the main verbs should describe results, not methods (e.g., “when propranolol was administered during normal ventilation, phospholipids decreased”; here “method” is subordinated in a transition clause and result is the main clause) (13). Two patterns of sentence structure are recommended for including methods in a result statement: making the method the subject of the sentence or stating the method using a transition phrase or clause and the result in the main clause (13).
The traditional view of writing the “results section” is just to report data and results without any interpretation; accordingly, the result is not expected to contain statements that need to be referenced (comparisons of findings) (13, 26). In another view, some interpretation or brief comparisons that do not fit into the discussion may be included (13, 27).
3.4. Data
Data are facts and numbers, mostly presented as non-textual elements (usually in tables and figures) where they are easy to read (13, 14, 28). A limited amount of data may also be presented in the text, following a result statement (13) although too much data in the text make it too long (Box 1) (28). Data may be in the form of raw data, summarized data, or transformed data (13); however, it is suggested that raw data (i.e. patients’ records, individual observations) not be presented in results (12). Note that numerical data are absolute while some data, e.g. microscopic data, are subjective (2).
3.4.1. Non-Textual Elements
Providing study findings visually, rather than entire textualizing, enables authors to summarize a great deal of data compactly within the text with an appropriate reference; some images convey more than words (29). The primary purpose of non-textual elements, i.e. tables, graphs, figures, and maps, is to present data such that they can be easily and quickly grasped (23) while being more informative than when appearing in the text (6). Tables and figures should be complete/comprehensible, being able to stand alone without the text (5, 12).
Non-textual elements should be referred to in the text at the appropriate point (5, 6, 12). Location statements, i.e. statements referring to non-textual elements, may be presented in different patterns (e.g., A. X is shown in table/figure; B. table/figure shows; C. see table/figure; D. as shown in table/figure); pattern B is more and pattern C is less common (27).
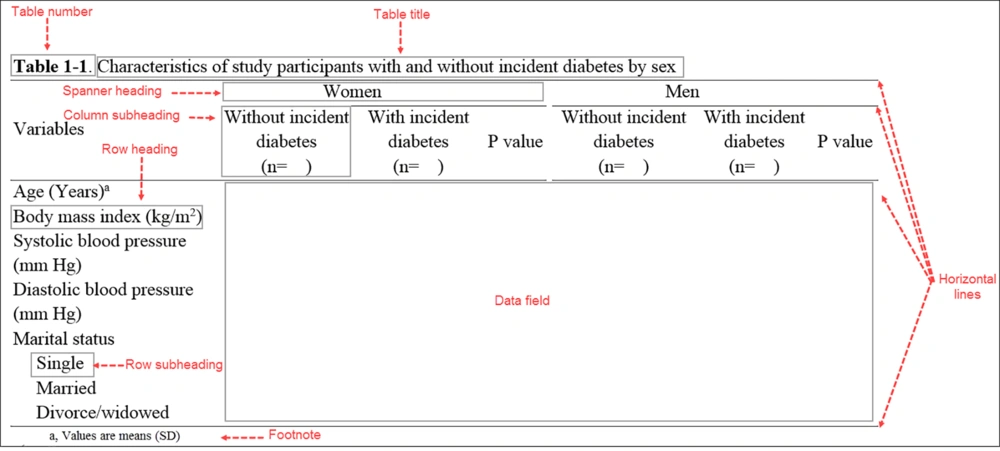
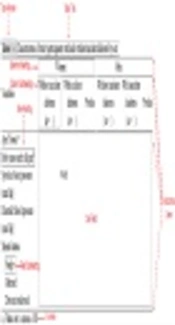
Figure 1.
Components of a table in a scientific paper; because of spanner heading, the table has column subheading instead of the column heading. Note that there is no vertical line and limited horizontal lines
Some general tips about using non-textual elements in the “results section” are reviewed in Box 2. The most common rules in organizing tables and figures are given in the following. For more information about designing different types of tables/figures/graphs, please refer to additional references (7, 19, 20, 30, 31).
Box 2.
General Tips for Presenting Data in Tables and Figures
| Tips |
|---|
| Give a caption to each element consisting of a number and a title |
| Avoid using abbreviations in the title of tables or the legend of figures |
| Keep the table title and figure legend brief but sufficiently detailed to explain the data included |
| Do not overload the title with details |
| Put the elements within the text, or include them in the rest of the manuscript; do not use both approaches |
| Distinguish the element from any appendix materials provided at the end of the manuscript (if placed at the end) |
| Put each element as close as possible to where it is first mentioned in the text (if placed within the text) |
| Use an explicit number for each table, figure, etc. |
| Refer to each element appropriately within the text and if needed explain it |
| Use parentheses when referring to elements within the text |
| Have a consistent appearance for the elements, e.g. use a uniform box or frame and a uniform font |
| Use footnotes or captions to explain any unclear data |
3.4.1.1. Tables
The use of tables is an effective way to summarize demographic information and descriptive statistics (23). Note that tables must have a purpose and be integrated into the text (21). Tables are most useful to present counts, proportions, and percentages (8), and are appropriate also for presenting details especially when exact values matter (32), being are more informative than graphs (29). However, limited information should be presented in tables; otherwise, most readers find them difficult to read and thus, may ignore them (5, 23). Data in tables can be arranged horizontally or vertically; whenever possible, primary comparisons are preferably presented horizontally from left to right (19).
3.4.1.1.1. Basic Elements of Tables
Tables usually have at least six elements: (1) table number, (2) table title, (3) row headings (stubs), and (4) column headings (boxes), identifying information in rows and columns, (5) data in data field, and (6) horizontal lines (rules). Most also have footnotes, row subheadings, spanner headings (identifying subgroups in column headings), and expanded forms of abbreviations in the table (19, 21, 31, 33).
The table title should clearly state what appears in it and provide sufficient information on the study, i.e. provide a context helping readers interpret the table information (19). Some specific details may also be provided including the type and number of subjects or the period of study (30). For developing the title of a table, one can describe the main cell entries, followed by qualification or more description (32). The table’s title is presented as a phrase not a full sentence (19). Authors need to refer to the journal’s style for rules on which words in titles are capitalized.
As a rule, comparing two (or even three) numbers should be side-by-side rather than above and below (30). Column and row headings help readers find information and they should be included group sizes and measurement units (19). Tables should be in borderless grids of rows and columns (5, 32) with no vertical rule and limited horizontal rules (32). The first column of a table includes usually a list of variables that are presented in the table; although the first column usually does not need a header, sometimes a simple description of what appears in each row may be provided as the heading of the first column. Units for variables may be placed in parentheses immediately below the row descriptions (30).
Headings for other columns should also be informative without vague labels, e.g. group A, group B, group C, etc.; instead, a brief description summarizing group characteristics is used (30). The last column may show P values for comparison between study groups (34), except for randomized clinical trials, where P values are not needed to compare baseline characteristics of participants (7). The first letters of lines and column headings in tables should be capitalized.
The fields of tables are points at which columns and rows intersect (19). Cells of a table are the data field of the table, other than those containing row and column headings (21). Cells contain information as numerals, text, or symbols (19). Every cell must contain information; if no information is available, one can use NA in the cell and define it in the footnote as not available or not applicable; alternatively, a dash mark may be inserted (19). The content of columns need to be aligned (19); words are usually left aligned, numerals are aligned at decimals, parenthesis, and factors of 10 (19, 21).
Table footnotes should be brief, and define abbreviations, provide statistical results, and explain discrepancies in data, e.g., “percentages do not total 100 because of rounding” (19, 30). In addition to asterisks usually used to show statistical significance (33), the following symbols are used, in sequence, for further notes: †, ‡, §, ¶, #, ††, ‡‡ (30).
3.4.1.1.2. Different Types of Tables
Table of lists, table of baseline or clinical characteristics of subjects, table of comparisons, and table of multivariable results are various types of tables that may be used (30). The table’s format should be selected according to the purpose of the table (30). A table of lists just presents a list of items including diagnostic criteria or causes of a disease; it is critical to arrange such tables based on their contents by order (e.g., alphabetical order) or their importance (most to least) (30). Tables of study participants’ characteristics usually provide a general overview of the essential characteristics of subjects, such as age, sex, race, disease stage, and selected risk factors (30). The table of comparisons (≥ two groups) provides details for each group and differences between the groups. Tables of multivariable results elaborate results of statistical analyses assessing relationships between predictor (independent) and outcome (dependent) variables, and usually include regression coefficients, standard errors, slopes, partial correlation coefficients, and P values or odds ratio, hazard ratios, and 95% confidence intervals for regression models (30).
3.4.1.2. Figures
Graphical elements convey the important messages of research (20). A figure is “any graphical display to present information or data” (20), and it effectively presents complicated patterns (32), best used for presenting an important point at a glance or indicating trends or relationships (20). Like tables, figures should have a purpose and be integrated with the rest of the text (21).
3.4.1.2.1. Basic Elements of Figures
Most figures that present quantitative information (charts and graphs) have at least seven elements, including figure number, figure caption/legend, data field, vertical scale, horizontal scale, labels, and data (plotting symbols, lines, and so on) (21). Some figures also have reference lines in the data field to help orient readers and keys that identify data (21).
Figure caption/legend, usually given below the figure, describes the figure and must reflect the figure entirely, independent of the main text (21, 31). For the figure to stand alone, a figure legend needs to be included four parts (a brief title, experimental or statistical information/details, definitions of symbols, line, or bar patterns, and abbreviations) (31).
Data field is a space in the figure in which data are presented; it is usually bordered on the left by the X-axis (abscissa) and on the bottom by the Y-axis (ordinate) (20, 21). Labels identify the variables graphed and the units of measurement (21). Figure lines should be broad and the labeling text should be large enough to be legible after reduction to a single- or two-column size (32). Appropriate font size should be used to maintain legibility after fitting figures to publication size (31).
Scales on each axis should match the data range and be slightly above the highest value (20). Symbols should be uniform across the figures (20). The data point symbols should be easily distinguishable; using black and white circles (● - ∘) is the easiest way when two are needed (31); if more are needed, using up-pointing triangles (▲ - Δ) and squares (■ - □) is suggested (31). Using symbols, line types, and colors is also effective in differentiating important strata in figures (8).
3.4.1.2.2. Emphasizing Important Data on Figures
To make figures visually efficient, the subordination of all non-data elements vs. data elements is advised (gridlines should be used as thin as possible and very faint). Directly labeling objects, instead of legends, may keep readers’ attention on the most important parts of the figure (8). Using different line weights may also be helpful to emphasize the important information/data in figures (31). The use of color, shading, or 3D perspectives is not suggested unless they serve a specific explanatory function in figure (8).
3.4.1.2.3. Different Types of Figures
Two major categories of figures are statistical figures (graphs) and non-statistical figures (clinical images, photographs, diagrams, illustrations, and textual figures) (20). Graphs are suitable for presenting relationships whereas non-statistical figures are used to confirm findings or provide explanatory information (20).
In statistical figures, selecting a graphical format (bar graph, line graph, dot plot, and scatterplot) is done according to the type of relationship that authors wish to communicate (20); for example, line graphs are appropriate for showing trends and bar graphs for magnitudes (20). Using a graphing format that is easy to interpret is preferred (20); pie graphs are sparingly used because comparing different angles is complicated with them (20). Graphs should accurately represent findings; when possible, scales should start at zero, and figure axes should not be altered in order to make data more meaningful (20).
Non-statistical figures are those that visually present information that does not contain data (20). Clinical images and photographs [ultrasonograms, computed tomographic scans (CT scans), magnetic resonance images (MRI), images of patients, tissue samples, microscopic findings, and so on] provide absolute proof of findings (20). Illustrations are used for explaining structures (parts of a cell), mechanisms, and relationships (20). Diagrams (flowcharts, algorithms, pedigrees, and maps) are useful for displaying complex relations (20). Textual figures, containing only text, are mostly used for describing steps of a procedure or summarizing guidelines (20). For photographs, patient information or identifiers should be removed (20).
3.5. Statistics in the Results Section
Statistics in the “results section” must report data in a way that enables readers to assess the degree of experimental variation and to estimate the variability or precision of the findings (22). For more details, one can see SAMPL (Statistical Analysis and methods in the Published Literature) guidelines (35). To report normally distributed data, the mean and estimated variation from mean should be stated (13). Variability should be reported using standard deviation (SD), which is a descriptive statistic (36) and reflects the dispersion of individual sample observation of the sample mean (37). The standard error (SE), an inferential statistic (36) reflecting the theoretical dispersion of sample means about some population means, characterizes uncertainty about true values of population means (37). It is useful for assessing the precision of an estimator (36) and is not an appropriate estimate of the variability in observations (37). Using “mean (SD or SE)” is preferred to “mean ± SD or SE” because the “±” sign can cause confusion (22). Increasing sample size decreases SE but not SD (36). To report data with a skewed distribution, the median and the interquartile range (between 25th and 75th percentiles) should be provided (22).
To report risk, rates, and ratios, one should use a type of rate (incidence rate, survival rate), ratio (odds ratio, hazards ratio), or risk (absolute risk, relative risk, relative risk reduction) (35). The measure of precision (95% CI) for estimated risks, rates, and ratios should also be provided (35). For correlation analysis, the exact values of the correlation coefficient and 95% CI should be reported. Describing correlation using qualitative words (low, moderate, high) without providing a clear definition is not acceptable (35). Results of regression analysis should include regression coefficients (β) of each explanatory variable, corresponding 95% CI and/or P value and a measure of the “goodness-of-fit” of the model (35).
3.5.1. Significance Levels
A P value is the probability of consistency between data and the hypothesis being tested (38). Reporting the exact P values (P = 0.34 or P = 0.02) rather than the conventional P (P < 0.05) is recommended for all primary analyses (12, 37) as it conveys more information (37). The use of the term “partially significant” or “marginally significant”, where the P value is almost significant (e.g. P = 0.057) is not acceptable if the significance level is defined as P = 0.05 (39). Some, however, argue that it is not always necessary to stick to P = 0.05 for the interpretation of results and it is better to report the exact P value and confidence interval for the estimator (40).
The use of the 95% confidence interval (95% CI) can provide further information compared to P values per se, and prefigures the direction of the effect size (negative or positive), its magnitude, and the degree of precision (17). A confidence interval characterizes uncertainty about the true value of population parameters (37). It is essential to provide the sample size (n) and probability values for tests of statistical significance (13).
Statements about significance must be qualified numerically (41). In the text, it is suggested that P values be reported as equalities rather than as inequalities in relation to the alpha criterion (41). In tables and figures, inequalities may be useful for groups of data (41) where asterisks *, **, and *** are usually used to show statistical significance at 0.05, 0.01, and 0.001 probability levels, respectively (33).
Although not consistent, P values < 0.001 are reported as P < 0.001; for 0.001 ≤ P values < 0.01, a three-significant digit is recommended, e.g. P = 0.003; for 0.01 ≤ P values < 0.1, a two-significant digit is sufficient (e.g. P = 0.05); for 0.1 ≤ P values ≤ 0.9, a one-significant digit is sufficient (e.g. P = 0.4); and P values > 0.9 are reported as P > 0.9 (42). For genome-wide association studies, the power of 10 is used for reporting P values, e.g. 6 × 10⁻⁹ (42). It is generally suggested that zero be used before a decimal point when the value is below one, e.g. 0.37 (43). According to the American Psychological Association, zero before a decimal point is used for numbers that are below one, but it can also be used for values that may exceed one (e.g. 0.23 cm). Therefore, when statistics cannot be greater than one (e.g. correlations, proportions, and P values), do not use a zero before decimal fraction, e.g. P = .028 not P = 0.028 (18); this recommendation, however, is not always adopted by everyone. The international standard is P (large italic) although both ‘p’ and ‘P’ are allowed (40).
4. Organization of the Results Section
There are different ways for organizing the “results section” including (1, 12, 14, 22, 44): (1) chronological order, (2) general to specific, (3) most to least important, and (4) grouping results by topic/study groups or experiment/measured parameters. Authors decide which format is more appropriate for the presentation of their data (12); anyway, results should be presented in a logical manner (4).
4.1. Different Ways of Organizing the Results Section
4.1.1. Chronological Order
The best order for organizing “results section” may be the chronological order (22). It is considered as the most straightforward approach using subheadings that parallel methods (14). This order facilitates referring to a method associated with a given result (14) such that results are presented in the same order as methods (15).
4.1.2. General to Specific
This format is mostly used in clinical studies involving multiple groups of individuals receiving different treatments (14). The “results section” usually proceeds from general to more specific findings (1). Characteristics of the overall study population (sex and age distribution and dropouts) are first given (14), followed by data and results for each group starting with the control group or the group receiving the standard treatment (14); finally, the disease group or group receiving the experimental treatment are addressed (14). As a general rule, secondary results should be given after presenting more important (primary) results, followed by any supporting information (22). A common order is stating recruitment/response, characteristics of the sample/study participants, findings from the primary analyses, findings from secondary analyses, and any additional or unexpected findings (17). In other words, the “results section” should be initiated by univariate statistics, followed by bivariate analyses to describe associations between explanatory and outcome variables; finally, it gets through by any multivariate analyses (7).
4.1.3. Most to Least Important
This format is used in case that the order of presenting results is not critical to their being comprehendible and allows the author to immediately highlight important findings (14). Results that answer the main question are presented at the beginning of the “results section,” followed by other results in next paragraphs (13).
4.1.4. Grouping by Topic or Experiment
Comparison of the diagnostic and analytical performance of a number of assays for analytes is an example of using this format (14).
4.2. Paragraphing of the Results Section
The “results section” may be initiated by two approaches: (1) by giving a general (not detailed) overview of the experiment and (2) by going directly to the results by referring to tables or figures (44). The first paragraph of this section, along with table 1, describes the characteristics of the study population (number, sex, age, and symptoms) (23). These data show the comparability of the study groups at baseline and the distribution of potential confounders between groups, as a source of bias that can affect the study findings (7). It allows the reader to decide whether or not the case and control groups are similar and represent the patient population in their private practice (23).
For clinical trials, the number of patients completing the protocol in each treatment/study group, the number of patients lost to follow-up, and the number and reasons for excluded/withdrawn subjects should be given. Commenting on whether baseline characteristics of study groups are statistically similar or different is also important (1). For further information, authors can consult reporting guidelines for the main study types available at http://www.equator-network.org.
The number of the middle paragraphs depends on the number of research questions/hypotheses and the types of statistical analyses; each hypothesis or specific analysis typically devotes at least a paragraph to itself (1). Figure legends, description of the methods and results for control groups should not be given at the beginning of paragraphs, as they do not narrate the story (28). However, sometimes, it is needed that results of the control group are presented first (e.g. for establishing the stability of baseline) (13).
5. Emphasizing Important Results
Since not all results are equally important, the reader must be able to distinguish important results and authors have to emphasize important information and de-emphasize less important information (13). There are various techniques for emphasizing important information, including condensing or omitting less important information, subordinating less important information, placing important results at the power position, and labeling, stating, and repeating important information (13).
For condensing or omitting less important information, you should be careful not to duplicate/repeat data in tables and figures or repeat them in the text (4, 6, 12); one or two values from tables/figures can be repeated in the text for emphasis (13).
For subordinating less important information, one should not use table titles, figure legends or methods statement as a topic sentence in the text (13, 22). Instead, after stating the first result relevant to the table/figure, you can cite it in parenthesis (13). Since a result states a message and creates an expectation, it is a more powerful topic sentence than a figure legend or table title (13). Sometimes, control results can be subordinated by incorporating them into experimental results (13).
To highlight more important results (those that help answer questions), authors can put these results at the beginning of paragraphs, the strongest power position (12, 22, 28), followed by supporting details and control results (28).
Moreover, key findings may receive more attention by using a signal (e.g. we found or we observed) at the beginning of the sentence (13).
6. Other Considerations
6.1. Length and Paragraphing
To see the forest for the tree, the “results section” should be as brief and uncluttered as possible (13), which can be accomplished by having a well-organized “materials and methods” section (3) and avoiding unnecessary repetition (13); for example, similar results for several variables can be reported together. The “results section” of an original manuscript usually includes 2 - 3 pages (~1000 words) with a 1.5 line spacing, font size 11 (including tables and figures) (45), and 4 - 9 paragraphs (each 130 words) on average (45); a paragraph should be devoted to one or more closely related figures (4).
Presenting additional results/data as supplementary materials is a suggestion for keeping the “results section” brief (17). In addition to save the text space, supplementary materials improve the presentation and facilitate communications among scientists (46, 47). According to Springer, supplementary materials can be used for presenting data that are not needed to support the major conclusions but are still interesting. However, keep in mind that the unregulated use of supplementary materials is harmful to science (47). Supplementary materials should be referred to at the appropriate points in the main text.
6.2. Tense
6.3. Word Choice
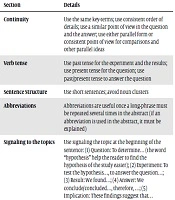
Although adverbs/adjectives are commonly used to highlight the importance of results, it is recommended altogether avoiding the use of such qualitative/emotive words in the “results section” (7, 13). Some believe that qualitative words should not be used because they may imply an interpretation of findings (17). In biomedical publications, the terms ‘significant, significance, and significantly’ (followed by P values) are used to show statistical relationships and should not be used for other purposes for which, other terms such as substantial, considerable, or noteworthy can be used (14). See Box 3 for appropriate word choice for the “results section.”
| Do's |
|---|
| Use straightforward verbs for stating results, e.g. show, indicate, demonstrate, highlight, identify, detect, observe, find, and confirm |
| Use “significant” or “significantly” just for statistical significance |
| Be careful about using negative sentences: |
| Instead of using double negatives, be straightforward and use positive terms |
| Make the sentence clear by omitting negative words or negative sentence constructions, e.g. “There was no significant interaction…” instead of “We did not find a statistical interaction ….” |
| Don'ts |
| Do not use “reveal” to state the results because it is a funny word that suggests something was found perhaps by magic. |
| Do not use emotive words to describe the significance of the results, e.g. interestingly, unfortunately, curiously, remarkably, inexplicably, importantly, crucially, and critically. |
| Do not use the word “level” instead of “concentration.” |
In the “results section,” to make a comparison between the results, i.e. stating the similarity/equivalence or difference/non-equivalence, using appropriate signals is recommended (27). To show a similarity, a signal to the reader may be used such as “like”, “alike”, “similar to”, and “the same as”; to show differences, the following signals can be used: “but”, “while”, “however”, “in contrast”, “more likely than”, and “less likely than” (27).
6.4. Reporting Numbers
Numbers play an important role in scientific communication and there are some golden rules for reporting numbers in a scientific paper (43, 48). Significant figures (significant digits) should reflect the degree of precision of the original measurement (12). The number of digits reported for a quantity should be consistent with scientific relevance (37); for example, a resolution to 0.001 units is necessary for pH but a resolution of < 1 mm Hg is unimportant for blood pressure (37). Avoid using “about” or “approximately” to qualify a measurement or calculation (12). The use of percentage for sample sizes of < 20 and decimal for sample sizes of < 100 is not recommended (43).
The numbers should be spelled out at the beginning of a sentence or when they are less than 10, e.g., twelve students improved… (43). In a sentence, the authors should be consistent where they use numbers as numerals or spelled-out (43). Before a unit of a measure, time, dates, and points, numbers should be used as numerals, e.g. 12 cm; 1 h 34 min; at 12:30 A.M., and on a 7-point scale (18).
A space between the numeral and the unit should be considered, except in the case of %. Because the terms “billion,” “trillion,” and “quadrillion” imply different numbers in Europe and the USA, they should not be used (48). To express ranges in text, the terms “to” or “through” are preferred to dashes; in tables, the use of dashes or hyphens is recommended (48).
7. Conclusions
The “results section” of a biomedical manuscript should clearly present findings of the study using an effective combination of results and data. Some dos and don’ts of writing the “results section” are provided in Box 4. Authors should try to find the best format using a dynamic interplay between text and figures/tables. Results can be organized in different ways including chronological order or most to least important; however, results should be presented in a manner that makes sense.
Box 4.
Do's and Don’ts of Writing a “Results Section“
| Do's |
|---|
| Present demographics or simple descriptive statistics first |
| Describe results from the most to the least important and from the primary outcomes to the secondary outcomes |
| Organize the results section using separate headings as in methods or by categories |
| Make up the results section using a combination of text, tables, and figures |
| Quantify results using appropriate indicators of centrality, probability, and statistical significance values |
| Match each result by its corresponding assessment/measurement method |
| Be focused on results related to the research hypothesis/question |
| Provide units according to the journal style and in a constant manner throughout the text |
| Don’ts |
| Report all analyses including those unrelated to the main study hypothesis/question |
| Compare the study results with those of previous reports |
| Discuss and interpret the results |
| Restate similar results in both textual and non-textual elements |
| Present raw data |
| Present data lacking units of measurements |
| Present crowded and confusing tables or figures |