1. Background
Japanese encephalitis virus (JEV) is a pathogen belonging to the Flavivirus genus (family Flaviviridae). The mosquito-borne, globally spread virus is the most common cause of epidemic and endemic viral encephalitis (1). In India, the Southern state of Tamil Nadu reported the first cases in the 1950s (2). In the Northern state of Uttar Pradesh, the first JE epidemic occurred in 1978 (3), and since then, the state yearly faces outbreaks in the monsoon and post-monsoon seasons, especially in the Northeastern districts of the state with epicenter being Gorakhpur and the surrounding districts - the ‘Terai’ region (4-7). In 2005 a severe epidemic of JE occurred in these regions (8). The term ‘acute encephalitis syndrome’ (AES) was coined by the World Health Organization (WHO) in 2006, for JE surveillance (9). AES is a broad syndrome with many possible causes, which may change both with time and region. The most important cause of such a presentation is invasion of the brain by infectious agents such as viruses, bacteria, rickettsia, protozoa, mycoplasma, etc. Noninfectious brain inflammations such as acute disseminated encephalomyelitis and antibody-associated encephalitis can also cause a similar illness. Infectious encephalopathy (systemic infection with encephalopathy without actual invasion of brain tissue as occurs in cerebral malaria, enteric encephalopathy, sepsis) and other functional and structural brain disorders associated with fever are other causes of AES.
In the beginning of summer 2006, the government of India decided to immunize children in the affected districts with the Chinese live attenuated vaccine (SA-14-14-2 strain). The vaccine was given in campaign mode to children aged 1 to 15 years (10). Ongoing surveillance for AES and JE are also continuing. The hospital under study is one of the centers involved in the hospital-based surveillance and continually admits 1000 to 1200 patients with AES on a yearly basis. Some of the patients were diagnosed with JE, but no etiological diagnosis is reached in most patients. AES and JE are the serious illnesses often leading to prolonged hospitalization and serious sequelae in survivors. The surveillance provided the opportunity to study the outcomes and the socioeconomic impacts of JE and non-JE AES in India.
2. Methods
The study setting was the pediatric and adult hospital wards of King George’s medical university (KGMU) Hospital in Lucknow, the capital city of the state. It is a public tertiary care teaching hospital mostly admitting the seriously ill and poor patients from the city and also the surrounding districts extending as far as Nepal.
As part of the hospital-based surveillance for AES and JE, patients with AES hospitalized in pediatric (aged ≤ 12 years) and adult wards were actively screened, and a detailed history and physical examination were collected according to a predesigned data collection form. Standard investigation and treatment followed. Treatment of AES is mainly supportive, but intravenous ceftriaxone is usually administered. Empirical acyclovir is occasionally used if herpes simplex infection is suspected.
ELISA Tests: Sera and cerebrospinal fluid (CSF) specimens were stored at 4°C and transported on ice to the virology laboratory of the university. The National Institute of Virology (NIV) JE MAC ELISA kit (version 1.4) (11) was used to assess IgM against Japanese encephalitis virus (JEV). The tests were interpreted and conducted according to the manufacturer`s recommendation. It was considered negative if optical density was 2-fold less than that of the negative control. If the optical density was 5-fold more than the negative control the sample was considered positive, and it was equivocal if the optical density was between these values.
If the initial IgM was negative or equivocal and the patient was alive and still hospitalized, the test was repeated on serum after an interval of 7 to 10 days. Patients were classified as:
- JE, if JE IgM was positive at any time of testing.
- Non-JE, if JE IgM results were negative when done after 10 days of illness.
- JE equivocal or unsure - i) If IgM was negative on initial testing and repeated testing could not be done, and ii) Equivocal results were obtained even on repeated testing.
Follow-up and outcome: At the time of discharge, families were given an appointment to revisit the hospital. If the patient revisited the hospital, a complete clinical work up was done and the following scales were administered:
1. Glasgow outcome scale (GOS) (12)
2. Physical examination
3. Liverpool outcome scale (LOS) (13)
4. For the children and adolescents below 20 years old, the child and adolescent scale of participation (CASP) (14)
5. Socioeconomic questionnaire: It was constructed with peer group discussion and included questions about out of pocket expenses before, during, and after the hospitalization on transportation, hospital charges, drugs, travel to hospital, physiotherapy, and clinics. Details on the source of these funds, whether the family had to sell off assets to meet these expenses or others, were noted. Questions about utilization of government facilities and resources and coping mechanisms were also included. The interview ended with an open ended question about the type of difficulties faced by the family both during and after the illness of their child. It was tape recorded on a portable recorder and analyzed using qualitative methods.
From mid-2014 to late 2015 home visits were paid to the patients admitted in either adult or pediatric wards of the hospital in 2013 and were discharged alive. A total of 19 district visits were paid to 109 patients. The home visits were made by a team and the same scales and questionnaires were administered.
For those who lived far from the hospital and home visit was not possible, mobile phones were used to contact the families and inquire about the health of their child. Special questionnaires were developed by peer group discussion, translated, and administered on telephone-based follow-ups. Questions included the current ability to talk, walk, seizures, mental functions, hearing and vision, focal weakness, rigidity and abnormal movements compared to the health status before the illness. Overall outcome was classified as per the GOS as normal/ near normal, independent functioning, dependent, vegetative, or death.
4. Results
A total of 126 patients could be followed-up out of which 29 (31.9%) were diagnosed with JE, 62 (68.1%) had non-JE AES, and the rest 35 were JE equivocal or unsure (according to the criteria given in Patients and Methods). Of the JE cases, 20 were positive for JE IgM in CSF and 9 in serum. Outcomes of JE (29) and non-JE (62) were compared between the patients. Among these 91 patients, 14 (15.4%) came for hospital visit, 74 (81.3%) were followed-up by home visits, while 3 (3.3%) patients were followed-up via telephone call. Figure 1 shows the districts where the patients came from.
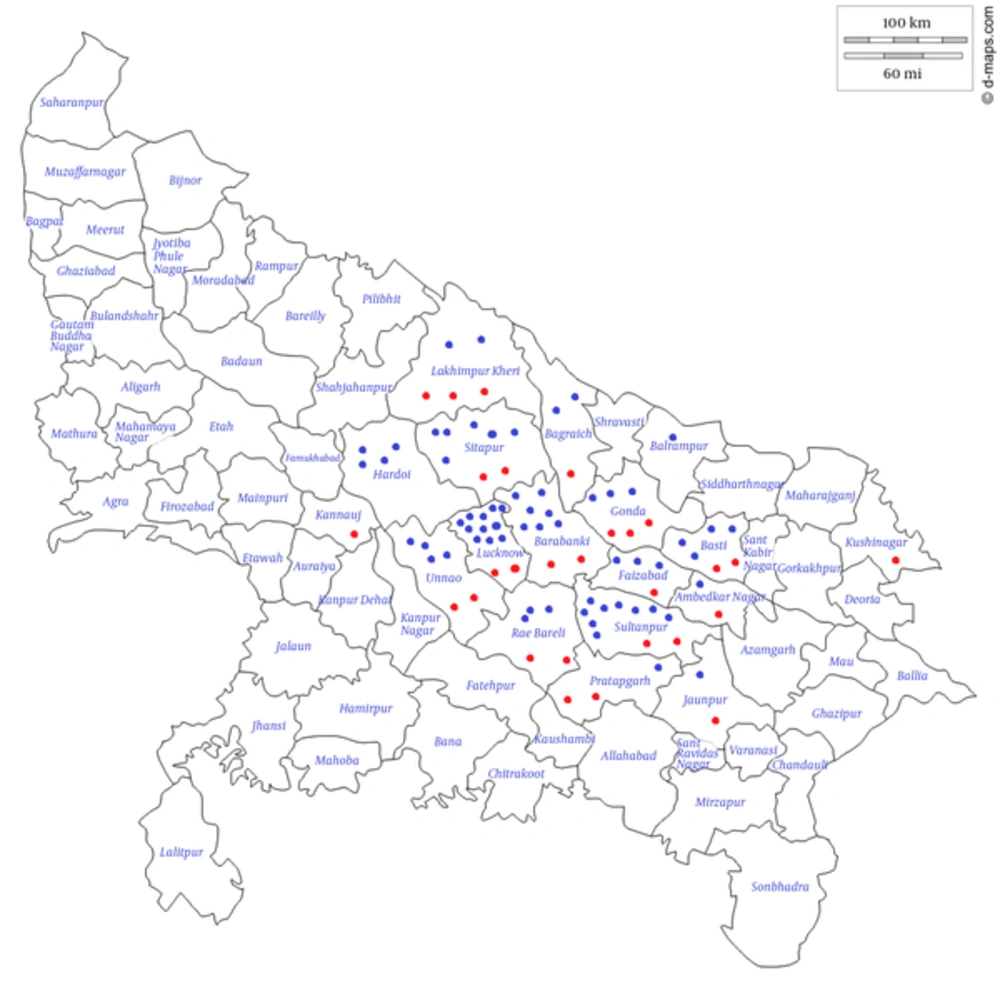
Figure 1.
Red = JE, Blue = Non-JE AES.
The mean follow-up periods was 21.9 (± 5.6) months in the whole group and did not differ significantly between the cases with JE (20.6 ± 8.9) and non-JE AES (22.5 ± 3.6).
4.1. Demographic Details
Demographic details of patients with JE and non-JE AES are shown in Table 1. No significant differences were observed between the cases with JE and the ones with non-JE AES.
Table 1.
Demographic Data of the Study Patients
| Variable | JE (n = 29), No. (%) | Non-JE AES (n = 62), No. (%) | P Value |
|---|---|---|---|
| Age (year) (mean ± SD)a | 13.75 ± 10.59 | 13.83 ± 11.98 | 0.977 |
| Male genderb | 23 (79.3) | 41 (66.1) | 0.199 |
| Rural residence b | 24 (82.8) | 59 (95.2) | 0.838 |
| Educational level of family headb | |||
| Illiterate | 7 (26.9) | 12 (19.4) | |
| Primary school or less | 2 (7.7) | 5 (8.1) | |
| Middle school | 5 (19.2) | 13 (21) | 0.200 |
| High school | 3 (11.5) | 14 (22.6) | |
| Intermediate | 6 (23.1) | 4 (6.5) | |
| Degree or above | 3 (11.5) | 14 (22.6) | |
| Occupation of family headb | |||
| Professional | 1 (3.9) | 2 (3.2) | |
| Business | 2 (7.7) | 3 (4.8) | |
| Clerical | 0 | 3 (4.8) | |
| Skilled worker | 4 (15.4) | 6 (9.7) | |
| Petty trade | 1 (3.9) | 3 (4.8) | 0.864 |
| Unskilled worker | 18 (69.2) | 44 (71) | |
| Student | 0 | 0 | |
| Unemployed/retired | 0 | 1 (1.6) | |
| Joint familyb | 8 (29.6) | 20 (32.3) | 0.806 |
| Family sizea | |||
| Number of family members (mean ± SD) | 8.03 ± 4.38 | 7.43 ±3.25 | 0.473 |
| Below poverty line card holderb | 6 (20.7) | 22 (35.5) | 0.807 |
aData are expressed as mean (SD), and ANOVA or 2-sample t test was used.
bData are expressed as number, percentage, and Chi-square test were used.
4.2. Functional Outcomes in Patients with JE and Non-JE AES
Outcomes were significantly worse in patients with JE in terms of both GOS and LOS (Table 2). Moderate disability, vegetative, and death categories of GOS were clubbed together as ‘bad’ outcomes. For the LOS, moderate sequelae, severe sequelae, and death were clubbed together as ‘bad’ outcomes. CASP score did not vary significantly between the groups.
Table 2.
Functional Outcomes in Patients with JE and the Ones with Non-JE AESa
| Variable | JE (n = 29), No (%) | Non-JE AES (n = 62), No (%) | P Value |
|---|---|---|---|
| Glasgow outcome score | |||
| Normal/near normal | 19 (65.5) | 53 (85.5) | |
| Mild disability | 1 (3.5) | 3 (4.8) | |
| Moderate disability | 7 (24.1) | 5 (8.1) | 0.046b |
| Vegetative | 0 | 1 (1.6) | |
| Dead | 2 (6.9) | 0 | |
| (mean ± SD)c | 1.79 ± 1.23 | 1.25 ± 0.67 | 0.021b |
| Liverpool outcome score | |||
| Full recovery | 15 (51.7) | 47 (75.8) | |
| Minor sequelae | 5 (17.2) | 9 (14.5) | |
| Moderate sequelae | 2 (6.9) | 4 (6.5) | 0.025b |
| Severe sequelae | 5 (17.2) | 2 (3.2) | |
| Death | 2 (6.9) | 0 | |
| (mean ± SD)c | 3.89 ± 1.39 | 4.62 ± 0.75 | 0.008b |
| CASP score1 (mean ± SD) | 30.71 ± 19.02 | 25.75 ± 14.27 | 0.224 |
| Maximum | 72 | 80 | |
| Minimum | 20 | 15 | |
| Median | 20 | 20 |
aNumbers (%) and Chi-square test was used.
bSignificant.
cNumbers represent mean (SD), and ANOVA or 2-samplet test was used.
4.3. Comparison of Neurological Impairments
Patients with AES faced different types of neurological impairments such as intellectual disability, rigidity, abnormal movement, seizures, and inability to walk and talk. These impairments were more common in patients with JE compared with the ones with non-JE AES (Figure 2, Table 2).
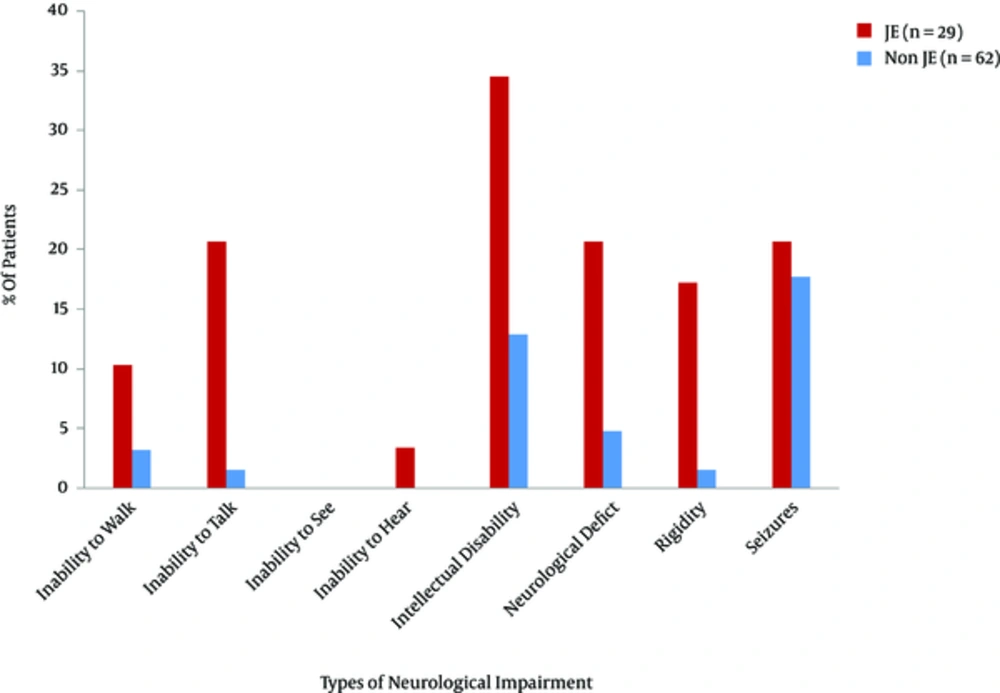
Figure 2.
Comparison of neurological impairments at follow-up between the patients with JE and the ones with non-JE AES
4.4. Details of Patients’ Admission and Expenses
The data are shown in Table 3. It is noteworthy that a significantly higher proportion of patients with non-JE AES were admitted in another facility before coming to the study hospital. Also, patients with non-JE AES were more likely to have taken treatment from private clinics/hospitals rather than state hospitals as compared with the ones with JE AES. Hospital stay was longer in state hospitals than the private ones both for patients with JE and non-JE AES. In the state hospitals, the expenditure to treat the patients with JE was higher than that of the ones with non-JE AES and similarly transportation costs were also higher in patients with JE. Out of the 29 patients with JE, 4 families received financial support from the government, but none of the ones with non-JE AES received financial support from the state government for treatment, in the form of a lump sum payment later on.
Table 3.
Details of Patient’s Admission and Expenses
| Variable | JE (n = 29); No (%) | Non-JE AES (n = 62); No (%) | P Value |
|---|---|---|---|
| Admission outsidea | |||
| Yes | 13 (50) | 49 (79) | 0.006b |
| Admitted outside in government facilitya | 10 (76.9) | 20 (44.4) | 0.038b |
| Admitted outside in private facilitya | 3 (23.1) | 25 (55.6) | |
| Days admitted outsidec (mean ± SD) | 2.02 ± 1.97 | 7.73 ± 22.13 | 0.941 |
| Expenses outside in INRc (mean ± SD) | 9600 ± 8395.2 | 14370.5 ± 37648.8 | 0.483 |
| Days admitted in KGMUc (mean ± SD) | 14.22 ± 15.75 | 14.40 ± 12.29 | 0.754 |
| Expenses in KMGU (in INR)c (mean ± SD) | 75818 ± 187299.8 | 21933 ± 17635.5 | 0.095 |
| Expenses on investigations (mean ± SD) | 4386.2 +/- 3961.9 | 6212.9 +/- 3924.3 | 0.042 |
| Expenses on transportc (in INR) (mean ± SD) | 29047 ± 108486 | 2044 ± 1354.4 | 0.035b |
| Financial help from governmenta | 4 (14.8) | 0 | 0.002b |
aNumbers (%) and Chi-square test was used.
bSignificant.
cNumbers represent mean (SD), and ANOVA or 2-sample t test was used.
4.5. The Families of Patients Were Divided into 3 Income Groups: i) Group 1
Monthly income less than Rs 5000; ii) Monthly income between Rs 5000 and 10 000; iii) Monthly income more than Rs 15 000. It was found that the mean total expenses (admission + transport + drugs + hospital visits) of group 1 was 119.3% of the monthly income, whereas for the groups 2 and 3 this figure was 26.6% and 15.4%, respectively.
4.6. Coping Mechanisms
Qualitative analysis of the interviews with the family heads of patients revealed that most of the families (about 95%) arranged for the expenses by borrowing from relatives, while some admitted to mortgaging their farm land or selling off or mortgaging family jewelry items. Many of the respondents said that they could not go for regular follow-up to the hospital as it was too expensive for them. There were some families who received help from the state government and non-governmental organizations (NGOs), while admitted at the study hospital. The state government helps by waiving off charges for imaging, etc., while the NGOs help by providing intravenous injections, etc.
5. Discussion
AES is a public health problem in many regions of India, especially in Uttar Pradesh, which is one of the most populous and poorest states in the country. JE was considered a major cause of such a presentation, but over the last decade, the proportion of cases attributable to JE declined so much and today JE accounts for less than 10% of cases in the Gorakhpur division (15). AES (including JE) is a serious illness often requiring extended periods of hospitalization and rehabilitation, after which the patient may even have permanent disability. Although the sequelae of laboratory confirmed JE is described, there is no comparative Indian study on the long-term sequelae of JE and non-JE AES and there is no study on the socioeconomic impacts of this devastating illness in India. In 2013 authors conducted a hospital-based surveillance on JE. Therefore, the authors were in a position to conduct the current comparative study on the long-term sequelae and economic impact of JE and non-JE AES.
The current study used the definitions of JE and non-JE AES as provided by WHO (16). Detection of anti-JEV IgM in CSF was taken as strong evidence of JE, while its presence in serum sample of a patient who developed clinical symptoms of AES was also suggestive. In JE, IgM may not be detected in the first week of illness, but it is almost always present by the 2nd week. Its absence after 10 days of illness can therefore be taken as absence of JE infection.
The group of patients with non-JE AES in the current study was likely a mixed group. AES has a wide etiology, both viral and non-viral infections of the brain as well as noninfectious disorders. In this region, non-JE AES is mostly attributed to enteroviruses (17), cerebral malaria, dengue encephalopathy (18), and rickettsia (19). However, the etiology is proven in only a minority of cases.
It was tried to follow-up the patients by hospital visits, but it was found that they did not keep their appointments. The only other way was to visit them at home. Therefore, a tremendous effort was made to send a team to their homes. Still some patients had moved from their homes or were untraceable. A few patients were followed-up via phone and the GOS was administered. The latter is a scale described for neurological outcomes. The LOS was also used, which is a validated scale for the outcomes in patients with encephalitis. The scores on the 2 scales were more or less the same.
Table 2 shows that long-term functional outcome was significantly worse in patients with JE, compared to the ones with non-JE AES. Two of the cases had JE, but none of the ones with non-JE AES died after discharge from hospital. The only other studies that compared outcomes in JE and non-JE AES were the ones by Griffiths et al., (2013) (20) and Rayamajhi et al., (2007) (21). Both of the studies were from Nepal. Griffiths et al., compared 22 patients with JE and 31 ones with non-JE AES followed-up 5 to12 months after discharge; although impairments were more frequent in patients with JE, the differences were not significant. Rayamajhi et al. (2007), defined non-JE AES as any patient with negative anti-JE in his/her CSF and/or serum and the period of follow-up was only 6 weeks.
Table 3 shows that prior admission, especially to a private facility, was significantly more frequent in the patients with non-JE AES. This may be explained by the more fulminant course that JE takes, which prompts the families to head straight for a tertiary care center such as the current one. Hospital and transport expenses were higher in the patients with JE, although the means of hospital stay were similar. Four of the patients with JE got financial help from the government, which was only announced for the cases with JE.
Qualitative methods were used to describe the difficulties that patients and their families face. AES and JE affect the poorest of the poor in the state. The poor families live in far flung rural areas without proper roads. The state provided few healthcare infrastructures and social support, but the medical expenses should be covered by the meagre earnings of the patients and their families. So many families had to sell off some assets such as family jewels and land to cover the medical expenses. To go to the hospital for follow-up or rehabilitation means losing the wage of the leave days and the extra money spent on transport. It is not surprising that many families cannot come for follow-up.
The families were also inquired about coping mechanisms. Generally, AES afflicts the very families who are least equipped to bear the burden of a disabled member. However, the joint family system, which is especially prevalent in rural areas, has a sort of cushioning effect. Apart from parents, there are other relatives and even older children who help to cope with the physical care and daily chores needed by the dependent child. There was only one vegetative survivor as such individuals are not expected to survive so long in that environment.
It was concluded that AES was a serious illness with a significant rate of long-term sequelae both in patients with JE and non-JE AES, but with significantly higher rates of moderate to severe sequelae in the patients with JE rather than the ones with non-JE AES. The illness has a severe socioeconomic impact, which should be borne by the families themselves. There are few facilities for rehabilitative services in the rural areas, and given the difficulties faced by families in travelling to cities for physiotherapy, occupational therapy, etc.; these needs remain largely unmet by these patients who nevertheless receive physical and emotional support of the joint family system.