1. Background
Necrotizing enterocolitis (NEC) was a common life-threatening disease among very low birth-weight (VLBW) infants. Recent epidemiological studies have indicated that 0.4% of 118,073 infants developed severe NEC (1), and 7% of preterm infants born at a gestational age (GA) below 29 weeks (2) developed severe NEC. The disease is also associated with many disadvantages, including extended hospital stay, feeding intolerance, short bowel syndrome, neurodevelopmental impairment, and growth delay (3).
NEC was positively correlated with gestational age (4) and empirical antibiotic use (5) and negatively correlated with prophylactic probiotics (2) and breastfeeding (6). Probiotics have been viewed as a protective factor in improving intestinal micro-ecology. In the VLBW infants, beneficial flora, including Bifidobacterium spp. and Lactobacillus spp., which are usually slow at colonizing, lead to the development of pathogenic bacteria arousing NEC (7). The associated mechanism might include bacterial translocation in the intestinal tract, resulting in variations in the immune barrier function, and the release of lipopolysaccharides (LPS) activating TLR-4 signals lead to NEC (8). Probiotics might activate TLR-9 as a protective receptor (9), balance the intestinal flora, and inhibit the growth of pathogenic bacteria. Each probiotic species has its unique characteristics; however, the most effective combination of probiotics is unknown. In this regard, according to many researchers, multi-strains, mainly containing Lactobacillus plus Bifidobacterium, were more effective than a single-strain, which was conventionally recommended (10).
The probiotic prophylaxis duration is not still unified.
2. Objectives
This study aimed to study the role of prophylaxis duration of probiotics, including Lactobacillus, Bifidobacterium, and Enterococcus faecalis (Bifid Lriple Viable, Shanghai Shangyao Xinyi Pharmaceutical, China; containing a dose of 1 × 10⁷ CFU per organism) in protecting against NEC.
3. Methods
3.1. Sample Selection
This single-center retrospective study was conducted at the Neonatal Department of the First Affiliated Hospital of Anhui Medical University, Hefei, Anhui, China, during May 2015 to January 2020. Having access to 100 incubators, the center has acted as a provincial level III neonatal intensive care unit and now has more than 3,500 newborn admissions per year. The VLBW (1000 g ≤ birth weight < 1500 g) group in this study received probiotics, including Lactobacillus, Bifidobacterium, and E. faecalis (Bifid Lriple Viable, Shanghai Shangyao Xinyi Pharmaceutical, China; containing a dose of 1 × 10⁷ CFU of each organism), twice a day. Probiotic prophylaxis was given after the first breastfeeding or formula feeding. The routine probiotic prophylaxis was also provided during a week (≥ 7 days).
Exclusion criteria were as follows: (1) neonates with birth weights ≥ 1500 g or < 1000g; (2) neonates with NEC IA and IB stage; (3) neonates suffering from significant congenital anomalies [defined as life-threatening if untreated or resulted in significant neurodevelopmental disabilities if treated, as described by Walsh and Kliegman (11)], and (4) Neonates discharged or passed away within 24 hours after admission.
According to the modified Bell’s staging criteria (12), with evaluated ≥ II A stage were defined as the NEC group in our study. In this regard, neonates with at least one of the systemic signs (e.g., temperature instability, apnea, bradycardia, and lethargy), at least one of intestinal signs (e.g., elevated pre-gavage residual, mild abdominal distention, emesis, and guaiac-positive stool) along with absent bowel sounds, with or without abdominal tenderness, and at least one of radiologic signs (e.g., intestinal dilation, ileus, and pneumatosis intestinalis) were diagnosed as NEC.
The Ethics Committee of the first Hospital of Anhui Medical University approved this research (NO. Quick-PJ 2021-05-24).
3.2. Data Collection and Operational Definitions
The participants’ neonatal information included GA, birth weight, gender, Apgar 1-minute, and 5-minute scores. Other recorded information included empirical antibiotic use, duration of probiotic prophylaxis, initial time of breastfeeding or formula feeding, and total enteral nutrition. The primary and secondary outcomes were also recorded.
Probiotic prophylaxis was defined as receiving probiotics, including Lactobacillus, Bifidobacterium, and E. faecalis (Bifid Lriple Viable, Shanghai Shangyao Xinyi Pharmaceutical, China; containing a dose of 1 × 10⁷ CFU per organism), twice a day after the first breastfeeding or formula feeding.
Probiotic prophylaxis duration was defined as days from the first probiotic dosage administration.
Empirical antibiotic use was defined as the first antibiotic treatment initiated during 3 - 5 postnatal days. Prolonged empirical antibiotic use was also defined for administration > 5 days.
We diagnosed early-onset sepsis during the first three postnatal days (≤ 72 h); late-onset sepsis was diagnosed after the first three postnatal days (> 72 h). Furthermore, in this study, sepsis was divided into proven sepsis and clinical sepsis (13, 14).
The proven sepsis was defined as the presence of (1) at least two clinical signs (namely temperature > 38 or < 36°C, new-onset frequency of bradycardia or tachycardia, apneas, hyperglycemia, metabolic acidosis, extended capillary refill time, changed skin color, and increased oxygen demand); (2) a causative agent in blood culture; (3) at least one laboratory signs (namely C-reactive protein > 2mg/dL, immature/ neutrophil ratio > 0.2, white blood count < 5/nL, and platelet < 100/nL).
The clinical sepsis was operationally defined as the presence of at least two clinical signs and a laboratory sign, as well as the failure to show the causative microorganism.
In this study, breastfeeding was defined as enteral nutrition of preterm infants with their mothers’ breast milk.
TEN referred to the total enteral nutrition intake > 100 mL/kg.
The primary outcomes covered patent ductus arteriosus (PDA), neonatal respiratory distress syndrome (NRDS), early-onset sepsis (EOS), and the secondary outcomes included late-onset sepsis (LOS), bronchopulmonary dysplasia (BPD), retinopathy (ROP), intraventricular hemorrhage (IVH), and periventricular leucomalacia (PVL).
Respiratory distress syndrome was defined regarding clinical features and oxygen/respiratory support for ≥ 6 h during the first 24 hours after birth (15).
The traditional BPD (supplemental oxygen use at 36-week postmenstrual age [PMA]) referred to BPD determined by using the National Institutes of Health Workshop on severity-based diagnostic criteria (16).
PDA was diagnosed by echocardiography (UCG), and IVH and PVL were diagnosed by MRI scans. Moreover, retinopathy of premature was diagnosed by retinopathy screening.
3.3. Statistical Analysis
Statistical analysis was performed with SPSS software for Windows version 16.0 (SPSS Inc., Chicago, IL, USA). The continuous variables in the two groups were described as mean ± standard deviation, the Student t-test was run to compare them. Median and interquartile interval described continuous variables distributed in a skewed manner, and the Mann-Whitney U test was used to measure the variables. Categorical variables were presented as frequencies and percentages and compared using the chi-squared test. An ROC curve was depicted to evaluate the threshold value of probiotic prophylaxis in the two groups, and the results were presented regarding the relative risk (OR) and 95% confidence intervals (CIs). In this study, P < 0.05 was considered as the significance level.
4. Results
4.1. Participants’ Perinatal and Clinical Characteristics
Table 1 presents the characteristics of the NEC and non-NEC infants. Of the 237 infants, 8.02% of the neonates developed NEC; 54% of infants were males; and their mean gestational age and average birth weights were 29.72 weeks and 1246.29 g, respectively. In this regard, a statistical difference was observed in the gestational age of the non-NEC and NEC groups. However, birth weight, gender, Apgar 1-minute score, and Apgar 5-minute score were not associated with the NEC risk.
Table 1.
Perinatal Factors and Clinical Characteristics of NEC and Non-NEC Infants a
| Characteristics | Total Infants (N = 237) | Non-NEC Infants (N = 218) | NEC Infants (N = 19) | Statistical Parameter; t/χ2 | P-Value |
|---|---|---|---|---|---|
| GA (week) | 29.72 ± 1.51 | 29.91 ± 1.58 | 29.03 ± 1.15 | 2.358 | 0.019 |
| BW (g) | 1246.29 ± 172.12 | 1246.56 ± 174.54 | 1243.16 ± 145.49 | 0.082 | 0.934 |
| Gender (Male) | 128 (54) | 115 (52.8) | 13 (68.4) | 1.727 | 0.189 |
| Apgar 1-minute score | 6.42 (5.00, 8.00) | 6.41 (5.00, 8.00) | 6.58 (5.00, 8.00) | -0.085 | 0.932 |
| Apgar 5-minute score | 8.37 (7.00, 9.00) | 8.14 (8.00, 9.00) | 8.38 (7.00, 10.00) | -0.258 | 0.797 |
Abbreviations: GA, gestational age; BW, birth weight; NEC, necrotizing enterocolitis.
a Values are expressed as mean ± SD or No. (%) unless otherwise indicated.
Table 2 shows the postnatal characteristics of the NEC and non-NEC neonates. As it can be observed, there is a statistical difference between the non-NEC and NEC groups regarding probiotic prophylaxis duration, duration of empirical antibiotic use, and red blood cell transfusion.
Table 2.
Postnatal Clinical Treatment Associated NEC a
| Total 237, (Non-NEC = 218, NEC = 19) | Total Infants | Non-NEC Infants | NEC Infants | Statistical Parameter; Z/χ2 | P-Value |
|---|---|---|---|---|---|
| Empirical antibiotic use (yes) | 187 (78.9) | 169 (77.5) | 18 (94.7) | 3.111 | 0.086b |
| Duration of empirical antibiotic use | 3.84 (2.00, 5.00) | 3.45 (2.00, 5.00) | 5.74 (5.00, 7.00) | -3.906 | 0.000 |
| Probiotic prophylaxis duration | 16.04 (12.00, 20.00) | 16.76 (12.00, 20.00) | 8.95 (7.00, 10.00) | -5.375 | 0.000 |
| Breastfeeding (yes) | 78 (32.9) | 73 (33.5) | 5 (26.3) | 0.407 | 0.524 |
| TEN time (days) | 10.86 (8.00, 13.00) | 10.78 (8.00, 13.00) | 11.74 (10.00, 14.00) | -1.502 | 0.128 |
| Initial feeding time (postnatal days) | 1.66 (1.00, 2.00) | 1.63 (1.00, 2.00) | 1.95 (1.00, 2.00) | -1.693 | 0.090 |
| RBC transfusion (yes) | 80 (30.8) | 69 (31.7) | 11 (57.9) | 5.383 | 0.020 |
Abbreviations: NEC, necrotizing enterocolitis; TEN, total enteral nutrition; LOS, late-onset sepsis; RBC, red blood cell.
a Values are expressed as mean (interquartile interval) or No. (%) unless otherwise indicated.
Table 3 represents the primary and secondary outcomes for the non-NEC and NEC neonates. According to this table, the LOS risk is statistically different between the non-NEC and NEC groups.
Table 3.
Primary and Secondary Outcomes of Non-NEC and NEC Groups
| Total 237, (Non-NEC = 218, NEC = 19) | Total Infants | Non-NEC Infants | NEC infants | Statistical Parameter; Z/χ2 | P-Value |
|---|---|---|---|---|---|
| PDA (yes) | 27 (11.4) | 25 (11.5) | 2 (10.5) | 0.015 | 1.000 |
| NRDS (yes) | 182 (76.8) | 185 (75.7) | 17 (89.5) | 1.864 | 0.258 |
| EOS (yes) | 12 (5.1) | 10 (4.6) | 2 (10.5) | 1.282 | 0.248 |
| LOS (yes) | 48 (20.3) | 35 (16.1) | 13 (68.4) | 29.673 | 0.000 |
| BPD (yes) | 41 (17.3) | 39 (17.9) | 2 (10.5) | 0.662 | 0.541 |
| ROP (yes) | 40 (16.9) | 36 (16.5) | 4 (21.1) | 0.257 | 0.537 |
| IVH (yes) | 6 (2.5) | 4 (1.8) | 2 (10.5) | 5.350 | 0.075 |
| PVL (yes) | 8 (3.4) | 6 (2.8) | 2 (10.5) | 3.238 | 0.128 |
Abbreviations: PDA, patent ductus arteriosus; NRDS, neonatal respiratory distress syndrome; EOS, early-onset sepsis; LOS, late-onset sepsis; BPD, bronchopulmonary dysplasia; ROP, retinopathy; IVH, intraventricular hemorrhage; PVL, periventricular leucomalacia.
4.2. Relationship Between Probiotic Prophylaxis and NEC
After adjustment for gestational age, empirical antibiotic duration, RBC transfusion, and late-onset sepsis, probiotic prophylaxis duration was detected to be significantly associated with the NEC risk (Table 4).
Table 4.
Logistic Regression of NEC-Related Factors in Two Groups
| Variables | B | SE | Wals | P | OR | 95% CI |
|---|---|---|---|---|---|---|
| GA | -0.812 | 0.325 | 6.259 | 0.012 | 0.444 | 0.235 - 0.839 |
| Probiotic prophylaxis duration | -0.367 | 0.096 | 14.678 | 0.000 | 0.693 | 0.574 - 0.836 |
| Duration of empirical antibiotic use | 0.460 | 0.187 | 6.016 | 0.014 | 1.584 | 1.097 - 2.287 |
| LOS (yes) | 1.802 | 0.663 | 7.379 | 0.007 | 6.060 | 1.652 - 22.236 |
| RBC transfusion | -0.368 | 0.663 | 0.309 | 0.579 | 0.692 | 0.189 - 2.536 |
Abbreviations: GA, gestational age; NEC, necrotizing enterocolitis; LOS, late-onset sepsis; RBC, red blood cell.
4.3. Predictive Value of Probiotic Treatment Duration
The AUC of the probiotic use duration was 0.870, with a cutoff value of 10.5 days. Considering the Youden’s index of 0.739, the sensitivity and specificity were 0.844 and 0.895, respectively (Table 5 and Figure 1).
Table 5.
Receiver Operating Characteristic Analysis Values of Probiotic Prophylaxis Duration
| Comparison | AUC | Standard Error | P-Value | 95% CI | Sensitivity | Specificity | Youden Index |
|---|---|---|---|---|---|---|---|
| Probiotic prophylaxis duration | 0.870 | 0.042 | 0.000 | 0.788 - 0.953 | 0.844 | 0.895 | 0.739 |
Abbreviations: AUC, area under the curve; OR, odds ratio.
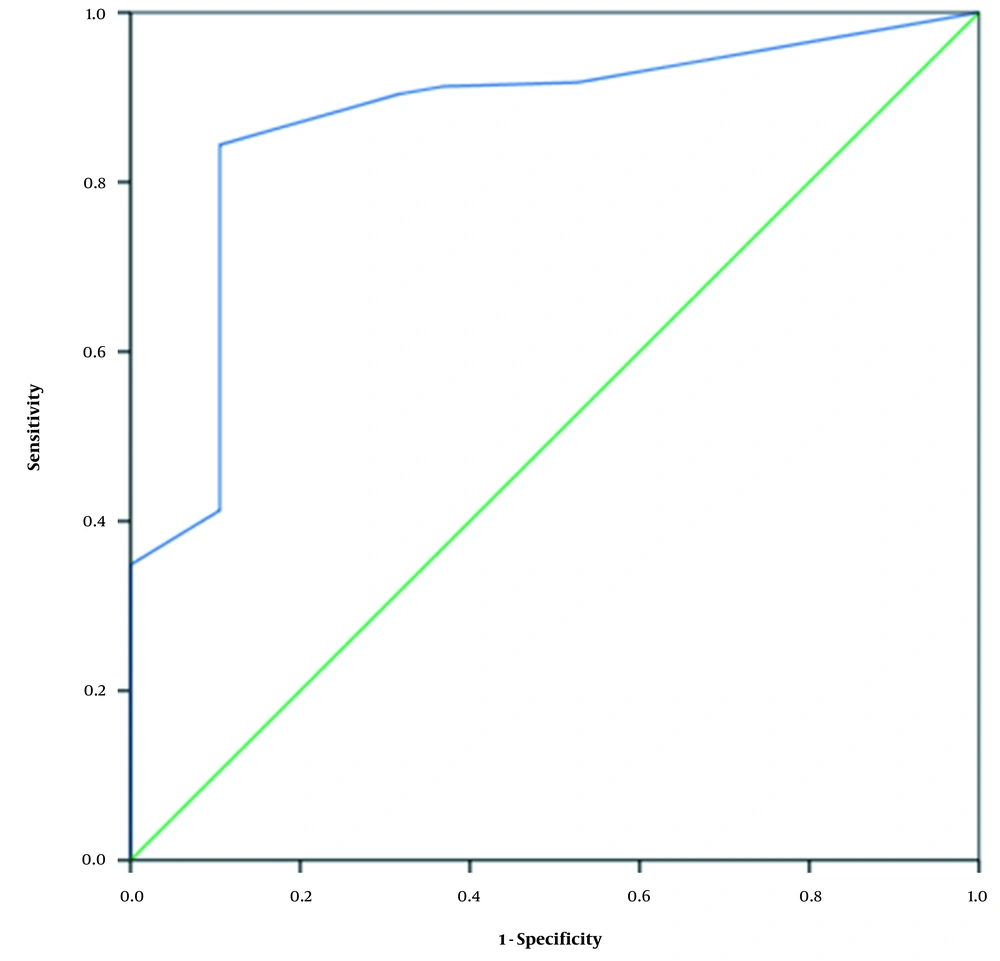
Figure 1.
ROC curve of probiotic prophylaxis duration
5. Discussion
In the present study, 19 (8.02%) neonates were suffering from NEC. According to the findings, the probiotic prophylaxis duration was associated with risk of NEC after adjusting for gestational age, duration of empirical antibiotic use, RBC transfusion, and late-onset sepsis. The probiotic prophylaxis duration had ROC of 0.870, and ideal cutoff of 10.5 days, and sensitivity and specificity of 0.844 and 0.895, respectively.
It is well accepted that probiotics prophylaxis reduces the incidence of NEC. Robertson et al. (17) found out that the NEC rates decrease from 7.5 to 3.1% in a routine probiotic administration cycle. Jiao et al. (18) concluded that using a mixture of probiotics (namely Bifidobacterium and Lactobacillus) reduces the NEC risk (OR = 0.45, 95% CI = 0.25 - 0.80, P = 0.007). Olsen et al. (19) performed a meta-analysis addressing 12 studies on 10,800 premature neonates (5,144 persons receiving prophylactic probiotics and 5,656 cases in control groups). They documented the significantly lower NEC incidence (OR = 0.55, 95% CI = 0.39 - 0.78; P = 0.0006) and mortality (OR = 0.72, 95% CI = 0.61 - 0.85; P < 0.0001) rates in the probiotics group. These findings were consistent with those of the present study.
Regarding the probiotic prophylaxis duration for VLBW neonates, no specific recommendation was put forth. Guthmann et al. (20) conducted a retrospective study and noticed that the effect of the short-term administration of probiotic prophylaxis for 10 - 14 days was not different from that of their long-term administration. Janvier et al. (21) carried out a cohort study in which they administrated a probiotic mixture from the first feed to the 34th weeks. According to their findings, the probiotic administration was a protective factor (OR = 0.51, 95% CI = 0.26 - 0.98). Shashidhar et al. (22) conducted a randomized controlled trial and found the lower incidence of NEC in the probiotic group (4 vs. 12%) receiving probiotic formulation as long as they discharged. The probiotic prophylaxis duration in these studies was not completely similar to that in our research. In the present study, we found that probiotic prophylaxis application > 10.5 days decreased the NEC risk. Accordingly, future researchers are recommended to detect which course of probiotic prophylaxis should be selected, and how extended probiotic prophylaxis should be adopted.
In this study, it was hypothesized that the inconsistencies in the probiotic prophylaxis duration in previous studies might be caused by the usage of empirical antibiotics since the preliminary empirical antibiotic use was correlated with the NEC risk in the present study. Neonates with prolonged empirical antibiotic use had low microbiota diversity. Similarly, Greenwood et al. (23) reported that exposure to antibiotics (5 - 7 days) during the first postnatal week results in a lower variety in the second and third week of life and that Enterobacter spp. is more noticed. Zhu et al. (24) noticed a decrease in microbiota diversity and an increase in pathogenic bacteria after seven days of antibiotic therapy. In our study, the empirical antibiotic use in the non-NEC group (3.45 days) was shorter than that of the NEC group (5.74 days). This difference might be a reason for prolonged antibiotic use (≥ 5 days) to disrupt the preterm microbiota in the NEC group. Meanwhile, the probiotic prophylaxis in the non-NEC group (16.76 days) was longer than that in the NEC group (8.95 days). In other words, its duration in the non-NEC group was about twice as long as the NEC group. In this regard, prolonged antibiotic use might have aggravated the microbiota disorder; however, insufficient probiotic prophylaxis could not alter such a condition. This would lead to an increase in pathogenic bacteria, thereby promoting the incidence of NEC.
There was no consensus on probiotic prophylaxis protecting from NEC. The potential mechanism of probiotic action in the gastrointestinal tract included up-regulation of protective genes (25), down-regulation of pro-inflammatory gene expression and TLR-4 signal (8, 26), barrier maturation support (27), and cellular immunity regulation (28). For example, since the TLR-4 signal plays a central role in the pathogenesis of NEC, the probiotic prophylaxis may pose a protective effect by inhibiting the signal pathways. Previous studies have suggested that Toll-like receptor 4 (TLR-4), stimulated by bacterial products such as lipopolysaccharide (LPS), up-regulates the downstream pro-inflammatory immunological response (29). Bacterial translocation was defined as the passage of bacteria or pathogens through the intestinal barrier into a normally-sterile site. Lack of bacterial diversity and delayed anaerobic bacterial colonization may predispose preterm infants to disease development (30). Probiotics enhance the mucosal barrier, thereby hindering the migration of bacteria and other pathogenic factors (31). Furthermore, an increase in the number of beneficial bacteria such as Bifidobacterium and Lactobacillus inhibits the growth of pathogenic bacteria and up-regulates the immune response. Probiotic prophylaxis may down-regulate the expressions of TLR-4 and other factors mediating a hyper-reactive state in response to microorganism colonization (3). The effective probiotic prophylaxis in our study increased the frequency of beneficial bacteria and decreased the frequency of pathogenic bacteria. This, in turn, would down-regulate TLR-4 signals and inhibit bacterial translocation. In this regard, the protective mechanism of probiotic prophylaxis against NEC is not crystal clear and needs further investigation.
This retrospective study had some limitations. First, it was a single-center study, as such the extrapolation of the research results was limited. Second, only 237 VLBW preterm neonates with 19 NEC infants were included in the study; hence, the statistical power was not acceptable. Finally, the underlying biological mechanisms need to be explored in future studies.
The present study concluded that probiotic prophylaxis decreases the NEC risk in neonates, and that the probiotic prophylaxis > 10.5 days might be considered as an adequate duration.