
1. Background
Cerebral palsy (CP), a neurodevelopmental disorder caused by non-progressive immature brain disturbances, affects 2.11 of every 1000 children in high-income countries and is often considered the most common childhood motor disability (1, 2). CP may lead to disorders in the body structure and function (such as spasticity, muscle weakness, sensory impairments, agonist-antagonist muscle co-activation, and decreased selective motor control), ultimately resulting in the limitations of activity and participation according to the International Classification of Functioning, Disability and Health (ICF) (3, 4).
Regarding the activity domain of the ICF, balance and gait disorders (which play a considerable role in their daily life activities and social participation) are common in children with unilateral CP (5-7). These disorders may occur as a result of 1 or a combination of different factors, such as muscle weakness and abnormal muscle tone, especially involving the hip and pelvis. As the pelvis is a functional component of the lower extremity when standing or walking, changes in pelvic alignment affect balance, gait, and functional mobility (8). One of the factors affecting pelvic alignment in unilateral CP is the imbalance between the hip muscles. While excessive muscle tone in the hip flexors causes weakness in the gluteus maximus (which contributes to upright posture), excessive muscle tone in the hip adductors causes weakness in the gluteus medius (which is the pelvic girdle stabilizer) (9, 10). Therefore, facilitating the gluteal muscles and maintaining pelvic alignment are frequently the focus of physiotherapy approaches in the rehabilitation of children with unilateral CP.
In recent years, studies have emphasized the possible benefits of several methods, such as Kinesio taping (KT), frequently used in the rehabilitation of children with CP. KT is an increasingly popular adjunct to other therapeutic methods due to its relatively low cost, proposed effects, and ease of use in the rehabilitation of children with CP (11). Researchers have reported that the therapeutic goals of KT in children with CP are to stimulate the sensory system by providing proprioceptive feedback, facilitate or inhibit muscle activity, increase the stability of the joints, and support postural alignment (11-13). Given that sensory feedback, especially proprioceptive, is a prerequisite for appropriate motor responses (14), it is assumed that KT application (which provides afferent input by continuously stimulating cutaneous mechanoreceptors and thus allows the central nervous system to receive more sensory input, can result in an improvement in muscle function and movement (13). In a study investigating the immediate-term effects of KT on the quadriceps muscle in children with CP, it was reported that there was a significant improvement in balance and functional mobility (15). Özmen et al. found that KT applied over the gastrocnemius and tibialis anterior muscles improved gait performance, functional mobility, and balance in the immediate term (16). In their studies investigating the medium-term effects of KT on the tibialis anterior, gastrocnemius, rectus femoris, and hamstring muscles, Tabatabaee et al. reported that the balance and functional mobility improved compared to the control group (17, 18).
2. Objectives
To our knowledge, there is no study investigating the effects of KT applied over the gluteus medius/maximus and proximal muscles of the lower extremity in children with CP. Therefore, the primary aim of the present study was to elucidate the immediate and medium-term effects of KT applied over the gluteus medius and maximus muscles on gait and functional mobility in children with unilateral CP. The secondary aim was to elucidate the medium-term effects of KT on gross motor function, balance, and participation. We hypothesized that the KT combined with physiotherapy would improve activity in the immediate term, as well as activity and participation in the medium term compared with physiotherapy alone.
3. Methods
This preliminary single-center, randomized, controlled study was approved by the Ethics Committee of Gazi University (No: E113201) and registered at ClinicalTrials.gov (NCT04932538). Before recruitment, written informed consent was obtained from the legal guardians of participants.
3.1. Participants
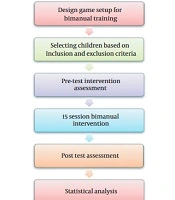
Children with CP aged 6 - 12 years were recruited by convenience sampling from a pediatric center. Inclusion criteria were (1) having a unilateral CP diagnosis made by a pediatric neurologist, (2) having spasticity 2 or less according to the Modified Ashworth Scale at lower extremities (hip flexors, hip adductors, rectus femoris, and gastrocnemius muscles), and (3) being rated as level I or II at the Gross Motor Function Classification System (GMFCS). Exclusion criteria were (1) being unable to follow simple verbal instructions, (2) having allergic reactions to KT, and (3) having a history of any botulinum toxin injection or musculoskeletal surgery at lower extremities in the previous 6 months. A total of 24 children met the inclusion criteria. The children were randomly divided into the KT (n = 12) or control groups (n = 12) in an unbiased manner using a computer-generated block randomization list. The study was completed by 20 children (11 children in the KT group; Figure 1).
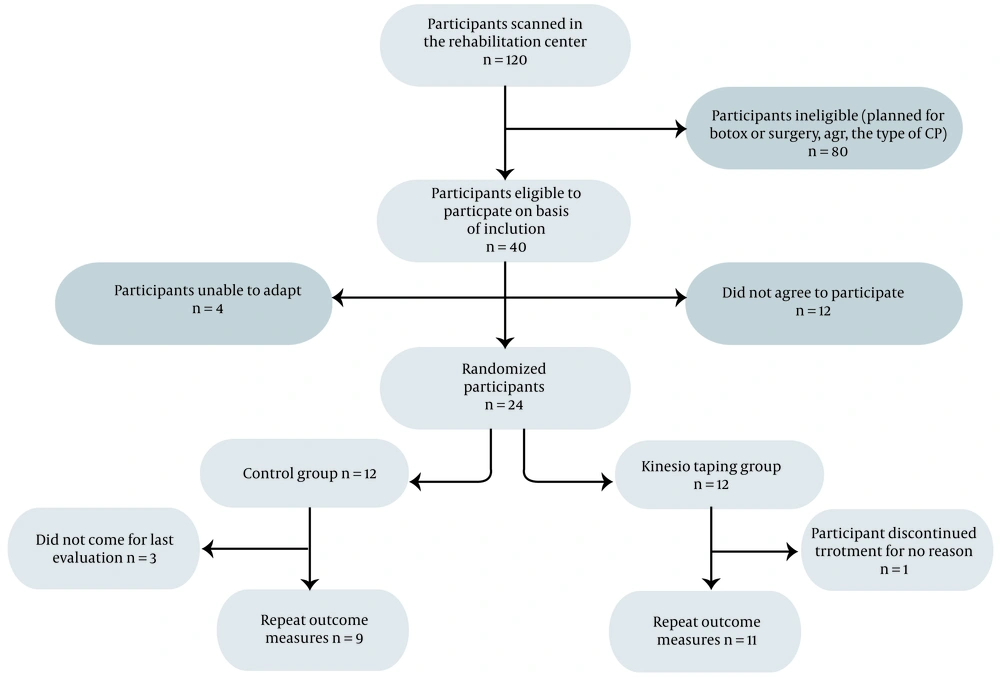
Figure 1.
Flow chart of the participants
3.2. Measurements
The assessments based on the activity and participation dimensions of the ICF were conducted at the beginning (T1: First assessment) and end of the study (T3: Last assessment, after 4 weeks). The activity was evaluated with a BTS G-Walk Spatiotemporal Gait Analysis System, Timed Up and Go test (TUG), Functional Mobility Scale (FMS), Gross Motor Function Measure (GMFM), and Pediatric Balance Scale (PBS); in addition, participation was evaluated using the Canadian Occupational Performance Measure (COPM). Safety was assessed through self-reporting and therapist review.
The BTS G-Walk Spatiotemporal Gait Analysis System was used by one of the researchers (S. O.); other assessments were performed by another researcher (S. N. K.). In the KT group, some assessments were also conducted without removing the tape 30 minutes after the first taping (T2) was applied. During this immediate term, only BTS G-Walk and TUG evaluations were performed. The following assessment tools were used as outcome measures in both groups at the beginning and end of the study:
• The BTS G-Walk Spatiotemporal Gait Analysis System to evaluate gait parameters (19)
• GMFM to evaluate gross motor functions (21)
• PBS to evaluate balance (22)
• COPM to assess participation (23)
3.3. BTS G-Walk Spatiotemporal Gait Analysis System
Using Bluetooth signals, the data detected by the sensor placed at the L5-S1 level of the patient was transferred to a computer. The analysis system, which enables gait analysis by comparing the left and right lower extremities, also allows the analysis of its movements by collecting 3D kinematic data (19). For this analysis, children with CP were asked to walk on a 10-m in-door track 3 times, and the mean of the 3 measurements was used for statistical analysis (24).
3.4. TUG and FMS
TUG is a valid and reliable test for children with CP to measure various components of functional mobility, such as balance, postural control, and walking speed (20). FMS is a valid and reliable instrument to evaluate functional mobility in children with CP, taking into account assistive devices at 3 different distances (500-m community, 50-m school, and 5-m indoor) (21).
3.5. GMFM-66
GMFM is an observational assessment tool used to evaluate 5 dimensions of gross motor functions in children with CP. These dimensions were (A) lying and rolling, (B) sitting, (C) crawling and kneeling, (D) standing, and (E) walking, running, and jumping. As a valid, reliable, and sensitive tool, GMFM measures differences in gross motor functions of children with CP (25). Only dimensions D and E were used in the present study.
3.6. PBS
PBS is a modified version of the Berg Balance Scale to evaluate balance in the context of everyday tasks. This valid and reliable tool includes static and anticipatory balance items, as well as transitional movements (26).
3.7. COPM
COPM is an individual-oriented outcome measure to determine activity limitations and prioritize restrictions in individuals’ participation in occupational performance areas (23). Parents identify and rank 5 occupations using the child-adapted version of the COPM on a scale ranging from 1 to 10, with higher scores pointing out better performance and higher satisfaction without any interference or discussion with the assessor. For each occupation, parents rate the performance and their satisfaction with this performance (27).
3.8. Intervention
Both groups received routine, conventional physiotherapy twice a week for 4 weeks. These routine, conventional physiotherapy sessions, which lasted 40 minutes each, consisted of stretching, weight-bearing, functional reaching, facilitation of gait patterning, and electrotherapy. KT was applied in addition to conventional physiotherapy in the KT group. A 5-cm tape with a width of 5 cm (Kinesio Tex Gold; Albuquerque, New Mexico) was applied and asked to be kept in place for 3 days; then, the taping area was left to rest for 1 day, and KT was re-applied and kept in place for the next 3 days. The KT application was sustained for 4 weeks, 6 days a week.
Using the muscle facilitation technique, KT was applied to the gluteus medius and maximus to facilitate the functions of the muscles. A “Y” tape was used for the gluteus maximus. While the child was side-lying, the hip was flexed and adducted to lengthen the muscle. The starting point of KT was at the center of the sacrum (the origin of the muscle). While the first tail was applied to surround the lower part of the gluteus maximus muscle, the second tail was applied diagonally from the sacrum to the trochanter major (28). For the gluteus medius muscle, two “I” tapes were applied. The hip was adducted and extended to lengthen the muscle during the application. While the first tape was applied from the spina iliaca anterior superior to the trochanter major, the second tape was applied from the spina iliaca posterior superior to the trochanter major. KT was applied by an experienced therapist certified in the Kinesio taping method (29).
3.9. Statistical Analysis
The normal distribution analysis of the data was examined using visual and analytical methods (Shapiro-Wilk test). Because all numeric variables showed non-normal distribution, non-parametric tests were used. Descriptive data are presented using medians and the 25th and 75th centiles for the non-normally distributed variables. Differences between the KT and control groups were analyzed using the chi-square test for categorical variables and the Mann-Whitney U test for numeric variables. The Friedman test was used to compare differences between groups; in addition, if the test result was significant, the Wilcoxon signed‐rank test was used for post hoc comparison with Bonferroni correction (the statistical significance was set at P < 0.0167 for only the post hoc comparison). All statistical analyses were conducted using SPSS version 26 (SPSS Inc, Chicago, IL, USA) with an alpha of 0.05 (30).
The G*Power version 3.1.9.7 (Universitat Düsseldorf, Düsseldorf, Germany) was used for post-hoc power analysis, and the effect size was calculated for the difference in gait symmetry improvement between the groups. According to the analysis, within 95% CI, the alpha level less than 0.05 was accepted as significant, with a total of 20 children with unilateral CP (11 children in the KT group and 9 children in the control group), the power (1-β) was found to be 83%.
4. Results
The sociodemographic characteristics and baseline measurement data of the children who completed the study in the KT (n = 11) and control (n = 9) groups are given in Table 1. Sociodemographic characteristic data indicated that the groups were well-matched in terms of age, body mass index (BMI), sex, more affected side, and functional level. In addition, there were no significant differences between the groups in cadence, gait velocity data, and baseline PBS, TUG, GMFM dimensions D and E, COPM, and FMS scores (P < 0.05). Furthermore, no children reported any adverse effects related to the KT during the study session.
Table 1.
The Characteristics and Baseline Measurement Data of the Children a
| KT Group (n = 11) | Control Group (n = 9) | P-Value | |
|---|---|---|---|
| Age, y | 11.00 (9/12) | 9 (6/12) | 0.188* |
| BMI, kg/m² | 19.22 (17.66/22.50) | 19 (16.90/21) | 0.790* |
| Sex | 0.178** | ||
| Female | 7 (63.6) | 3 (33.3) | |
| Male | 4 (36.4) | 6 (66.7) | |
| More affected side | 0.714** | ||
| Right | 7 (63.6) | 5 (55.6) | |
| Left | 4 (36.4) | 4 (44.4) | |
| GMFCS | 0.343** | ||
| Level I | 6 (54.5) | 6 (66.6) | |
| Level II | 5 (45.5) | 3 (33.3) | |
| PBBS | 48 (41/50) | 49 (45/50) | 0.334** |
| TUG | 8.40 (6.70/10.20) | 7.90 (5.30/9.50) | 0.543** |
| GMFM-66/D (standing) | 45 (40/50) | 52 (49/53) | 0.138** |
| GMFM-66/E (walking, running, jumping) | 11 (10/14) | 12 (10/14) | 0.666** |
| COPM-performance | 20 (10/25) | 20 (15/25) | 0.908** |
| COPM-satisfaction | 15 (10/26) | 11.50 (17/32.50) | 0.646** |
| FMS | 16 (15/18) | 16 (16/18) | 0.572** |
| Cadence | 113.20 (103.30/138.30) | 104.80 (94.60/117.20) | 0.223** |
| Gait velocity | 1.23 (0.99/1.44) | 1.09 (0.90/1.20) | 0.458** |
Abbreviations: KT, Kinesio taping; BMI, body mass index; GMFCS, Gross Motor Function Classification System; PBBS, Pediatric Berg Balance Scale; TUG, Timed Up and Go test; GMFM-66, Gross Motor Function Scale Measure; COPM, Canadian Occupational Performance Measure; FMS, Functional Mobility Scale.
a Values are median (25th/75th centile) for continuous variables and frequency (percentage) for categorical variables. *Mann-Whitney U test. **Chi-square test.
In the control group, there was no significant difference in any of the gait characteristics between the first (T1) and last assessments (T3; P < 0.05; Table 2). In the KT group, while there was a significant difference in cadence (P = 0.004) between the T1 and the 30th-minute assessments (T2), there was a significant difference in pelvic rotation symmetry (P = 0.010) and gait symmetry (P = 0.003) between the T1 and T3. When the TUG times were compared, there was a significant improvement across all assessments in the KT group; however, there was no significant improvement in the control group (Table 2). The improvements in cadence, pelvic tilt symmetry, pelvic rotation symmetry, gait symmetry, and TUG between the T1 and T3 showed a significant difference in favor of the KT group (Table 3).
Table 2.
First, 30th-Minute, and Last Assessments Values of the Groups a
| KT Group (n = 11) | Control Group (n = 9) | ||||||
|---|---|---|---|---|---|---|---|
| T1 | T2 | T3 | P-Value b | T1 | T3 | P-Value c | |
| Gait cycle duration (s) | |||||||
| LAS | 1.08 (0.94/1.30) | 1.09 (0.96/1.20) | 1.04 (0.95/1.09) | 0.622 | 1.13 (1.03/1.33) | 1.15 (1.04/1.28) | 0.672 |
| MAS | 1.07 (0.94/1.29) | 1.08 (.96-/1.19) | 1.04 (0.97/1.14) | 0.843 | 1.11 (1.04/1.21) | 1.11 (1.04/1.20) | 0.343 |
| Stride length (min) | |||||||
| LAS | 1.21 (1.03/1.34) | 1.20 (1.07/1.29) | 1.19 (1.04/1.42) | 0.606 | 1.11 (1.02/1.37) | 1.11 (0.97/1.20) | 0.497 |
| MAS | 1.22 (1.04/1.35) | 1.20 (1.06/1.29) | 1.19 (1.04/1.41) | 0.751 | 1.23 (1.04/1.33) | 1.19 (1.02/1.29) | 0.397 |
| Stance phase (%) | |||||||
| LAS | 63.70 (61.23/64.25) | 60.70 (59.25/63.66) | 62.10 (59.99/64.65) | 0.361 | 58.60 (56.89/62.22) | 59 (57.17/61.20) | 0.672 |
| MAS | 63.40 (58.03/63.81) | 60.60 (58.33/62.55) | 60.80 (57.46/62.44) | 0.686 | 59.20 (56.97/63.06) | 59.10 (55.88/62.60) | 0.128 |
| Swing phase (%) | |||||||
| LAS | 36.30 (35.74/35.76) | 39.30 (36.25/40.77) | 37.90 (35.40/40.05) | 0.384 | 41.40 (38.78/43.52) | 41.30 (39.34/43.34) | 0.566 |
| MAS | 36.60 (36.18/41.96) | 39.40 (37.38/41.65) | 37.30 (36.81/42.07) | 0.426 | 40.40 (36.99/43.24) | 40.30 (36.72/42.87) | 0.456 |
| Single support phase (%) | |||||||
| LAS | 37.40 (36.18/42.01) | 38.80 (37.13/41.42) | 39.20 (37.13-/1.84) | 0.545 | 39 (36.37/41.86) | 36.10 (35.75/41.26) | 0.854 |
| MAS | 37.20 (35.98/39.08) | 38.80 (36.83/ 41.02) | 38.20 (34.95/40.06) | 0.256 | 40.70 (38.15/42.33) | 40.30 (37.81/42.98) | 0.568 |
| Double support phase (%) | |||||||
| LAS | 11.70 (10.53/13) | 11.10 (7.60/12.35) | 9.80 (9.39/12.11) | 0.335 | 9.20 (7.89/11.26) | 9.30 (8.17/10.95) | 0.569 |
| MAS | 12.80 (11.19/13.13) | 10.10 (9.58/12.13) | 11.20 (10.32/13.16) | 0.336 | 9.90 (7.63/12.65) | 9.90 (7.70/12.22) | 0.458 |
| Gait velocity (min/s) | 1.23 (1/1.39) | 1.18 (1.11/1.31) | 1.31 (1.20/1.48) | 0.217 | 1.09 (0.90/1.29) | 0.99 (0.87/1.24) | 0.271 |
| Pelvic obliquity symmetry | 85 (59.01/92.58) | 90 (73.53/96.29) | 92.30 (77.12/96.56) | 0.139 | 91 (83.59/94.40) | 90 (80.30/91.92) | 0.600 |
| Cadence (step/min) | 113.20 (102.81/128.91) | 119 (111.75/135.24) | 120 (116.40/132.35) | 0.002*; ∆T1-T2: 0.004#; ∆T1-T3: 0.033; ∆T2-T3: 0.594 | 104.80 (95.63/116.67) | 105.70 (96.11/116.88) | 0.310 |
| Pelvic tilt symmetry | 38 (22.59/54.91) | 46 (26.26/70.38) | 50 (35.30/76) | 0.012*; ∆ T1-T2: 0.155; ∆ T1-T3: 0.033; ∆ T2-T3: 0.068 | 14 (7.70/24.89) | 15 (8.03/26.13) | 0.176 |
| Pelvic rotation symmetry | 82.10 (55.27/91.57) | 92.90 (71.13/101.35) | 96 (92.65/97.41) | 0.004*; ∆ T1-T2: 0.075; ∆ T1-T3: 0.010#; ∆ T2-T3: 0.168 | 94 (87.41/96.18) | 94.45 (88.62/96.36) | 0.176 |
| Gait symmetry | 76.30 (63.99/86.15) | 86.70 (81.11/90.62) | 93 (87.20/94.57) | < 0.001*; ∆ T1-T2: 0.033; ∆ T1-T3: 0.003#; ∆ T2-T3: 0.016# | 87 (76.50/88.89) | 84.45 (77.94/88.69) | 0.498 |
| TUG (s) | 8.40 (6.97/9.78) | 6.50 (5.79/8.02) | 6 (5.38/7.01) | 0.001*; ∆ T1-T2: 0.003#; ∆ T1-T3: 0.003#; ∆ T2-T3: 0.015# | 7.90 (5.89/9.56) | 8 (5.86/9.55) | 0.739 |
Abbreviations: KT, Kinesio taping; T1, first assessment; T2, 30th-minute assessment; T3, last assessment; LAS, less affected side; MAS, more affected side; TUG, Timed Up and Go test.
a Values are given as median (25th/75th centile). The ∆ represents the change between assessments. #P < 0.0167; *P < 0.05.
b Friedman test
c Mann-Whitney U test
Table 3.
Comparison of Gait Characteristics and Timed Up and Go Test Changes Between the Groups a
| KT Group | Control Group | P-Value b | |
|---|---|---|---|
| Cadence (step/min) | 5.40 (-4.92 / 21.96) | 0.80 (-0.30 / 0.99) | 0.009* |
| Pelvic tilt symmetry | 6.90 (-0.95 / 34.75) | 0 (0.20 / 0.77) | 0.017* |
| Pelvic rotation symmetry | 10 (3.23 / 39.98) | 0.45 (-0.40 / 1.80) | 0.018* |
| Gait symmetry | 9 (5.43 / 26,20) | 1 (- 0.76 / 2) | < 0.001 |
| TUG (s) | -2.18 (-2.99 / -1.36) | 0 (-0.20 / -0.12) | < 0.001 |
Abbreviations: KT, Kinesio taping; TUG, Timed Up and Go test.
a Values are given as median (25th/75th centile). *P < 0.05.
b Mann-Whitney U test
While the KT group showed a significant improvement in PBS, GMFM dimensions D and E, and FMS scores, the control group showed no improvement (Table 4). Although both groups showed significant improvements in COPM performance and satisfaction scores, the KT group showed a greater improvement (Table 4).
Table 4.
Comparison of Gross Motor Function, Functional Mobility, Balance, and Participation Scores Within and Between the Groups a
| KT Group (n = 11) | Control Group (n = 9) | ||||||||
|---|---|---|---|---|---|---|---|---|---|
| T1 | T3 | ∆ | P-Value b | T1 | T3 | ∆ | P-Value b | P-Value c | |
| GMFM-66/D | 45 (40 / 50) | 50 (47 / 55) | 5 (3.16 / 6.29) | 0.003* | 43 (52 / 54) | 44 (53 / 55) | 0 (0 / 1.11) | 0.059 | < 0.001* |
| GMFM-66/E | 11 (10 / 14) | 13 (11 / 14) | 1 (0.5 / 2.32) | 0.011* | 10 (12 / 14) | 10.50 (12 / 14) | 0 (-0.14 / 0.36) | 0.317 | 0.006* |
| FMS | 16 (15 / 18) | 18 (16 / 18) | 0 (-0.11 / 0.29) | 0.015* | 15.50 (16 / 18) | 15.50 (16 / 18) | 0 (0.03 / 0.84) | 1.000 | 0.07 |
| PBBS | 48 (41 / 50) | 53 (47 / 55) | 5 (4.15 / 5.84) | 0.000* | 44 (49 / 52) | 45 (50 / 52.50) | 0 (-0.11 / -1) | 0.102 | < 0.001* |
| COPM-performance | 20 (10 / 25) | 31 (22 / 36) | 9 (4.89 / 17.64) | 0.003* | 20 (15 / 25) | 13.50 (21 / 25.50) | 1 (0.42 – / 1.35) | 0.011* | < 0.001* |
| COPM-satisfaction | 15 (10 / 26) | 30 (22 / 34) | 8 (5.55 / 14.98) | 0.003* | 11.50 (17 / 32.50) | 12 (18 / 33) | 1 (0.43 / 1.11) | 0.008* | < 0.001* |
Abbreviations: T1, first assessment; T3, last assessment; GMFM-66, Gross Motor Function Scale Measure; FMS, Functional Mobility Scale; PBBS, Pediatric Berg Balance Scale; COPM, Canadian Occupational Performance Measure.
a Values are given as median (25th/75th centile). The ∆ represents the change between assessments. *P < 0.05.
b Wilcoxon signed-rank test
c Mann-Whitney U test
5. Discussion
The present study is the first randomized controlled study elucidating the effects of KT applied over the gluteus medius and maximus muscles on gait, functional mobility, gross motor function, balance, and participation in children with CP. Our findings indicated that while KT improves some gait characteristics, functional mobility, gross motor function, balance, and participation in the medium term compared to the control group and alsoimproves cadence and functional mobility in the immediate term.
5.1. Gait Characteristics and Functional Mobility
It is remarkable that the number of studies investigating the effect of KT on gait characteristics in children with CP is limited. In a comparative pilot study, the immediate effects of KT application over the tibialis anterior, rectus femoris, and gluteus maximus muscles on gait characteristics were assessed. The authors reported a significant difference in cadence, stride length, and single support phase after the KT application (31). In our study, the immediate effect of KT was significant in cadence, while the medium-term effect was significant in gait symmetry and pelvic rotation symmetry. The lack of any immediate effect of KT on spatiotemporal parameters of gait, except for cadence, might be caused by the fact that our sample consisted of GMFCS level I and II children whose gait impairment was generally not severe. In a study with a sample of children with bilateral CP, the application of KT on different lower extremity muscles caused differences in gait characteristics than in cadence. In addition, the medium-term increase of gait symmetry and pelvic rotation symmetry in our study might be due to the fact that KT facilitates the gluteus medius and maximus muscles, contributing to pelvic alignment.
In line with our study, Özmen et al., Partoazar et al., and da Costa et al. showed a significant decrease in TUG times of children with CP; also, they indicated that KT had an immediate effect on improving functional mobility (16, 32, 33). Regarding the medium-term effect of KT on functional mobility, our findings agreed with Tabatabaee et al., showing that KT had a significant effect on TUG times after 2 weeks (18). Functional mobility, which plays a major role in daily life activities of children with CP, requires various components, such as muscle strength, gait velocity, and dynamic balance. In our study, improvements in functional mobility might be provided by the KT application over the gluteus medius and maximus muscles to support pelvic alignment and stabilization, affecting balance, gait, and functional performance (8).
5.2. Gross Motor Function, Balance, and Participation
To our knowledge, there is only one study investigating the effect of KT application over lower extremity muscles on gross motor functions in children with CP. Kaya Kara et al. studied the long-term (12 weeks) effects of KT (facilitation technique for gluteus medius and functional correction technique for knee hyperextension and dorsiflexion), reporting that KT had a significant effect on the improvement of gross motor functions, but this effect was not significant compared to the control group (12). However, our findings showed that an increase in gross motor functions was more significant in the KT group than in the control group. There may be several possible explanations for this difference between the 2 studies. First, the weight of the gross motor activity in conventional physiotherapy might affect the improvement in the control groups. Second, the proportion of GMFCS level I children was higher in the study of Kaya Kara et al. Since GMFM scores are likely to reach the highest levels with higher motor skills in children with CP, especially in GMFCS level I, the ceiling effect of GMFM might occur and could not reveal the difference between groups.
Regarding the immediate-term effects of KT on balance in children with CP, Özmen et al. and Ahmadizadeh et al. reported a significant increase in balance scores 48 and 72 hours after KT application compared to baseline (15, 16). In a study investigating the medium-term effects of KT on balance, Tabatabaee et al. reported that the balance significantly improved compared to the control group (18). These studies are consistent with our study, showing a significant improvement in balance in the KT group than in the control group. The KT applied to the gluteal muscles, especially by providing proprioceptive input and facilitating the gluteal muscles, might provide better alignment and stabilization of the hip and pelvis in the frontal and sagittal plane; thus, an improvement in balance parameters might be achieved.
In a systematic review investigating the effect of KT on CP, it was stated that there were only 2 studies assessing participation (11). Both studies evaluated participation in daily life activities using the Functional Independence Measure for Children (WeeFIM). Kaya Kara et al. noted that KT had a significant effect, while Simsek et al. noted no significant effect (12, 34). Considering that participation includes not only activities of daily living but also play, education, leisure time, and social participation (35), it can be said that previous studies have not addressed participation with all its dimensions. However, the present study evaluating participation with COPM and not limiting participation to activities of daily living showed a greater improvement in the KT group. Given the relationship between participation and mobility, it is not surprising that improvements in gait, balance, and functionality affect participation. On the other hand, although there was no improvement in balance and gait, there was a significant improvement in participation in the control group. This may be due to the lack of distinction between participation restrictions concerning the lower and upper extremities; thus, improvement in upper extremity functions due to conventional physiotherapy might result in improved participation.
5.3. Limitations
The current study has some limitations. There was no placebo group and no blindness in the measurements, the sample size was small, and the application time was short. However, the current study can provide preliminary data for further randomized controlled studies that can verify our findings.
5.4. Conclusions
The application of KT to the gluteus medius and maximus muscle combined with conventional physiotherapy can improve cadence and functional mobility in the immediate term, as well as gait and pelvic symmetry, functional mobility, gross motor function, balance, and participation in the medium term in children with unilateral CP. However, further randomized controlled studies addressing large samples and long-term effects are warranted.