
1. Background
Feeding intolerance is defined as a delay in gastric emptying and the presence of a residual volume of previous nutrition in the stomach of more than 50% (1, 2). Feeding intolerance is a common clinical problem among preterm infants with an overall prevalence of 27% (15 - 30%) (3), and in most cases, it indicates a benign condition related to gastrointestinal motility dysfunction due to immaturity of the intestine with delayed meconium passage, although it can be an early sign of necrotizing enterocolitis (NEC), sepsis, or other serious gastrointestinal problems (4-7).
Several growth factors, secreted by the placenta, are found in abundance in the amniotic fluid in the third trimester, affecting the evolution of the gastrointestinal tract (e.g., villi growth and intestinal crypt length). The aforementioned factors include interleukin 8 (IL-8), insulin-like growth factor 1 (IGF-1), erythropoietin (EPO), and granulocyte colony-stimulating factor (G-CSF), all binding to receptors on the gastrointestinal surface of intestinal villi of enterocytes (2, 7-11). On average, about 200 mL/kg/day of amniotic fluid is swallowed by the fetus in the third trimester of pregnancy (10), and this way, cytokines will be available to enterocytes. Granulocyte colony-stimulating factor is a cytokine found in colostrum and human milk that, in addition to acting on bone marrow to produce granulocytes, can also affect the development of enterocyte function (7, 12, 13). Therefore, it is worth noting that minimal enteral feeding by transferring milk G-CSF can contribute to the functional and motor development of the intestine (5, 7, 14).
The goals of full early nutritional support are providing similar growth for the fetus at the same gestational age, reducing the risk of NEC, and optimizing the development of the infant’s nervous system. These goals are, however, not achieved in very low birth weight infants due to intestinal dysmotility, feeding intolerance, and the risk of NEC (5, 14-17). As G-CSF affects the growth and function of enterocytes, it seems to also affect feeding tolerance.
2. Objectives
In order to achieve the goal of complete early nutritional support, this study was designed to investigate the effect of G-CSF on feeding tolerance in very low birth weight infants.
3. Methods
3.1. Study Design and Setting
This randomized, single-blind, placebo-controlled clinical study was performed in the Neonatal Intensive Care Unit (NICU) of Ayatollah Rouhani Hospital, affiliated with the Babol University of Medical Sciences, Babol, Iran, from September 2018 to June 2019.
3.2. Participant and Group Characteristics
The inclusion criteria consist of premature neonates (≤ 32 weeks of gestation) born with a birth weight of ≤ 1200 g without asphyxia at birth (umbilical cord pH ≥ 7.20), those who were not intrauterine growth restricted (IUGR), and infants with no history of shock and absence of gastrointestinal problems (e.g., intestinal obstruction, gastroschisis, omphalocele, and tracheoesophageal fistula). The exclusion criteria consist of neonates with early sepsis and intraventricular hemorrhage (IVH) grade ≥ II, infants with diseases requiring oral medication (except vitamins and supplements), and those suffering from severe and chronic diseases of organ systems, such as the heart, lungs, kidneys, and liver.
3.3. Sample Size
On the basis of a similar study (4), with a 95% confidence interval and a power of 80%, the sample size was calculated to be 34 for each group with a 10% drop in cases.
3.4. Allocation and Processing
Random allocation was performed by a methodologist using Excel 2016 software in 4 blocks. The patients were randomly divided into either Group A (intervention) or Group B (routine care, without intervention).
The instructions for calculating the drug dose were provided by the researcher and project manager to the neonatologist and the ward’s staff. The researcher did not know which neonate was allocated to which groups. The daily examination and evaluation of intolerance signs and symptoms were carried out by the researcher, and all information was recorded in a special form. After declaring the eligibility of patients, intervention was implemented for group A according to the identification numbering.
3.5. Intervention
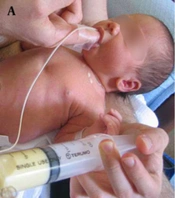
According to the inward protocol, trophic feeding started with their own mothers’ expressed milk from age 48 - 72 hours with a volume of 10 mL/kg/day and then gradually increased based on the infant’s tolerance. In the intervention group, from the third day, simultaneous with the start of expressed breast milk, 4.5 µg/kg of Neupogen filgrastim (300 µg vials or 30 million units made by Amgen, Netherlands) was dissolved in half a milliliter of distilled water and was fed to the neonates by gavage feeding every 12 hours. Then, the gavage tube lid was closed for at least 2 hours. The drug was discontinued for 10 days (2). Other feeding protocols were completely identical in the two groups. The criterion of feeding intolerance was the presence of milk residue in the stomach, more than 50% of the volume of the previous milk (1, 2). Other gastrointestinal complications studied in both groups were abdominal distention, lack of active bowel sounds, bloody stool, and vomiting.
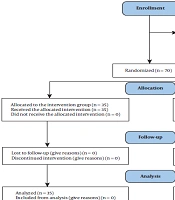
This study followed the CONSORT guidelines for reporting randomized controlled trials (Figure 1).
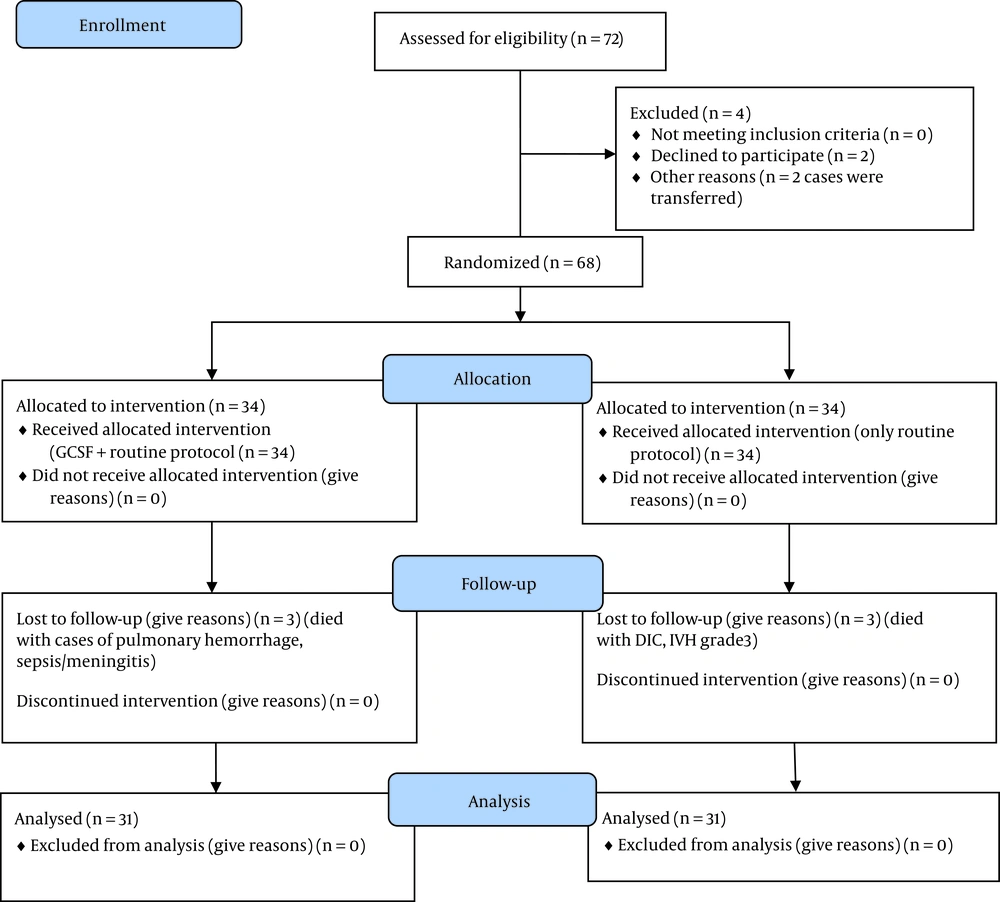
Figure 1.
Flowchart of study (Abbreviations: DIC, disseminated intravascular coagulation; G-CSF, granulocyte colony-stimulating factor; IVH, intraventricular hemorrhage)
The neonates’ demographic and therapeutic information were recorded in a prepared checklist. If there was bile in the gastric lavage, the symptom was seriously considered, the feeding would stop, and the infant was examined for NEC and sepsis. To confirm the diagnosis of NEC, an abdominal X-ray for pneumatosis intestinalis and an ultrasound of the liver for air in the portal vein was performed, and surgical consultation was requested.
The duration of infant feeding that reached 50, 75, and 100 mL/kg/day were determined in both groups, and their mean values were compared. A brain ultrasound was routinely conducted for all premature infants under 34 weeks and under 2 kg during the first week. As it was not possible for the authors to have an ultrasound in the first 3 days, neonates with IVH grade ≥ II were excluded from the study.
3.6. Study Outcomes
3.6.1. Primary Outcomes
The primary outcome was the duration (days) required to reach the infant feeding volume of 50, 75, and 100 mL/kg/day.
3.6.2. Secondary Outcomes
The secondary outcome was the time for the onset of weight gain and the length of hospital stay.
3.7. Specific Definitions
Feeding intolerance was defined as gastric residue more than 50% of the previous feeding volume (2, 18). Necrotizing enterocolitis was determined based on the presence of pneumatosis intestinalis in the abdominal X-ray and was classified based on the modified Bells’ classification (19). Abdominal wall erythema, apnea, lethargy, temperature instability, acidosis, and shock were also regarded as complications during the treatment of NEC. The oral G-CSF prescription was stopped; however, the case was not excluded from the study.
3.8. Data Analysis
3.8.1. Statistical Analysis
Descriptive statistics (mean ± standard deviation) were used to present the data. The student’s t-test was used to compare quantitative parametric variables between the two groups, and the chi-square test was also used for data analysis of categorical variables. All the data were analyzed using SPSS software (version 22.0). Statistical significance was determined through a P-value < 0.050.
3.9. Ethical Considerations
Written informed consent was obtained from all the parents of participants. This study was approved by the Ethics Committee of Babol University of Medical Sciences (code: IR.MUBABOL.HRI.REC.1397.135). It was also registered in the Iranian Registry of Clinical Trials (code: IRCT20180731040650N1).
4. Results
This study thoroughly investigated 68 preterm infants (34 neonates in each group) with a mean gestational age of 28.94 ± 1.59 weeks, birth weight of 1192.35 ± 179.88 g, and hospitalization duration of 42.33 ± 16.79 days. Six infants (3 infants in each group) died during the study; accordingly, 31 infants in each group completed the study (Figure 1). Table 1 shows the demographic information of the two groups.
Table 1.
Frequency of Demographic Variables in Two Groups a
| Variables | Case Group | Control Group | P-Value |
|---|---|---|---|
| Gender | 0.808 a | ||
| Male | 17 (50) | 18 (52.94) | |
| Female | 17 (50) | 16 (47.05) | |
| Gestational age, w | 29.00 ± 1.66 | 28.88 ± 1.53 | 0.763 b |
| Birth weight, g | 1191.32 ± 179.60 | 1193.38 ± 182.86 | 0.963 b |
| pH of umbilical blood | 7.30 ± 0.057 | 7.30 ± 0.071 | 0.941 b |
| Mechanical ventilation | 0.610 a | ||
| Yes | 3 (8.82) | 2 (5.88) | |
| No | 31 (91.17) | 32 (94.11) | |
| Received surfactant | 0.610 a | ||
| Yes | 32 (94.11) | 32 (94.11) | |
| No | 2 (5.88) | 2 (5.88) | |
| IVH grade I | 0.561 a | ||
| Yes | 5 (14.7) | 4 (11.76) | |
| No | 29 (85.29) | 30 (88.23) | |
| Blood culture | 0.329 a | ||
| Growth | 1 (2.94) | 0 (0) | |
| No growth | 33 (97.05) | 34 (100) |
Abbreviation: IVH, intraventricular hemorrhage.
a Values are expressed as No. (%) or mean ± SD.
b The result of the chi-square test
c The result of the independent t-test
Throughout the study, the variable duration of reaching the volume of milk intake to 50, 70, and 100 mL/kg/d was lower in the G-CSF-treated group than in the control group; nonetheless, this difference was significant only in the volume of 100 mL/kg/d (P = 0.029) (Table 2). Additionally, the difference in the duration of reaching 100 mL/kg/d, compared to 50 mL/kg/d, was significantly less in the intervention group (P = 0.005).
Table 2.
Mean ± Standard Deviation of Time for Tolerance of Milk, Start Gaining Weight, and Duration of Hospitalization in Two Groups
| Variables | Case Group | Control Group | P-Value a | Power | Effect Size (95% CI) |
|---|---|---|---|---|---|
| Time for tolerance of 50 cc/kg/d (days) | 8.09 ± 2.93 | 9.83 ± 5.69 | 0.136 | 0.95 | 0.38 (-0.12 - 0.89) |
| Time for tolerance of 75 cc/kg/d (days) | 9.96 ± 3.41 | 11.80 ± 5.85 | 0.135 | 0.95 | 0.38 (-0.12 - 0.89) |
| Time for tolerance of 100 cc/kg/d (days) | 11.12 ± 3.46 | 13.83 ± 5.78 | 0.029 | 0.96 | 0.57 (0.06 - 1.08) |
| Difference in feeding ripening time to 100 relative to 50 cc/kg (days) | 3.03 ± 0.98 | 4.00 ± 1.57 | 0.005 | 0.98 | 0.74 (0.23 - 1.25) |
| Weight gain start time (days) | 10.38 ± 2.38 | 14.00 ± 5.87 | 0.002 | 0.98 | 0.81 (0.30 - 1.32) |
| Duration of hospital stay (days) | 45.70 ± 13.64 | 44.03 ± 14.98 | 0.647 | 0.94 | 0.12 (-0.63 - 0.39) |
Abbreviation: CI, confidence interval.
a The result of the independent t-test
Investigating the onset of the weight gain variable also demonstrated that this time was significantly shorter in the G-CSF group than in the control group (P = 0.002). However, there was no significant difference between the two groups in the length of hospital stay (P = 0.647). Table 2 shows the days for tolerating 50, 75, and 100 mL/kg/d in each group.
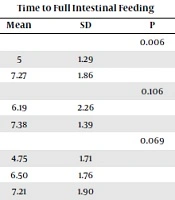
In the intervention group, the difference in the duration of reaching the volume of 50 and from 50 to 100 mL was an average of 3.03 ± 0.98 days; this time lasted for 4.00 ± 1.57 days in the control group (P = 0.005). Figure 2 shows this difference. Despite the side effects of injectable G-CSF, no side effects were observed in this study that could be related to oral use of the drug, although two of 62 neonates died due to sepsis/NEC (one patient in each group) throughout the study.
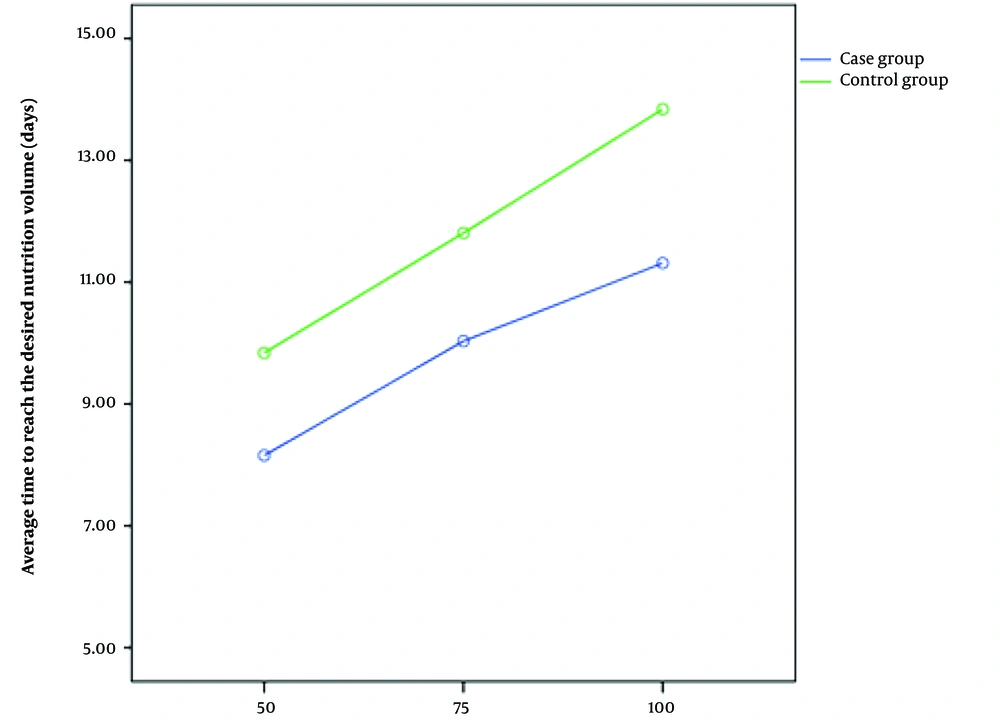
Figure 2.
Duration of infant feeding volume reaching 50, 75, and 100 cc/kg/day in the two groups
5. Discussion
The results demonstrated that the prophylactic administration of G-CSF to preterm infants can significantly reduce the time for the onset of weight gain and the duration of feeding the neonate to full volume (100 mL/kg/day); it, nevertheless, did not affect the length of hospital stay. In line with the results of this study, El-Ganzoury et al. reported that the age for the onset of weight gain in the intervention group was significantly lower than that of the control group (4).
The findings of this study demonstrated that the time to reach milk volume of 50, 75, and 100 mL/kg/d in the intervention group was shorter than in the control group; however, this difference was only significant in the volume of 100 mL/kg/d. This finding is inconsistent with the findings of a research study by Soltani et al. and El-Ganzoury et al., reporting that the achieved studied volume occurred earlier in the intervention group than in the control group. It seems that the smaller sample size in the present study caused that, despite the shorter time for the volumes of 50 and 75 mL/kg/d, it is not statistically significant. In El-Ganzoury et al.’s study, the result was also significant in the volume of 75 mL/kg/d (4, 5). Another reason for this difference might be the lower gestational age of the neonates in this study.
In addition, El-Ganzoury et al. reported that the infants in the intervention group tolerated medication and feeding without any side effects. They reached full feeding sooner, and the risk of NEC and the length of hospital stay were significantly reduced in the intervention group compared to controls (4).
In the present study, although the time for the onset of weight gain and the duration of infant feeding to full volume (100 mL/kg) in the intervention group was significantly reduced compared to that of the control group, the duration of hospitalization was not significantly different between the two groups. This finding is most likely related to the average gestational age of the studied infants. Many neonates have to meet other conditions in addition to complete feeding tolerance for discharge, for example, sufficient ability to suck the breast and discontinue intravenous drugs. In a study conducted by Pratiwi et al. regarding the effect of early feeding on the duration of hospitalization of preterm infants, it was shown that the length of hospital stay is related to gestational age and birth weight, not to early feeding (20).
In relation to the effect of oral G-CSF on the incidence of NEC, the present study did not find any difference between the two groups (one case in each group). However, due to the small sample size, it cannot be claimed with certainty. As studies have shown, the amount of G-CSF in the milk of mothers of preterm neonates during the first few days after delivery is half of the amount in the milk of full-term mothers, and considering the role of this cytokine in the prevention of NEC, it seems that its use can reduce the risk of NEC (7). Accordingly, Canpolat et al. reported that the enteral administration of G-CSF to a group of neonates with a diagnosis of NEC (stage I) showed no progress to a higher grade in the intervention group; nevertheless, the control group showed progression to stage II and III (21).
On the other hand, El-Farrash et al. reported that the use of oral G-CSF in postoperative cases of intestinal obstruction in infants can result in improving feeding tolerance and receiving more calories orally without increasing the risk of NEC (10). Despite the fact that two deaths were observed due to NEC, based on the studies mentioned above, it seems that the oral use of this drug not only has no side effects but also has a protective role. However, regarding the possible side effects of oral use of G-CSF, it is necessary to carry out further studies as systematic reviews.
5.1. Research Limitations
One of the limitations of this study was the lack of evaluation of kangaroo mother care (KMC) time in both groups, as the duration of KMC could affect the weight gain of preterm infants. The study was single-blinded (outcome assessors were blinded). Double-blinding would be optimal to minimize bias. As mentioned above, the small sample size due to the time limit in the implementation of the student project caused differences in the results compared to similar studies. It is suggested to conduct studies with a larger sample size in several centers in order to obtain more reliable results.
5.2. Conclusions
This study showed that the oral administration of G-CSF in preterm infants weighing ≤ 1200 g can improve the feeding tolerance, and the time to reach the intestinal feeding volume of 100 mL/kg/day in the case group was significantly shorter than in the control group.