1. Background
Neonatal sepsis is a clinical syndrome of bacteremia characterized by systemic signs, which may be categorized as early-onset sepsis with acquisition by microorganisms of maternal origin, most commonly associated with Group B streptococci, Escherichia coli, coagulase-negative staphylococci, Haemophilus influenzae, and Listeria monocytogenes. Late-onset sepsis occurs at 4 - 90 days of life and is acquired from the caregiving environment (1). Polymerase chain reaction (PCR) can be used to identify sepsis and the causative organism more quickly than blood cultures alone (2). The hematological scoring system (HSS) can be used either singly or in combinations as an early indicator for a diagnosis of neonatal sepsis (3). CRP levels usually begin to rise within 4 - 6 hours of the onset of sepsis, with peak levels reached within 48 - 72 hours and remaining elevated until resolution of the inflammatory process (4).
Neutrophils are the most abundant cells of the innate immune system. When neutrophils are stimulated by microorganisms, they become activated and increase their oxidative metabolism and unorganized release of toxic derivatives that affect many macromolecules, including proteins, carbohydrates, lipids, and nucleic acids. This results in cell injury and may induce cell death and apoptosis (5). Once the physiological functions of neutrophils have been fulfilled in the tissues, they undergo spontaneous apoptosis to preserve neutrophil membrane integrity in equilibrium with free-radical generation and antioxidant defenses (6). The resolution of inflammation therefore relies on the effective switching-off mechanism of neutrophils, the promotion of apoptosis, and the successful clearance of these cells (7). Great interest in this research area is directed toward targeting apoptosis by treating neutrophil-dominant inflammatory diseases in a timely and controlled manner (8, 9).
2. Objectives
The present study was conducted to assess DNA damage in newborns with neonatal septicemia.
3. Methods
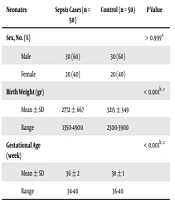
This study was conducted on 60 full-term neonates (40 males and 20 females) with early onset sepsis (EOS), with a mean age of 2.9 ± 1.3 days (Group I). The infants had all been admitted to the neonatal care unit at Menoufia university children’s hospital. Forty-five age- and gender-matched apparently healthy neonates were used as controls (25 males and 20 females with a mean age of 2.8 ± 1.4 days), who were admitted to the nursery for observation due to mild respiratory distress during the first few days of life, with no clinical or laboratory evidence of sepsis. Written informed consent was obtained from the patient’s guardians, and the study was conducted from June 2014 to January 2016. Ethical approval was obtained from the institutional ethics committee. Our protocol conformed to the ethical guidelines of the 1964 Declaration of Helsinki and its later amendments.
The neonates were screened for sepsis using the modified clinical sepsis score (10) and hematological sepsis score (3). Term neonates who were diagnosed clinically and fulfilled at least two septic screening tests were enrolled in the study group. The septic screening involved increased µ-erythrocyte sedimentation rate (µESR), C-reactive protein (CRP), and band-cell count (11). Sepsis was confirmed when blood cultures and septic screenings were positive. To determine the severity of neonatal sepsis, the diagnosis was based on the most recent world health organization multisite study of severe illness in young infants, including the presence of any of the clinical signs and symptoms indicating organ dysfunction, (history of difficult feeding, history of convulsions, movement only when stimulated, respiratory rate of ≥ 60 breaths/min, severe chest in-drawing, temperature of ≥ 37.5°C or ≤ 35.5°C), along with evidence of blood perfusion abnormalities and predicted required hospitalizations for 0 - 7 days in ill neonates (12). Patients with indirect or direct hyperbilirubinemia, prenatal asphyxia, prematurity, postmaturity, and congenital malformations were excluded.
All neonates in this study underwent detailed history-taking with an emphasis on maternal obstetric history, premature or prolonged rupture of membranes, maternal fever, maternal medications or a history of chronic illness before or during pregnancy, and mode of delivery. Thorough general and local-system clinical examinations were performed, including cardiovascular, chest, neurological, abdominal, and skin evaluations. The laboratory investigations included a complete blood count (total and differential), µESR by spectrometric analysis, and CRP using the latex agglutination method (13). As an initial step in the sepsis workup, blood was drawn into blood culture bottles (Egyptian Diagnostic Media) before initiation of antibiotic therapy and under aseptic techniques according to standard microbiological methods (14). Gram-staining and observation under high-power field light microscopy was performed to diagnose sepsis according to the HSS (3), which included total leucocyte count, total polymorphonuclear (PMN) count, immature PMN count, immature/total PMN ratio, degenerative PMN changes, and platelet count.
To detect DNA damage, blood samples were collected from a peripheral vein into heparinized tubes within 24 hours of the diagnosis of sepsis and prior to initiation of antibiotic therapy. The samples were processed immediately to avoid further DNA damage. DNA damage was estimated following DNA extraction using Gene Jet Whole Blood Genomic DNA Purification Mini Kits, then visualized by gel electrophoresis (15).
3.1. Statistical Analysis
Data were analyzed using SPSS version 12 for Windows. Qualitative data are presented as numbers and percentages, whereas quantitative data are presented as mean ± standard deviation with ranges. Student’s t-test was used to test differences in means, while the Mann-Whitney U-test was used for non-parametric statistics. Pearson’s correlation coefficient was used to test the correlation of various variables within the case group. P-values of < 0.05 were considered to show statistical significance.
4. Results
Regarding the demographic data of the studied neonates, the mean age of the patients was 2.9 ± 1.3 days, which was not significantly different from that of the controls (2.8 ± 1.4 days, P > 0.05). The percentage of males was 66.7% in the patient group and 56.7% in the control group. The neonatal sepsis group had significantly lower Apgar scores, with scores of 8 - 10 in 76.6% and 4 - 7 in 23.3% of cases, compared to 100% of the control group having scores of 8 - 10 (P < 0.05). These lower Apgar scores were positively correlated with inhibited neutrophilic apoptosis (r = 0.42). There was no significant difference in the mode of delivery between the patients and controls. The percentage of culture-positive cases in this study was 72.3% (n = 43).
Laboratory investigations showed that total leukocyte count, total PMN, immature PMN count, platelet count, and CRP levels were of statistical significance in a comparison between patients and controls (Table 1). There were significant differences between culture-positive and culture-negative cases with regard to WBC count, hemoglobin level, and immature neutrophils, but no statistically significant differences were found in the other parameters (Table 2). TLC, immature PMN count, and immature/mature PMN ratios showed statistically significant differences between patients with DNA damage and those without DNA damage. Meanwhile, total PMN count, immature/total PMN ratio, and platelet count showed no significant differences.
Table 1.
Laboratory Data of Studied Groupsa
| Parameter | Patients | Controls | Test | Value | P-Value |
|---|---|---|---|---|---|
| TLC, ×103/µL | 17.5 ± 5.4 | 7.9 ± 2.8 | T-test | 8.07 | < 0.001 |
| Total PMN count, ×103/µL | 9.7 ± 4.6 | 4.23 ± 1.4 | Mann-Whitney U-test | 89.0 | < 0.001 |
| Immature PMN count, ×103/µL | 2.8 ± 2.2 | 0.7 ± 0.1 | Mann-Whitney U-test | 96 | < 0.001 |
| Immature/total PMN ratio | 0.31 ± 0.22 | 0.14 ± 0.01 | Mann-Whitney U-test | 213 | < 0.001 |
| Immature/mature PMN ratio | 0.88 ± 1.17 | 0.17 ± 0.08 | Mann-Whitney U-test | 219.5 | < 0.001 |
| Platelet count, ×103/µL | 149.6 ± 82 | 228.3 ± 36.2 | Mann-Whitney U-test | 124.5 | < 0.001 |
| C-reactive protein, mg/L | 13.6 ± 4.9 | 4.1 ± 1.4 | Mann-Whitney U-test | 81 | < 0.001 |
Abbreviations: TLC, total leukocyte count; PMN, polymorphonuclear.
aValues are expressed as mean ± SD.
Table 2.
Hematological Findings in Relationship to Blood Culture Results Among Patients With Neonatal Sepsis
| Mean ± SD | Blood Culture | Testa | P-Value | |
|---|---|---|---|---|
| + | − | |||
| Hemoglobin, g/dL | 13.71 ± 1.82 | 12.52 ± 2.9 | 1.48 | 0.014 |
| TLC, ×103 | 16.99 ± 7.58 | 8.45 ± 6.02 | 2.89 | 0.004 |
| Immature PMN count, ×103 | 2.34 ± 1.09 | 1.48 ± 0.77 | 2.26 | 0.024 |
| Immature/total PMN ratio | 0.23 ± 0.14 | 0.18 ± 0.07 | 1.19 | 0.23 |
| Platelet count, ×103 | 195.72 ± 84.67 | 161.65 ± 88.34 | 0.91 | 0.35 |
aMann-Whitney U-test.
In our study, sepsis was likely in 41 (68.3%) patients with a score of 3 or 4 and a CRP of 12 - 48 mg/L, while sepsis was very likely in 19 (31.7%) patients classified as having no DNA damage, a score of ≥ 5, and CRP of 48 - 96 mg/L. Sepsis was unlikely in all of the controls, who had scores of ≤ 2 according to the HSS (Table 3). On the other hand, by considering blood cultures as the gold standard for diagnosing infected neonates, a highly significant negative correlation (r = -0.708, P = 0.001) was found between culture-positive cases and those without DNA damage, with 29 patients representing 67.4% of culture-proven sepsis cases. In terms of DNA changes, 26 (43.3%) patients and 5 (11%) of the controls had DNA damage, in contrast to 34 (56.7%) patients with no damage. DNA damage was in the form of hazy fragmented DNA as detected by gel electrophoresis (Figure 1). There was a highly significant negative correlation between DNA damage and CRP levels (r = 0.804, P < 0.001). DNA damage was more common in neonates with lower hematological scores and CRP levels (Table 4). Similar findings were observed when analyzing the relationship between DNA damage and blood culture results; inhibited neutrophilic apoptosis was correlated with the severity of neonatal sepsis and blood culture positivity (Table 5).
Table 3.
Relationship Between DNA Damage and HSS in Patientsa
| Scoring System | Patients (n = 60) | X2 | P-Value | |
|---|---|---|---|---|
| DNA damage, (n = 26) | No DNA damage, (n = 34) | |||
| TLC (×103) | 1.35 | > 0.05 | ||
| Score (0) | 20 (76.9) | 21 (61.7) | ||
| Score (1) | 6 (23.1) | 13 (38.2) | ||
| Total PMN count, ×103 | 1.26 | > 0.05 | ||
| Score (0) | 9 (34.6) | 5 (14.7) | ||
| Score (1) | 17 (65.4) | 29 (85.3) | ||
| Immature PMN count (×103) | 8.0 | < 0.05 | ||
| Score (0) | 7 (27) | 0 (0) | ||
| Score (1) | 19 (73) | 34 (100) | ||
| Immature/total PMN ratio | 4.15 | < 0.05 | ||
| Score (0) | 11 (42.3) | 4 (11.7) | ||
| Score (1) | 15 (57.7) | 30 (88.3) | ||
| Immature/mature PMN ratio | 4.513 | < 0.05 | ||
| Score (0) | 17 (65.4) | 5 (14.7) | ||
| Score (1) | 9 (34.6) | 29 (85.3) | ||
| Degenerative changes | 3.17 | > 0.05 | ||
| Score (0): none | 20 (77) | 14 (41) | ||
| Score (1): toxic granules or cytoplasmic vacuoles | 6 (33) | 20 (59) | ||
| Platelet count, ×103 | 0.62 | > 0.05 | ||
| Score (0) | 15 (57.7) | 18 (53) | ||
| Score (1) | 11 (42.3) | 16 (47) | ||
aValues are expressed as No. (%).
Table 4.
Relationship Between Severity of Sepsis and DNA Damage in Sepsis Patientsa
| Sepsis Degree | HSS | CRP, mg\L | Patients (n = 60) | Total, (n = 60) | |
|---|---|---|---|---|---|
| DNA damage, (n = 26) | No DNA damage, (n = 34) | ||||
| Mild | Sepsis likely likely (score 3 or 4) | 12 | 21 (80.7) | 2 (5.9) | 23 (38.3) |
| 24 | 5 (19.3) | 2 (5.9) | 7 (11.7) | ||
| 48 | 0 (0) | 11 (32.3) | 11 (18.3) | ||
| Severe | Sepsis very likely (score ≥ 5) | 54 | 0 (0) | 7 (20.6) | 7 (11.7) |
| 96 | 0 (0) | 12 (35.3) | 12 (20) | ||
Abbreviations: HSS, hematological scoring system; CRP, C-reactive protein.
aValues are expressed as No. (%).
Table 5.
Relationship Between Blood Culture Results and DNA Damage in Patients With Neonatal Sepsisa
| Blood Culture | Sepsis Degree | CRP, mg/dL | DNA Damage (n = 26) | No DNA Damage (n = 34) |
|---|---|---|---|---|
| Culture-unproven negative | Mild | 12 | 8 (30.9) | 2 (5.9) |
| 24 | 5 (19.2) | 2 (5.9) | ||
| Culture-proven positive | Mild | 48 | 5 (19.2) | 1 (2.9) |
| Severe | 54 | 5 (19.2) | 13 (38.2) | |
| 96 | 3 (11.5) | 16 (42.1) |
aValues are expressed as No. (%).
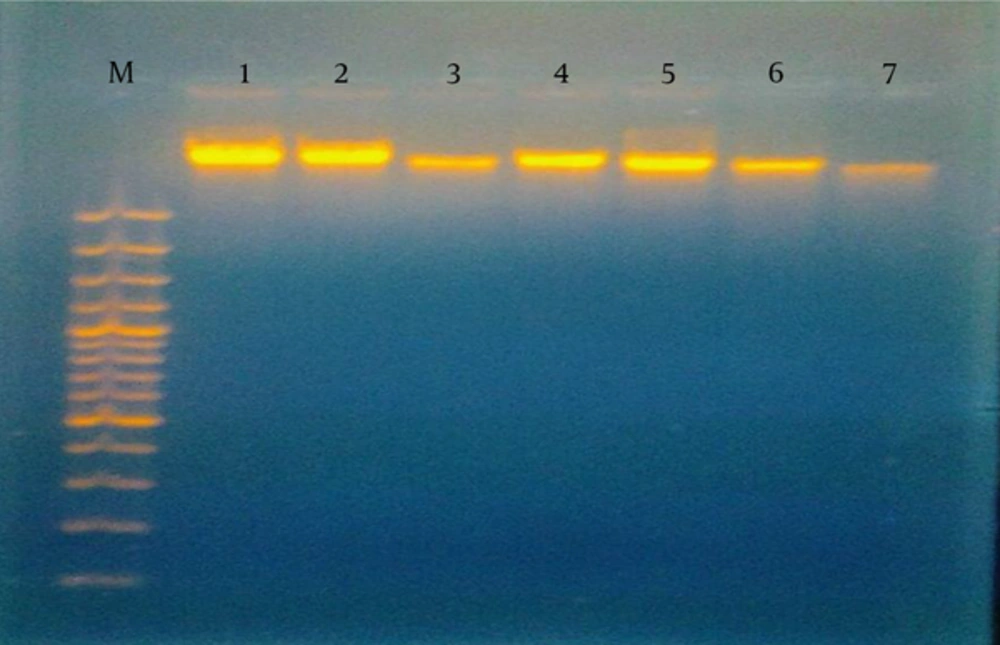
Figure 1.
M, 100 bp DNA ladder, lanes 1, 2, 4, and 5 show normal DNA patterns; lanes 3, 6, and 7 show hazy fragmented DNA.
5. Discussion
Neonatal sepsis is a major cause of morbidity and mortality during the first 28 days of life, contributing to 13% - 15% of all neonatal deaths (16). Our study showed a higher prevalence (66.7%) of neonatal sepsis among males compared to females. This was in accordance with Stoll in 2008 (17), who found that males have an approximately two-fold higher incidence of sepsis than females, suggesting the possibility of a sex-linked factor in host susceptibility. There was no difference between our patients and the controls with regard to parity, mother’s age, and mode of delivery. In contrast to the results of our study, Hornik et al. (18) showed that babies born by vaginal delivery are more likely to have early onset sepsis than those delivered by cesarean section. Significantly lower Apgar scores were found in our patients compared to the controls. In agreement with our study, Strunk et al. (19) revealed that a low Apgar score at one minute might be attributed to neonatal sepsis, especially in the presence of risk factors for infection. The diagnosis of neonatal sepsis is a particular challenge; however, blood cultures remain the cornerstone for its evaluation; this was evident in our study, which revealed that sepsis severity was correlated with blood culture positivity among non-damaged DNA patients. This was in accordance with El Kebir and Janos (20), who showed that suppressed neutrophil apoptosis has been detected in patients with inflammatory diseases, such as acute respiratory distress syndrome, pneumonia, and sepsis. A frequent finding in these studies is the correlation of neutrophil apoptosis with the severity and/or outcome of the disease. The mean platelet count was significantly lower in the sepsis patients in the present study. Guida et al. (21) revealed that thrombocytopenia in neonatal sepsis is a combination of diffuse endothelial cell injury, bacterial/fungal toxins, increased platelet activation, and disseminated intravascular coagulation, resulting in increased platelet consumption and inadequately increased platelet production during sepsis.
In terms of DNA changes in our study, DNA damage was reported in 26 (43.3%) patients and 5 (11%) controls. Priyadharshini et al. (22) stated that inflammatory mediators released in response to toxins cause free-radical injury, which is explicated as DNA damage and can predict the severity and clinical outcome of neonatal sepsis. Carvalho et al. (23) reported DNA damage in neonatal sepsis as measured by the comet assay, and studied the diagnostic value of this assay in neonatal sepsis. In accordance with our study, Delanghe and Speeckaert (24) showed that antiapoptotic factors inhibit apoptosis during sepsis through intrinsic and extrinsic signaling pathways. This mechanism is involved in delayed neutrophil apoptosis. Meem et al. (25) also showed that pro-inflammatory cytokines, secreted after contact of neutrophils with lipopolysaccharides (LPS) in the cell membranes of invading micro-organisms, strongly contribute to the inhibition of neutrophil apoptosis. Garcia et al. (26) revealed that delayed neutrophilic apoptosis and inadequate resolution of inflammation play a critical role in severe septic conditions, as well as in immune complex-mediated diseases. In this study, there was DNA damage in five (11%) of the controls, which may be explained by the fact that some had mild respiratory distress with no evidence of sepsis. Yang et al. (27) observed that spontaneous in vitro granulocyte apoptosis at 6 hours, as reflected by phosphatidyl serine expression on the cell surface, was higher in granulocytes from human umbilical cord blood than in those from adult blood, and that DNA fragmentation, which is a late apoptotic marker, occurs by induction of granulocyte apoptosis. Scheel-Toellner et al. (28) found that neutrophils die even in the absence of any extrinsic factors, which is known as spontaneous death. Regimens such as the use of antioxidants may be useful in controlling septic granulocytopenia (30).
The results of our study revealed that there were negative correlations between the sum of the HSS, blood culture results, and CRP levels with regard to DNA damage in neonatal sepsis patients. Paunel-Gorgulu et al. (31) showed that the severity of sepsis correlated with reduced neutrophil apoptosis further supports the importance of neutrophil activity in the pathophysiology of sepsis, and drugs designed to target apoptotic signaling in neutrophils during sepsis may help to modulate the lifespan of neutrophils, thus preventing host tissue damage under these conditions. Furthermore, patients with septic shock who receive donor granulocytes show improvements in various biomarkers of sepsis, as well as decreased sepsis severity (32, 33).
5.1. Conclusion
CRP and morphological and degenerative changes in neutrophils are used not only for the early detection of neonatal sepsis but also to determine its degree of severity, which is shown on the basis of blood cultures. DNA damage and apoptotic changes in neutrophils can reflect the patient’s immune status and help in the assessment of the severity of neonatal sepsis.