


1. Background
2. Objectives
3. Methods
3.1. Study Design
3.1.1. Inclusion Criteria
3.1.2. Unmet Criteria
3.1.3. Exclusion Criteria
3.2. Study Protocol
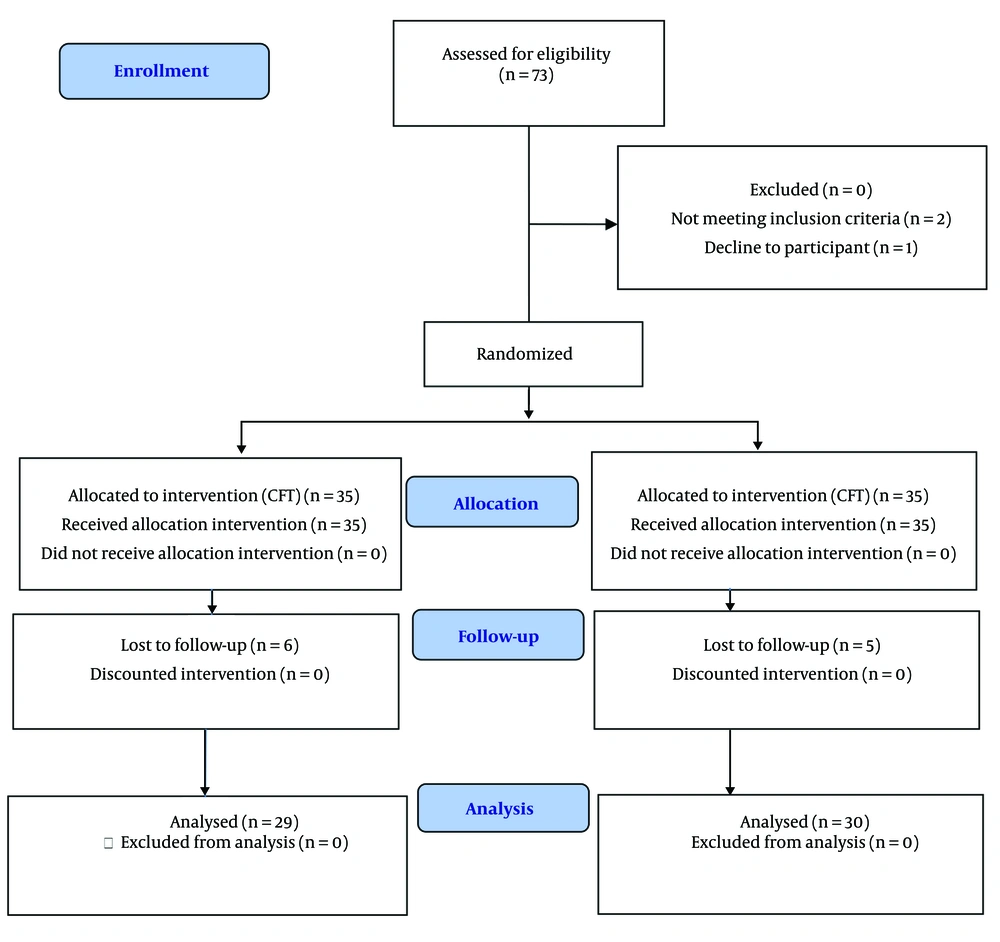
Study protocol
3.3. Tools
3.4. Statistical Analysis
4. Results
| Variables | Placebo (n = 35) | Treatment (n = 35) | P-Value |
|---|---|---|---|
| Age (y) | 37.5 ± 11.5 | 33.9 ± 7.9 | 0.128 |
| Gender | 0.231 | ||
| Female | 21 (60) | 16 (45.7) | |
| Male | 14 (40) | 19 (54.3) | |
| Duration (y) | 14.2 ± 9.4 | 12.5 ± 6.5 | 0.370 |
| Education | 0.443 | ||
| Before college | 11 (31.4) | 8 (22.9) | |
| College | 14 (40.0) | 12 (34.2) | |
| After college | 10 (28.6) | 15 (42.9) | |
| Complications b | 0.205 | ||
| Yes | 31 (88.6) | 27 (77.1) | |
| No | 4 (11.4) | 8 (22.9) |
a Values are expressed as No. (%) or mean ± SD.
b Such as dizziness, headache, nausea, vomiting, heart palpitations, cardiac arrhythmia, shortness of breath, dry mouth, blurred vision, skin itching or weakness.
4.1. Evaluation of Crude P-Value
| Variables and Months | Placebo (n = 35) | Treatment (n = 35) | Crude P-Value | Adjusted Effect Size P-Value b | Follow-up Effect P-Value | Modifier Effect P-Value |
|---|---|---|---|---|---|---|
| GSH | 0.004 c | - | - | |||
| Base | 2.17 ± 0.71 | 2.23 ± 0.69 | 0.709 | |||
| 2 | 1.98 ± 0.66 | 2.32 ± 0.59 | 0.044 | |||
| SAPS | 0.004 c | 0.573 | 0.158 | |||
| Base | 11.17 ± 5.73 | 10.97 ± 5.37 | 0.881 | |||
| 1 | 11.61 ± 5.81 | 10.65 ± 5.55 | 0.492 | |||
| 2 | 11.50 ± 5.88 | 10.62 ± 5.21 | 0.881 | |||
| SANS | 0.062 | 0.117 | 0.130 | |||
| Base | 23.83 ± 7.21 | 20.83 ± 5.98 | 0.062 | |||
| 1 | 24.18 ± 7.26 | 20.91 ± 5 .97 | 0.048 | |||
| 2 | 23.80 ± 7.10 | 20.72 ± 5.74 | 0.073 | |||
| Attention | 0.545 | 0.590 | 0.545 | |||
| Base | 11.51 ± 2.02 | 11.80 ± 1.59 | 0.513 | |||
| 1 | 11.61 ± 2.04 | 11.82 ± 1.60 | 0.629 | |||
| 2 | 11.83 ± 1.82 | 12.03 ± 1.80 | 0.671 | |||
| Memory | 0.971 | 0.259 | 0.434 | |||
| Base | 12.17 ± 2.36 | 12.34 ± 1.73 | 0.730 | |||
| 1 | 12.12 ± 2.41 | 12.35 ± 1.76 | 0.653 | |||
| 2 | 12.27 ± 2.45 | 12.59 ± 1.84 | 0.574 | |||
| Executive | 0.216 | 0.589 | 0.662 | |||
| Base | 11.16 ± 2.57 | 11.27 ± 2.91 | 0.862 | |||
| 1 | 10.97 ± 2.54 | 11.37 ± 2.99 | 0.560 | |||
| 2 | 10.92 ± 2.90 | 11.64 ± 3.11 | 0.361 | |||
| Visual-constructional | 0.003 c | 0.074 | 0.035 c | |||
| Base | 11.31 ± 1.71 | 11.57 ± 1.85 | 0.548 | |||
| 1 | 11.09 ± 1.84 | 11.65 ± 1.92 | 0.231 | |||
| 2 | 11.13 ± 2.10 | 12.21 ± 1.78 | 0.039 | |||
| Language | 0.997 | 0.263 | 0.997 | |||
| Base | 16.09 ± 1.56 | 16.09 ± 1.48 | 1.000 | |||
| 1 | 16.03 ± 1.59 | 16.09 ± 1.51 | 0.879 | |||
| 2 | 16.03 ± 1.59 | 16.14 ± 1.60 | 0.802 | |||
| NUCOG | 0.008 c | 0.870 | 0.046 c | |||
| Base | 62.24 ± 4.07 | 63.07 ± 3.80 | 0.382 | |||
| 1 | 61.82 ± 4.16 | 63.28 ± 4.01 | 0.148 | |||
| 2 | 62.18 ± 4.24 | 64.60 ± 4.10 | 0.030 |
Abbreviations: GSH, glutathione; SAPS, Scale for Assessment of Positive Symptoms; SANS, Scale for Assessment of Negative Symptoms; NUCOG, neuropsychiatry unit cognitive assessment tool.
a Values are expressed as mean ± SD.
b Extracted results using ANCOVA repeated measure controlling for baseline, age, gender, duration, and education.
c P < 0.05 was considered statistically significant.
4.2. Evaluation of Adjusted Effect Size P-Value
4.3. Assessment of Follow-up Effect P-Value
4.4. Analysis of Modifier Effect P-Value
| Variables and Months | Β [95%CI] | P-Value |
|---|---|---|
| SAPS | ||
| 1 | 0.47 [0.14; 0.81] | 0.006 a |
| 2 | 1.1 [0.19; 1.99] | 0.018 a |
| SANS | ||
| 1 | 0.07 [-0.03; 0.18] | 0.163 |
| 2 | 0.58 [-0.09; 1.25] | 0.087 |
| Attention | ||
| 1 | 0 | - |
| 2 | -0.41 [0.21; 0.11] | 0.545 |
| Memory | ||
| 1 | 0.043 [-0.03; 0.11] | 0.278 |
| 2 | -0.04 [-0.26; 0.17] | 0.687 |
| Executive function | ||
| 1 | -0.1 [-0.26; 0.06] | 0.226 |
| 2 | -0.16 [-0.47; 0.15] | 0.306 |
| Visuospatial | ||
| 1 | -0.27 [-0.51; -0.02] | 0.031 a |
| 2 | 0.69 [-1.1; -0.24] | 0.003 a |
| Language | ||
| 1 | 0 | - |
| 2 | 0 [-0.17; 0.17] | 0.997 |
| Total | ||
| 1 | -0.27 [-0.59; 0.04] | 0.090 |
| 2 | -0.84 [-1.45; -0.22] | 0.009 a |
Abbreviations: SAPS, Scale for Assessment of Positive Symptoms; SANS, Scale for Assessment of Negative Symptoms.
a P-value < 0.05 is considered statistically significant.
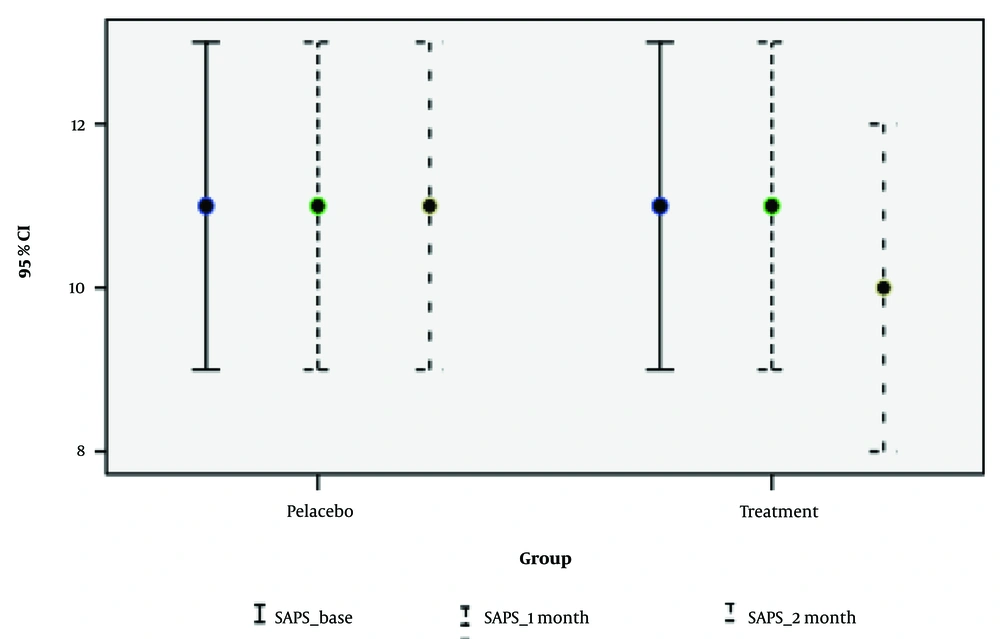
Mean score of Scale for Assessment of Positive Symptoms (SAPS) at baseline, one and two months based on add-on N-acetylcysteine (NAC) with rout-in therapy in schizophrenia inpatients
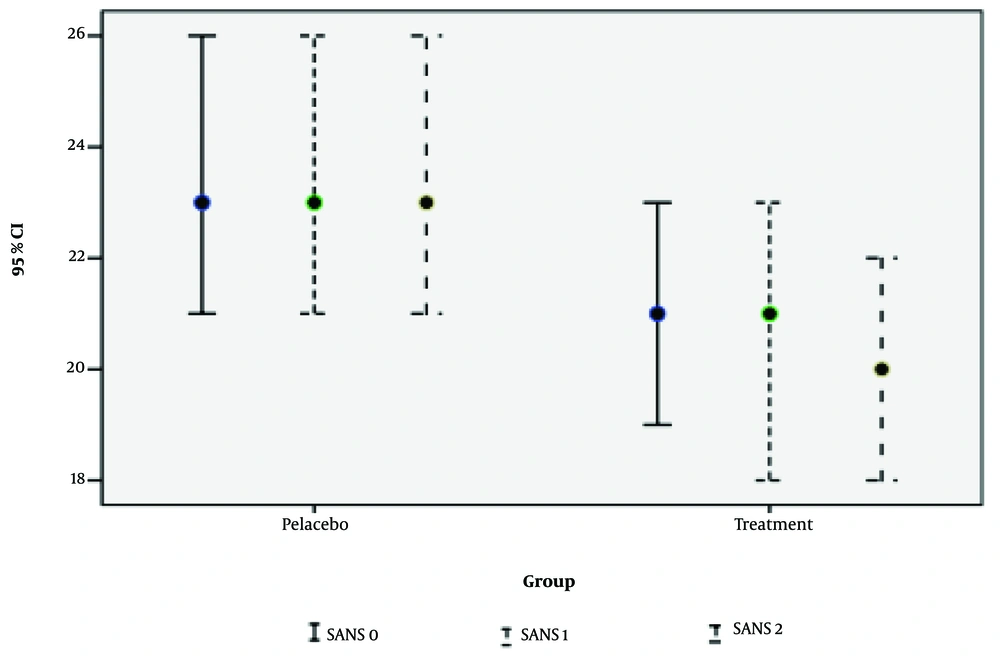
Mean score of Scale for Assessment of Negative Symptoms (SANS) at baseline, one and two months based on add-on N-acetylcysteine (NAC) in schizophrenia inpatients
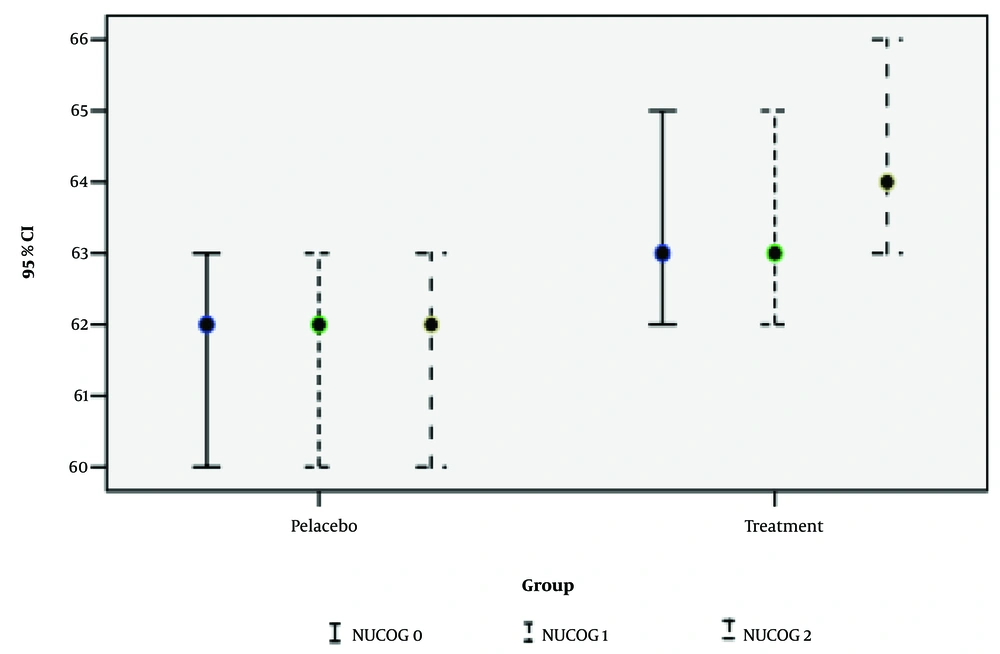
Mean score of neuropsychiatry unit cognitive assessment tool (NUCOG) at baseline, one and two months based on add-on N-acetylcysteine (NAC) in schizophrenia inpatients


