
1. Background
Emotions play a crucial role in human life, influencing learning, understanding, and decision-making processes while adding color and vitality to everyday experiences (1). Despite their importance, scientific knowledge of emotions remains limited, and there is ongoing debate regarding how to distinguish them from other cognitive aspects (2). Personality is a set of behaviors, cognitions, and affective patterns shaped by biological and environmental factors (3). The big five personality traits theory, developed by Costa and McCrae, is widely regarded as the most comprehensive theory in the field of personality. One of the commonly used tests to assess the big five traits is the NEO-Five-Factor Inventory (NEO-FFI), which measures openness, conscientiousness, extraversion, agreeableness, and neuroticism (4).
A significant relationship has been found between brain structure and personality traits (5). Personality traits have been shown to influence emotion processing, with extraversion linked to processing positive emotions and neuroticism to processing negative emotions (6). Moreover, personality traits impact the functional connectivity between brain regions involved in emotional processing. For instance, individuals high in extraversion exhibit increased connectivity between the amygdala and prefrontal cortex during emotional processing (7), suggesting a potential influence of personality on connectivity.
Electroencephalography (EEG) is a non-invasive electrophysiological method for recording brain activity, enabling researchers to investigate brain function (8). One type of study in the field of emotion research involves inducing emotions and recording changes in brain activity through quantitative analysis of EEG (9). Studies investigating the relationship between personality, emotions, and EEG have focused mainly on only two of these three factors (10-12), with limited exploration of the role of personality on brain activity during emotional induction. The methods used to elicit emotional responses have varied, with some studies using recall or imagination (13), sounds (14, 15), pictures (16, 17), or video clips (VC) (18, 19), which are considered to be more natural and reflective of daily life situations. Additionally, some studies have used small sample sizes (20, 21), included only homogeneous participant groups (22), and often failed to account for gender differences (20). These methodological differences have led to inconsistent results across studies (23, 24).
2. Objectives
This study aims to delve into the findings of EEG, exploring the relationship between emotional video stimuli and brain activity in a broader range of individuals, with a specific focus on the big five personality traits. By examining how different personality traits influence the brain's response to emotional videos, we can gain a deeper understanding of the complex interplay between emotions and brain function.
3. Methods
This analytic observational study is reported using the strengthening the reporting of observational studies in epidemiology (STROBE) guidelines (25). The study was conducted at Zare Psychiatric Hospital in Sari, Iran, from March to September 2023.
3.1. Study Size
Based on previous studies, the standard deviations of personality traits were as follows: Agreeableness (SD = 0.56), conscientiousness (SD = 0.75), neuroticism (SD = 0.86), openness (SD = 0.84), and extraversion (SD = 0.76) (26). To ensure the selection of the optimal number of samples, the value of the most significant standard deviation (SD = 0.86) was considered to estimate the sample size. A sample size of 62 participants was determined using the following formula (S = 0.86, α = 0.05 then Z1-α/2 = 1.96, β = 0.20 then Z1-β = 0.84, E = 0.37).
3.2. Participants
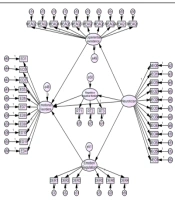
As illustrated in Figure 1, initially, 382 individuals responded to an Instagram advertisement. Following eligibility screening based on inclusion criteria, 62 participants (31 women and 31 men) were randomly selected for the study. For the purpose of this study, it was crucial to evaluate healthy adults.

Figure 1.
The strengthening the reporting of observational studies in epidemiology (STROBE) flowchart
The inclusion criteria were as follows: (1) Age between 20 and 40 years; (2) no history of psychiatric disorders in the individual or their first-degree family members; (3) no use of psychiatric drugs in the last six months or other medications in the previous two weeks; (4) no history of brain concussion resulting in unconsciousness, head or brain-related surgeries, or scars in the head area; (5) no history of stroke, multiple sclerosis, migraines, seizures, heart disease, or visual/hearing impairments; (6) no history of substance abuse; (7) and a score of less than 21 on the 28-item General Health Questionnaire (GHQ-28). The test includes four subscales: Somatic symptoms, anxiety and sleep disorders, social dysfunction, and depression symptoms. The criterion for discontinuation included participants who could not tolerate the EEG cap or were unwilling to continue participating in the study.
3.3. Study Variables
3.3.1. Outcomes
Changes in brain wave power relative to the resting state.
3.3.2. Exposures
Five audiovisual emotional stimuli, including sad, happy, anger, fear, and emotionally neutral videos.
3.3.3. Predictors
Big five personality traits, including neuroticism, extraversion, openness, agreeableness, and conscientiousness.
3.3.4. Effect Modifier
The relationship between personality factors and brain wave power during emotional stimuli varies depending on gender.
3.3.5. Potential Confounders
3.3.5.1. Dominant Hand
The participants' dominant hand could be a confounding factor in brain response to emotional stimuli. Data were analyzed to find the effect of the dominant hand.
3.3.5.2. Order of Presenting the Videos
3.4. Materials
3.4.1. Videos
We utilized videos developed in our previous study to assess the impact of different emotions on individuals. These consisted of five four-minute audiovisual Farsi videos, each designed to elicit a specific emotional response. The videos were categorized into four emotional categories: Sad, happy, angry, and fearful, with an additional video classified as emotionally neutral. In our previous study, we determined the emotional content of each video. The results are presented in Figure 2, which shows the average reported emotion induction by a normal population on a scale of 0 to 10 (10).

Figure 2.
Emotional content of video clips (VC)
3.4.2. Personality Test
The NEO-FFI is a 60-item questionnaire designed by Costa and McCrae to measure five major personality traits: Neuroticism (N), extraversion (E), openness to experience (O), agreeableness (A), and conscientiousness (C), using a five-point Likert Scale. In the Farsi version, the Cronbach’s alpha coefficients were 0.71 for neuroticism, 0.82 for extraversion, 0.86 for agreeableness, 0.78 for conscientiousness, and 0.75 for openness, demonstrating strong internal consistency and reliability across its dimensions (28).
3.4.3. Procedure
First, the project was explained to participants, and informed consent was obtained upon their agreement to participate. The NEO-FFI Personality Questionnaire was then administered to determine participants' personality factors. Subsequently, the specified emotional videos were shown to the participants in a soundproof room. The videos were presented in direct (neutral, happy, sad, angry, and fearful) and reverse (neutral, fearful, angry, sad, and happy) orders, randomly selected for each participant. Simultaneously, quantitative electroencephalography (QEEG) was performed with a special cap placed on the participant's head to evaluate their brain waves. This procedure was conducted by experienced technicians in a specialized center, following an ethical protocol and after providing explanations regarding the device and EEG recordings, as well as calming the participants. The recording began with the participant's eyes open, looking at a white wall for four minutes (baseline state), followed by watching the five emotional videos at a distance of 80 to 100 centimeters from a 15-inch LCD monitor. A 5-minute washout period was included between each video to minimize carryover effects on brain waves. To record at the highest level of alertness and mitigate the impact of circadian rhythm, all recordings were conducted between 17:00 and 20:00 hours. To reduce the effect of the menstrual cycle, particularly premenstrual syndrome (PMS) and premenstrual dysphoric disorder (PMDD), on brain wave patterns, the study was conducted on women during the early follicular phase (29). All participants were instructed to abstain from tobacco and caffeine for 24 hours prior to the experiment.
3.4.3.1. Electroencephalography Recording
In this study, we followed the guidelines for the recording and quantitative analysis of electroencephalographic activity in research contexts as provided by Pivik et al. (30). For performing EEG, the Mitsar 201 amplifier and the Electrocap designed for the international 10 - 20 system were used. This device recorded EEG signals from 19 channels through monopolar montage referred to the ear, according to the recommended neuro guide method. The sampling rate of the amplifier was 500 Hz, with a low-pass filter of 1 Hz and a high-pass filter of 30 Hz applied. The electrode impedance was set to 5 kilo-ohms or less. The power supply frequency of 45 - 55 Hz was also filtered out. The spectrum of EEG waves ranged from 1 to 30 Hz for delta (1 - 4 Hz), theta (4 - 8 Hz), alpha (8 - 12 Hz), beta 1 (12 - 15 Hz), beta 2 (15 - 18 Hz), beta 3 (18 - 25 Hz), and high beta (25 - 30 Hz) frequencies. During EEG recording, all wireless electronic devices, Bluetooth, and mobile phones were turned off to prevent interference with the device signal.
3.5. Analysis
The absolute power of brain waves while watching emotional videos was compared to each individual's baseline and served as the basis for statistical analysis. The data will be analyzed using SPSS version 21, employing independent sample t-tests, Pearson correlation tests, MANOVA, MANCOVA, and multiple regression analysis. Analyses will be conducted at a significance level of less than 0.05.
3.6. Blinding
The physician analyzing the EEG data and the specialist in biostatistics were blinded to the participants' personality factors.
4. Results
4.1. Participants Characteristics
The study included 62 participants, with a mean age of 29.4 ± 4.6 years. No statistically significant differences between genders were observed in age, education, and GHQ score. Among the participants, 93.5% of women and 83.8% of men were right-handed. Additionally, it is important to note that all participants were from Mazandaran, a region with a homogeneous cultural background.
4.2. Personality Traits in Males and Females
Table 1 displays the results of the NEO-FFI and compares the personality traits between male and female participants using t-tests. Each trait has a possible range of 0 to 48. The MANOVA test was conducted to compare the personality traits between the two genders. The multivariate test did not show a significant statistical difference between the genders regarding the NEO factors [F (5, 60) = 0.881, P = 0.499]. Additionally, a MANCOVA test was performed to compare the personality traits for the gender variable while controlling for age, and no significant statistical difference was observed regarding the NEO five factors [F (5, 59) = 1.342, P = 0.26].
Table 1.
Results of the NEO-Five-Factor Inventory and Comparison Between Male and Female Participants Using t-Tests
| NEO Personality Traits and Genders | Mean ± SD | P-Value |
|---|---|---|
| Neuroticism | 0.459 | |
| Male | 19.39 ± 5.18 | |
| Female | 20.55 ± 6.14 | |
| Extraversion | 0.079 | |
| Male | 32.55 ± 4.86 | |
| Female | 29.70 ± 6.05 | |
| Openness | 0.621 | |
| Male | 25.64 ± 5.46 | |
| Female | 25.82 ± 5.93 | |
| Agreeableness | 0.421 | |
| Male | 31.18 ± 4.84 | |
| Female | 30.03 ± 5.02 | |
| Conscientiousness | 0.214 | |
| Male | 36.67 ± 4.99 | |
| Female | 35.30 ± 5.89 |
4.3. Correlational Analysis
The strength of the Pearson correlation coefficient was categorized as follows: Very weak (0.00 to 0.20), weak (0.21 to 0.39), moderate (0.40 to 0.59), strong (0.60 to 0.79), and very strong (0.80 to 1) (31). The results of the correlation between the NEO-FFI personality factors and alpha and beta brain activity in the frontal, central, parietal, and occipital regions are as follows.
4.3.1. Neutral Video
In men, neuroticism was directly correlated with the alpha band in the frontal regions (F3, F4), central regions (C3, C4, Cz), and left parietal region (P3). Additionally, neuroticism was directly related to the alpha-2 band in the frontal regions (F3, F4), central regions (C3, C4), and occipital regions (O1). For the alpha-1 band, neuroticism was directly related to the right frontal region (F4), central regions (C3, C4, Cz), left parietal region (P3), and occipital region (O1). These correlations were mainly moderate, especially for the left hemisphere. In women, only openness was directly correlated with the alpha band in the right parietal region (P4), the alpha-2 band in the parietal region (P3, P4, Pz), and the beta-1 band in the frontal region (Fz), with a weak correlation for beta-1 and moderate correlation for the other bands.
4.3.2. Happy Video
In men, neuroticism was directly correlated with the alpha band in the left frontal region (F3) and the alpha-2 band in the frontal (F3, F4), central (Cz), and parietal (P4) regions. Additionally, conscientiousness negatively correlated with the alpha-2 band in the occipital region (O1) and the alpha, alpha-1, and beta-1 bands in the occipital (O1, O2) and parietal (P3, P4) regions. These correlations were mainly at the moderate level. No significant relationship was found in women.
4.3.3. Sad Video
In men, conscientiousness was negatively correlated with the alpha-1 wave in the occipital region (O1, O2), with weak and moderate correlation, respectively. No significant relationship was found in women.
4.3.4. Anger Video
In men, neuroticism was directly and weakly correlated with the alpha-2 wave in the parietal region (Pz). Additionally, extraversion and conscientiousness negatively correlated with the alpha-1 wave in the right occipital region (O2), with a moderate level of correlation. No significant relationship was found in women.
4.3.5. Fearful Video
In men, extraversion was inversely correlated with the alpha-1 wave in the occipital region (O1, O2) at the weak level. Additionally, conscientiousness was inversely correlated with the alpha, alpha-1, and alpha-2 bands in the right occipital region (O2) and the beta-1 band in the occipital region (O1, O2), which were mainly at the moderate level. No significant relationship was found in women.
4.4. Multiple Regression Analysis
Tables 2 to 5 provide a summary of the multiple regression analysis for each gender, frequency band, and brain region. The independent variables are the big five personality factors, and the reported values in each table represent the coefficient of determination (R²) for significant regression models. This analysis was used to investigate the contribution of personality traits to changes in frequency bands at each point in the brain.
Table 2.
Summary of 11 Multiple Regression Models for the Variable of Personality Traits in the "Alpha" Band for Men and Women While Watching Five Video Clips
| Personality Traits | Channel | R2 | Channel | R2 | Channel | R2 | Channel | R2 | ||||
|---|---|---|---|---|---|---|---|---|---|---|---|---|
| Male | Female | Male | Female | Male | Female | Male | Female | |||||
| Neutral | F3 | 24.3% a | NS | C3 | 20.2% b | NS | P3 | NS | NS | O1 | NS | NS |
| F4 | 20.3% b | NS | C4 | NS | NS | P4 | NS | NS | O2 | NS | NS | |
| Fz | NS | NS | Cz | NS | NS | Pz | NS | NS | - | |||
| Happy | F3 | NS | NS | C3 | NS | NS | P3 | NS | NS | O1 | NS | NS |
| F4 | NS | NS | C4 | NS | NS | P4 | NS | NS | O2 | NS | NS | |
| Fz | NS | NS | Cz | NS | NS | Pz | NS | NS | - | |||
| Sad | F3 | NS | NS | C3 | NS | NS | P3 | NS | NS | O1 | NS | NS |
| F4 | NS | NS | C4 | NS | NS | P4 | NS | NS | O2 | NS | NS | |
| Fz | NS | NS | Cz | NS | NS | Pz | NS | NS | - | |||
| Anger | F3 | 19.6% b | NS | C3 | NS | NS | P3 | NS | NS | O1 | NS | NS |
| F4 | NS | NS | C4 | NS | NS | P4 | NS | NS | O2 | NS | NS | |
| Fz | NS | NS | Cz | NS | NS | Pz | NS | NS | - | |||
| Fearful | F3 | NS | NS | C3 | NS | NS | P3 | NS | NS | O1 | NS | NS |
| F4 | NS | NS | C4 | NS | NS | P4 | NS | NS | O2 | NS | NS | |
| Fz | NS | NS | Cz | NS | NS | Pz | NS | NS | - | |||
Abbreviation: NS, non-significant.
a Significant at 0.05 level.
b Significant at 0.01 level.
Table 3.
Summary of 11 Multiple Regression Models for the Variable of Personality Traits in the "Alpha1" Band for Men and Women While Watching Five Video Clips
| Personality Traits | Channel | R2 | Channel | R2 | Channel | R2 | Channel | R2 | ||||
|---|---|---|---|---|---|---|---|---|---|---|---|---|
| Male | Female | Male | Female | Male | Female | Male | Female | |||||
| Neutral | F3 | 23.0% a | NS | C3 | NS | NS | P3 | NS | NS | O1 | NS | NS |
| F4 | NS | NS | C4 | NS | NS | P4 | NS | NS | O2 | NS | NS | |
| Fz | NS | NS | Cz | NS | NS | Pz | NS | 19.9% b | - | - | - | |
| Happy | F3 | NS | NS | C3 | NS | NS | P3 | NS | NS | O1 | NS | NS |
| F4 | NS | NS | C4 | NS | NS | P4 | NS | NS | O2 | NS | NS | |
| Fz | NS | NS | Cz | NS | NS | Pz | NS | NS | - | - | - | |
| Sad | F3 | NS | NS | C3 | NS | NS | P3 | NS | NS | O1 | NS | NS |
| F4 | NS | NS | C4 | NS | NS | P4 | NS | NS | O2 | NS | NS | |
| Fz | NS | NS | Cz | NS | NS | Pz | NS | NS | - | - | - | |
| Anger | F3 | 18.1% b | NS | C3 | NS | NS | P3 | NS | NS | O1 | NS | NS |
| F4 | NS | NS | C4 | NS | NS | P4 | NS | NS | O2 | NS | NS | |
| Fz | NS | NS | Cz | NS | NS | Pz | NS | NS | - | - | - | |
| Fearful | F3 | 17.2% b | NS | C3 | NS | NS | P3 | NS | NS | O1 | NS | NS |
| F4 | 17.7% b | NS | C4 | NS | NS | P4 | NS | NS | O2 | NS | NS | |
| Fz | 17.7% b | NS | Cz | NS | NS | Pz | NS | NS | - | - | - | |
Abbreviation: NS, non-significant.
a Significant at 0.05 level.
b Significant at 0.01 level.
Table 4.
Summary of 11 Multiple Regression Models for the Variable of Personality Traits in the "Alpha2" Band for Men and Women While Watching Five Video Clips
| Personality Traits | Channel | R2 | Channel | R2 | Channel | R2 | Channel | R2 | ||||
|---|---|---|---|---|---|---|---|---|---|---|---|---|
| Male | Female | Male | Female | Male | Female | Male | Female | |||||
| Neutral | F3 | 25.0% a | NS | C3 | NS | NS | P3 | 17.6% a | NS | O1 | NS | NS |
| F4 | 22.9% a | NS | C4 | NS | NS | P4 | 23.2% a | NS | O2 | 21.4% b | NS | |
| Fz | 15.5% b | NS | Cz | 17.0% | NS | Pz | 20.6% a | NS | - | - | - | |
| Happy | F3 | NS | NS | C3 | NS | NS | P3 | NS | NS | O1 | NS | NS |
| F4 | NS | NS | C4 | NS | NS | P4 | NS | NS | O2 | NS | NS | |
| Fz | NS | NS | Cz | NS | NS | Pz | NS | NS | - | - | - | |
| Sad | F3 | NS | NS | C3 | NS | NS | P3 | NS | NS | O1 | NS | NS |
| F4 | NS | NS | C4 | NS | NS | P4 | NS | NS | O2 | NS | NS | |
| Fz | NS | NS | Cz | NS | NS | Pz | NS | NS | - | - | - | |
| Anger | F3 | 20.4% b | NS | C3 | NS | NS | P3 | NS | NS | O1 | NS | NS |
| F4 | NS | NS | C4 | NS | NS | P4 | NS | NS | O2 | NS | NS | |
| Fz | NS | NS | Cz | NS | NS | Pz | NS | NS | - | - | - | |
| Fearful | F3 | NS | NS | C3 | NS | NS | P3 | NS | NS | O1 | NS | NS |
| F4 | NS | NS | C4 | NS | NS | P4 | NS | NS | O2 | NS | NS | |
| Fz | NS | NS | Cz | NS | NS | Pz | NS | NS | - | - | - | |
Abbreviation: NS, non-significant.
a Significant at 0.05 level.
b Significant at 0.01 level.
Table 5.
Summary of 11 Multiple Regression Models for the Variable of Personality Traits in the "Theta" Band for Men and Women While Watching Five Video Clips
| Personality Traits | Channel | R2 | Channel | R2 | Channel | R2 | Channel | R2 | ||||
|---|---|---|---|---|---|---|---|---|---|---|---|---|
| Male | Female | Male | Female | Male | Female | Male | Female | |||||
| Neutral | F3 | NS | NS | C3 | NS | NS | P3 | NS | NS | O1 | NS | NS |
| F4 | NS | NS | C4 | NS | NS | P4 | NS | NS | O2 | NS | NS | |
| Fz | NS | NS | Cz | NS | NS | Pz | NS | NS | - | - | - | |
| Happy | F3 | NS | NS | C3 | NS | NS | P3 | NS | NS | O1 | NS | NS |
| F4 | NS | NS | C4 | NS | NS | P4 | NS | NS | O2 | NS | NS | |
| Fz | NS | NS | Cz | NS | NS | Pz | NS | NS | - | - | - | |
| Sad | F3 | NS | NS | C3 | NS | NS | P3 | NS | NS | O1 | NS | NS |
| F4 | NS | NS | C4 | NS | NS | P4 | NS | NS | O2 | NS | NS | |
| Fz | NS | NS | Cz | NS | NS | Pz | NS | NS | - | - | - | |
| Anger | F3 | 19.8% a | NS | C3 | NS | NS | P3 | NS | NS | O1 | NS | NS |
| F4 | NS | NS | C4 | 15.7% a | NS | P4 | 16.1% a | NS | O2 | 19.7% a | NS | |
| Fz | NS | NS | Cz | NS | NS | Pz | NS | NS | - | - | - | |
| Fearful | F3 | 24.6% b | NS | C3 | 16.6% a | NS | P3 | 20.4% a | NS | O1 | 15.7% a | NS |
| F4 | 23.8% b | NS | C4 | 22.6% b | NS | P4 | 21.3% b | NS | O2 | 25.4% b | NS | |
| Fz | 29.1% b | NS | Cz | 22.2% b | NS | Pz | NS | NS | - | - | - | |
Abbreviation: NS, non-significant.
a Significant at 0.01 level.
b Significant at 0.05 level.
The results for the "Beta 1" band were insignificant in both genders. To determine the personality trait with the most substantial effect, regression models were employed to quantify the relative influence of each trait. The coefficients of regression models were reported for each video based on the maximum value of significant regression models. For example, in Table 2 (alpha band) for the neutral video in the F3 region of men, a regression model at the 5% level was significant. Thus, the regression model coefficients were reported in Table 6 to examine the maximum effect among the five personality traits in this region. In Table 3 (alpha-1), coefficients were reported for the neutral video in the F3 region for men (Table 7). Table 4 (alpha-2) reported regression coefficients for the neutral video in the F3 region for men (Table 8). Finally, for Table 5 (theta), the coefficients for the fearful video and the Fz region of men are presented in Table 9. No regression model was reported for the Beta wave, as no significant regression was found.
In Tables 6 to 9, Spc represents semi-partial correlation, and Spc2 is its square. The percentage of Spc2 indicates the contribution of each personality component to the variance of the targeted wave after removing the effects of other personality components. For example, in Table 6, the contribution of neuroticism is 24.506% in the variation of alpha band frequency after removing the effects of the other four personality factors, which is the highest among other factors. Therefore, neuroticism has the most significant impact on the changes and values of the alpha band in the neutral emotion and F3 region, followed by extraversion and agreeableness. Similarly, in Table 7, neuroticism, extraversion, and agreeableness have the highest contributions to the changes of the alpha-1 wave in the neutral emotion and F3 region, with percentages of 22.250, 19.755, and 17.928, respectively. This trend is also observed in Table 8, where neuroticism has the highest contribution to the changes of the alpha-2 band in the neutral emotion and F4 region with a percentage of 25.092. In Table 9, extraversion has the highest contribution to the changes of the theta wave during the fearful video, with a share of 27.329%, followed by agreeableness and neuroticism.
Table 6.
Regression Coefficients of the "Alpha" Wave for Five Personality Factors in the Neutral Video for Men in the F3 Region
| Independent Items | Unstandardized Coefficients | Standardized Coefficients | t-Test | P-Value | Correlations | ||
|---|---|---|---|---|---|---|---|
| B | SE | Beta | Spc | Spc2% | |||
| Neuroticism | 0.695 | 0.244 | 1.219 | 2.849 | 0.009 a | 0.495 | 24.506 |
| Extraversion | -0.865 | 0.343 | -2.522 | -2.519 | 0.019 a | -0.450 | 20.245 |
| Openness | -0.051 | 0.355 | -0.117 | -0.145 | 0.886 | -0.029 | 0.084 |
| Agreeableness | 0.822 | 0.352 | 2.290 | 2.337 | 0.028 a | 0.423 | 17.928 |
| Conscientiousness | -0.089 | 0.352 | -0.291 | -0.253 | 0.803 | -0.050 | 0.255 |
a Significant at 0.05 level.
Table 7.
Regression Coefficients of the "Alpha1" Wave for Five Personality Factors in the Neutral Video for Men in the F3 Region
| Independent Items | Unstandardized Coefficients | Standardized Coefficients | t-Test | P-Value | Correlations | ||
|---|---|---|---|---|---|---|---|
| B | SE | Beta | Spc | Spc2% | |||
| Neuroticism | 0.335 | 0.124 | 1.206 | 2.696 | 0.012 a | 0.475 | 22.520 |
| Extraversion | -0.433 | 0.175 | -2.597 | -2.481 | 0.020 a | -0.444 | 19.755 |
| Openness | 0.015 | 0.180 | 0.070 | 0.084 | 0.934 | 0.017 | 0.028 |
| Agreeableness | 0.408 | 0.179 | 2.334 | 2.279 | 0.031 a | 0.415 | 17.202 |
| Conscientiousness | -0.072 | 0.179 | -0.487 | -0.404 | 0.689 | -0.081 | 0.650 |
a Significant at 0.05 level.
Table 8.
Regression Coefficients of the "Alpha2" Wave for Five Personality Factors in the Neutral Video for Men in the F3 Region
| Independent Items | Unstandardized Coefficients | Standardized Coefficients | t-Test | P-Value | Correlations | ||
|---|---|---|---|---|---|---|---|
| B | SE | Beta | Spc | Spc2% | |||
| Neuroticism | 0.345 | 0.117 | 1.230 | 2.951 | 0.007 a | 0.501 | 25.092 |
| Extraversion | -0.397 | 0.165 | -2.334 | -2.404 | 0.024 a | -0.426 | 18.184 |
| Openness | -0.082 | 0.163 | -0.374 | -0.505 | 0.618 | -0.099 | 0.973 |
| Agreeableness | 0.396 | 0.168 | 2.220 | 2.358 | 0.026 a | 0.420 | 17.623 |
| Conscientiousness | -0.019 | 0.156 | -0.125 | -0.120 | 0.905 | -0.024 | 0.056 |
a Significant at 0.05 level.
Table 9.
Regression Coefficients of the "Theta" Waves for Five Personality Factors in the Fearful Video for Men in the F3 Region
| Independent Items | Unstandardized Coefficients | Standardized Coefficients | t-Test | P-Value a | Correlations | ||
|---|---|---|---|---|---|---|---|
| B | SE | Beta | Spc | Spc2% | |||
| Neuroticism | 0.543 | 0.299 | 0.814 | 1.815 | 0.081 | 0.335 | 11.247 |
| Extraversion | -1.321 | 0.422 | -3.267 | -3.127 | 0.004 | -0.523 | 27.329 |
| Openness | 0.744 | 0.416 | 1.424 | 1.790 | 0.085 | 0.331 | 10.975 |
| Agreeableness | 0.873 | 0.430 | 2.058 | 2.032 | 0.053 | 0.370 | 13.699 |
| Conscientiousness | -0.206 | 0.400 | -0.577 | -0.516 | 0.610 | -0.101 | 1.013 |
a Significant at 0.05 level.
The analysis of the alpha band of the cortex in men while watching a neutral video revealed that personality factors accounted for approximately 24% of the changes in the frontal region (Table 2). Among these factors, neuroticism had the greatest impact, explaining 24% of the observed changes, followed by extraversion and agreeableness, which accounted for 20% and 18%, respectively (Table 6). Similarly, when examining the alpha-1 band of the cortex in men during the neutral video, personality factors were found to be responsible for 23% of the changes in the left frontal region (F3) (Table 3). The influence of each personality factor mirrored that observed in the total alpha band analysis (Table 7). In the analysis of the alpha-2 band of the cortex in men while watching the neutral video, personality factors accounted for approximately 25% of the changes in the frontal region (F3, F4), and up to 23% of the changes in the parietal region (P3, P4, Pz) (Table 4). Once again, the impact of each personality factor resembled that observed in the total alpha band analysis (Table 8). Shifting focus to the theta band of the cortex in men during fear emotion stimulation, personality factors were found to be responsible for changes in up to 29.1% of the brain cortex, with a greater effect observed in the right hemisphere (Table 5). Among the personality factors, extraversion emerged as the most influential trait, demonstrating a substantial impact of 27.3% (Table 9). These findings are summarized in Figure 3.

Figure 3.
Partial correlation coefficients (the proportion of variance changes) of affected bands for each personality factor
The analysis of the dominant hand revealed no statistically significant differences in any of the observed results (data not shown).
5. Discussion
This study demonstrates that personality traits significantly influence brain activity in response to emotional stimuli, particularly in men. The strongest effects were observed in the theta band of the frontal cortex (Fz) during fearful stimuli, where extraversion explained up to 29% of the variance. Additionally, correlations were predominantly moderate, with neuroticism and extraversion emerging as the most impactful traits across different scenarios.
5.1. Demographic Information
In this study, 62 adults participated, including 31 men and 31 women. They did not differ significantly in factors such as education and GHQ score. The age range of the participants was 20 to 40 years, with a mean of about 29 years, similar to the studies of Kajonious, Kortelainen, and Ku (10, 32). Unlike some previous studies (10, 20), in the present study, as in the study of Jach et al. (12), there was no limitation in terms of the dominant hand of the participants. After random sampling, 90% of the participants were right-handed, slightly higher in women than men, which is consistent with the prevalence of right-handedness in societies (33). The potential confounding factors of the dominant hand were carefully analyzed; however, the results did not reveal any statistically significant differences associated with this factor. In Kuper et al.’s study on the relationship between personality factors and EEG, the dominant hand did not affect the results either (34).
5.2. Gender Differences in Personality Factors
Costa et al. (35) comprehensively examined gender differences in personality factors, finding that the variation between genders is relatively small compared to the diversity observed within individuals of the same gender. Importantly, they also discovered that the magnitude of gender differences varied across cultures. Several studies have consistently demonstrated higher levels of neuroticism in women (36-38), although it is worth noting that this association has been found to be age-dependent (37, 39). In the context of the present study, no significant differences in personality factors were observed between genders. Moreover, multivariate analyses that controlled for age and gender also failed to detect any significant disparities. These findings suggest that cultural factors may play a crucial role in accounting for the discrepancies observed across studies.
5.3. The Effect of Emotional Stimuli on Brain Waves Considering Personality Factors
The relationship between personality traits measured by the NEO-FFI and cortical activity during emotional stimulation was initially determined through correlational analysis. The results mainly showed moderate correlations between four personality traits of NEO-FFI (except for agreeableness) and regional brain activity. Although there were no significant differences in personality factors between genders in this study, the brain responses following emotional stimulation significantly differed between men and women. Women showed less consistent patterns for changes in alpha and beta brain waves compared to men. There were only direct and significant correlations between the openness personality factor and prefrontal alpha and frontal beta-1 bands. These findings contradict the claims of Suhaimi et al. (2), which suggested that women had more consistent responses to emotional stimuli than men. The findings of Tran et al. (36) were consistent with the present study. They explored the relationship between personality factors and brain waves during the resting state and found no significant relationship between women's personality factors and alpha and beta brain waves, while multiple relationships were observed for men across various points and bands. This discrepancy in brain responses to emotional stimuli between genders suggests fundamental differences in how emotions are processed in different genders.
Previous studies evaluated the relationship between personality factors and brain function during the resting state (without using emotional stimuli), which found limited and weak correlations (36, 40). Kuper et al. (34) conducted a comprehensive analysis of 79 studies involving 5700 individuals. Their findings indicated that the validity of frontal cortex waves during the resting state as an indicator for personality factors is very weak, with less than 0.4% of the variance in extraversion and neuroticism being explained by frontal asymmetry during the resting state. Tran attributed the same weak relationship (up to 15% correlation) to factors such as skull thickness, vigilance level, artifact, and age (36). In the present study, stronger and more correlations were found between personality and brain waves, with correlations reaching up to 45%, thanks to audiovisual emotional stimuli. For example, individuals with higher conscientiousness exhibited lower beta-1 activity while watching fearful and happy videos. Given that the beta range is directly related to anxiety and focuses on the content of the video (9), this inverse relationship suggests that individuals with higher conscientiousness have less focus on the negative and positive aspects of emotions, enabling them to allocate more attention to their tasks. However, this relationship was not found in other studies due to the absence of emotional stimuli.
By introducing audiovisual emotional stimuli, our study provides a more comprehensive understanding of the relationship between personality and brain function. The use of emotional stimuli enhances the sensitivity and specificity of the measurements, allowing for a more robust examination of how specific personality traits relate to neural activity. These findings highlight the importance of considering emotional context when studying the interplay between personality and brain function, as it can significantly influence the observed correlations.
5.4. Brain Regions and Personality Factors
Personality-related brain wave changes are most prominent in response to neutral and fearful videos. In the case of neutral videos, the most significant alterations occur in the frontal lobe, specifically at the F3 point. Notably, neuroticism exhibits the strongest association with changes in the alpha band and its fractions, followed by extraversion and agreeableness. During exposure to fearful videos, extraversion plays the most influential role among the big five personality traits. Notably, theta band changes at the Fz point are particularly prominent. Agreeableness and neuroticism rank second and third, respectively, in terms of their impact on brain wave changes. These findings align with previous research (22), which also highlights the significance of neuroticism and extraversion in processing emotional stimuli. No directly comparable studies have been found that statistically compare the role of each personality factor in brain responses to emotional stimuli. While some studies have utilized machine learning techniques for EEG-based emotion recognition, their results cannot be directly compared to our study (22, 41). Moreover, a single study has explored the relationship between personality factors and brain wave power, but it focused solely on brain waves during staring at a white blank wall.
To engage participants in more complex processing tasks than simply staring at a blank wall, we included a neutral video without emotional content in our study. Multiple regression analysis revealed that personality factors played a more substantial role in brain responses to both neutral and emotional stimulus videos compared to the findings reported by Tran et al. (36). It is worth noting that other studies have also observed the effects of neutral VC on brain waves, probably due to non-emotional processing and the brain's effort to search for emotional aspects in a clip that lacks emotional content (22, 41).
The findings primarily apply to young adults from a homogeneous cultural background in Iran, limiting generalizability to other age groups, cultures, or clinical populations. Additionally, variations in EEG methodologies and personality assessments may affect the reproducibility of the results in different settings.
5.5. Conclusions
By introducing audiovisual emotional stimuli, our study provides a more comprehensive understanding of the relationship between personality and brain function. Our findings highlight the importance of considering emotional context when studying the interplay between personality and brain function, as it can significantly influence the observed correlations. The changes in brain waves following the observation of emotional videos in men have a consistent pattern with their personality traits. However, in women, despite some correlation, such a pattern was not found. Additionally, the alpha band at the F3 point shows the most emotional response related to personality factors.
5.6. Recommendations
This study included four primary emotions, each stimulated by a video. For future research, it is recommended to expand the range of emotions studied, including both primary and secondary emotions, and to use multiple videos to represent each emotion more comprehensively. Additionally, conducting mediation and moderator analyses is advised to determine whether personality factors act as mediating or moderating variables in the relationships between emotions and various outcomes. Separate sampling for dominant hand groups is also suggested in studies investigating the effects of handedness, as it would provide a more nuanced understanding of its influence, enabling a more precise examination of potential differences and interactions within the study variables. Combining these approaches would enhance the depth and rigor of future research. Based on our study, it is recommended to prioritize using the F3 point in future research on the relationship between personality and emotion, as this can save costs and time.
5.7. Limitations
The limitations of this study include not using and analyzing waves in the temporal regions due to high temporalis muscle artifacts and not using other frequency bands such as delta, high beta, and gamma.