Introduction
Zearalenone (ZEA) is an estrogenic compound produced by Fusarium spp. such as F. graminearum and F. culmorum (1). It is associated with reproductive problems in specific animals and possibly in humans (2). ZEA may affect the uterus by decreasing progesterone secretion and altering the morphology of uterine tissues (3). It is classified by the international agency for research on cancer under group 3 carcinogens (4).
ZEN is found worldwide in a number of cereal crops, such as maize, barley, wheat, rice (5, 6), and bread (7). It is generally stable during cooking, except under alkaline conditions or during extrusion (8). Because of ZEA potential health hazards to humans, many countries have recently been documented regulatory levels for ZEA in the range of 20 to 1000 ng/g in foods (9). Iran has made the regulatory limits 200 ng/g for wheat, rice, and maize and 400 ng/g for barley (10). The Joint FAO/WHO Expert Committee on Food Additives (JECFA) established a provisional maximum tolerable daily intake (PMTDI) of 0.5 μg/kg body weight (11).
Mycotoxin contaminations of foodstuffs and feedstuffs have been studied in Iran (12-16). There are little data on the natural occurrence of ZEA in cereals and cereal products in Iran. ZEA was found in wheat (17), maize (18), corn flour (19), corn cheese snack (19), barley, corn, silage and wheat bran (20). The aims of this study were determination of ZEA in different food samples collected from Tehran retail markets and to estimation of ZEA intake by the Tehran population.
Experimental
All reagents were of analytical grade. Solvents used for the experiments were of either HPLC or analytical grade. The standard of ZEA was purchased from Sigma-Aldrich. The IAC EASI-EXTRACT® ZEARALENONE immunoaffinity column for ZEA was purchased from R-Biopharm Company, UK. The chromatographic apparatus consisted of a model Wellchrom K-1001 pump, a model Rheodyne 7125 injector and a model RF10AXL fluorescence detector connected to a model Eurochrom 2000 integrator, all from Knauer (Berlin, Germany). The separation was performed on Chromolith Performance (RP-18e, 100 × 4.6 mm) column from Merck (Darmstadt, Germany).
Sampling and sample preparation
Samples (rice, bread, wheat flour and puffed corn snack) were collected from various sales outlets in nine geographic zones in Tehran, Iran, according to the sampling plan for official control of mycotoxins in food (21). All samples were finely grounded by mill and subsamples stored in freezer at -32ºc until analysis.
Preparation of ZEA standard
Stock, intermediate and working standard solutions of ZEA were prepared in acetonitrile. After preparation of standard solution of ZEA (10 μg/mL), the concentration was determined using UV spectrophotometer in 274 nm. This standard was used to prepare spiking solutions and working standards of ZEA for HPLC analysis.
Method
The method used for ZEA extraction from samples and the chromatographic conditions were based on the European Standard, CEN/TC 275 with some modifications (22). Twenty grams of samples including rice, bread, and wheat flour samples were extracted for 1 h with acetonitrile 90% (100 mL). Puffed corn snack samples (20 g) were extracted with 100 mL acetonitrile 84% for 1 h. After filtering, 15 mL of the filtrate was diluted with 85 phosphate buffer saline (PBS) and filtered through a glass microfiber filter. After conditioning the column with 20 mL PBS, 50 mL diluted and filtered extracted was passed through immunoaffinity column at a flow rate of about 2-3 mL/min. Finally, the column was rinsed with 20 mL deionized water at the same flow rate and dried with a gentle vacuum. For ZEA elution from the column, a portion of 1.5 mL HPLC grade acetonitrile was passed through the column and then diluted with 3 mL deionized water. Finally, 100 μL of the final solution was injected into HPLC.
For all samples, separation was performed on a monolithic column (100 × 4.6 mm) using a HPLC system equipped with a fluorescence detector. Mobile phase was acetonitrile-water (55:45) with a flow rate of 1.5 mL/min. The fluorescence detector was operated at excitation wavelength of 275 nm and emission wavelength of 450 nm.
Method validation
To evaluate the reliability of the results, in addition to apply regular validation assessment to the developed method, internal quality control experiments were also performed. Recovery experiments were performed for determination of accuracy and precision of the method using blank rice, bread, puffed corn snack and wheat flour samples spiked at three ZEA levels (100, 200, 400 ng/g). In each working day, a blank and a spiked sample were also analyzed. According to the recovery values, ZEA levels were corrected for recoveries. In addition, a certified reference material (CRM) from FAPAS (UK) was also analyzed.
Result and Discussion
Method validation
The method was validated in terms of linearity, limit of detection (LOD, limit of quantification (LOQ), selectivity, precision and accuracy. The method was satisfactory in terms of selectivity as an IAC was applied for purification of ZEA which eliminated false positive results caused by interfering materials. Typical chromatograms obtained for ZEA are shown in Figure 1. The retention time of ZEA was very short (2.6 min).
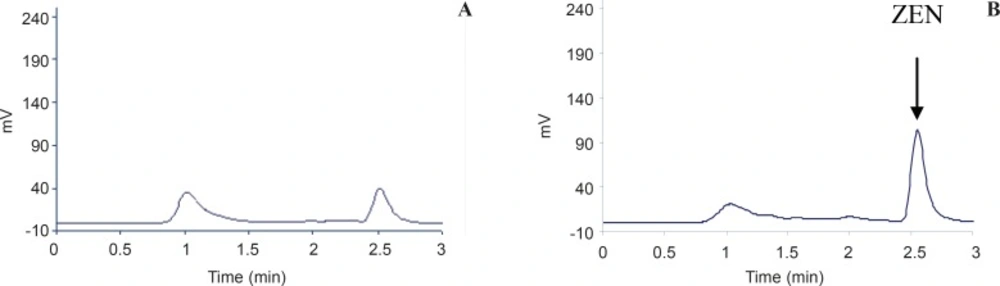
Figure1
HPLC chromatograms of a: ZEA in corn CRM (313 ng/g) and b: ZEN standard (100 ng/mL).
Calibration curves were constructed using seven standards at the range of 14-1100 ng/g for puffed corn snack and 15 to 1200 ng/g for the other samples, with r2>0.997. Recovery experiments were performed for determination of accuracy and precision of the method using blank rice, bread, puffed corn snack and wheat flour samples spiked at three ZEA levels (100, 200, 400 ng/g). Results of the mean recovery and coefficient of variation (triplicate measurements) on all foods are shown in Table 1.
Table 1
Accuracy and precision of zearalenone analytical method in different foods (n = 3).
| Sample | Spiking level (ng/g) | Recovery (%) | RSDr (%) |
|---|---|---|---|
| Rice | 100 | 93.4 | 17.8 |
| 200 | 95.6 | 14.5 | |
| 400 | 106.1 | 9.1 | |
| Mean recovery ± SD | 98.4 ± 6.8 | 13.8 | |
| Bread | 100 | 97.8 | 8.1 |
| 200 | 116 | 6.1 | |
| 400 | 107.5 | 5.8 | |
| Mean recovery ± SD | 107.1 ± 9.1 | 6.7 | |
| Puffed corn snack | 100 | 104 | 7.6 |
| 200 | 106.8 | 4.7 | |
| 400 | 109 | 2.4 | |
| Mean recovery ± SD | 106.6 ± 2.5 | 4.9 | |
| Wheat flour | 100 | 95 | 12.1 |
| 200 | 96.3 | 5.3 | |
| 400 | 87 | 8.6 | |
| Mean recovery ± SD | 92.8 ± 5.0 | 8.7 |
The mean recovery and coefficient of variation in different foods ranged 92.7-107.1% and 4.9-13.8%, respectively (Table 1). These values fall well within EU method performance criteria for ZEA analysis (21). The concentration of ZEA in corn CRM was 379.4 ng/g, which was in the acceptable range of FAPAS Scheme (170-385 ng/g), confirming the accuracy of the analytical method. LOQ, signal-to-noise ratio (s/n) of 9:1 and LOD s/n 3:1 in rice, bread and wheat flour samples were 3 ng/g and 1 ng/g, respectively. For puffed corn snack, LOQ and LOD were 2.7 ng/g and 0.9 ng/g, respectively.
Occurrence of ZEA in various foods
This is the first study on the occurrence of ZEA in rice and bread in Iran. No ZEA contamination was observed in any of these samples (Table 2).
Table 2
Natural occurrence of ZEA in rice, bread, puffed corn snack and wheat flour samples marketed in Tehran, Iran
| Samples | Numbers of samples in the range (ng/g) | ||
|---|---|---|---|
| < LOQa, b | 3-200 | ≥ 200 | |
| Rice | 18 | - | - |
| Bread | 18 | - | - |
| Wheat flour | 18 | - | - |
| Puffed corn snackc | 18 | - | - |
There is little data on ZEA contamination in wheat in Iran. Karimi-Osboo reported that 15 out of 175 wheat samples (8.6%) from Golestan Province were positive for ZEA at a mean level of 72 ng/g. The range of contamination was 39-104 ng/g (17). In our study, the level of ZEA in all wheat flour samples was lower than ZEA MTL in Iran (Table 2) and was in agreement with Rashedi’s report in which no ZEA was detected in 14 wheat bran samples (20).
There is little data on ZEA contamination in corn in Iran. Hadiani et al. analysed forty preharvested maize samples from the Mazandaran province, and found 3 of 40 (7.5%) samples contained ZEA in the range 100 –212 ng/g with a mean of 141 ng/g (18). Oveisi determined ZEA in 38 corn flour and cheese snack samples. The mean of contamination was 377 ng/g and 832 ng/g in corn flour and cheese snack samples, respectively (19). Rashedi reported that 25% of corn samples were contaminated to ZEA (20). Nuryono et al.(2005) determined ZEA in Indonesian maize-based food and feed samples. Twenty-five out of 89 samples were contaminated in a range from 6.9 to 589 ng /g (23). In Spain, the incidence of ZEA in 25 corn-based food samples was 44 % and the level ranged from 34-216 ng/g (24). In our survey, ZEA was not found in any of puffed corn snack samples (Table 2).
Estimation of dietary intake of ZEA
This is the first study on exposure assessment of Tehran population to ZEA. Exposure to mycotoxins for each type of food depends on the mycotoxins concentration in food and the amount of food consumed. In this study, the consumption rates of rice and bread were based on a consumption survey performed in Iran since 2001-2003 (25). Average consumptions of rice and bread are 107 g and 286 g per day per person, respectively. Average consumption of wheat flour is 416 g per day per person (26). There is no data of puffed corn snack consumption in Iran so we assumed a package (65 g) per day as mean daily consumption. As all samples had ZEA contamination below LOQ, the ZEN level of non-contaminated samples were replaced by half the LOQ. The average body weight for adults was assumed 70 kg. In our study, estimated daily intakes of ZEA from rice, bread, wheat flour and puffed corn snack consumption was 0.002, 0.006, 0.003 and 0.001 μg/kg bw/day, respectively (Table 3).
Table 3
Estimated daily intake of ZEA (μg/kg bw/day) from rice, bread, wheat flour and puffed corn snack consumption in Tehran population, Iran
| Samples | Mean a(ng/g) | Daily intake (μg/kg bw/day)b |
|---|---|---|
| Rice | 1.50 | 0.002 |
| Bread | 1.50 | 0.006 |
| Wheat flour | 1.50 | 0.003 |
| Puffed corn snackc | 1.35 | 0.001 |
The total intake of ZEA from all samples consumption was 0.012 μg/kg bw/day and it was much lower than the PMTDI estimated by JECFA (0.5 μg/kg bw/day), indicating there is no health risk for consumers at these levels of contamination. In Taiwan, ZEA was detected in four out of 26 samples ranging from 7.9 to 9.0 ng/g (27). The dietary intakes of ZEA for male and female adults were 0.00297 and 0.00478 μg/kg bw/day, respectively. The ZEA dietary intakes for the Swiss population was estimated to be < 0.02 μg/kg bw/day (28). The mean dietary exposure in French population was estimated at 33 ng/kg bw/day and the 95th percentile dietary exposure at 70 ng/kg bw/day (29). In 2003, the Scientific Cooperation on Questions Relating to Food (SCOOP) estimated the dietary exposure to ZEA in the European population. The mean daily dietary exposure in adult was estimated 4 to 29 ng/kg bw/day (30). Our results were in agreement with abovementioned reports in which estimated daily intakes of ZEA was much lower than the PMTDI estimated by JECFA (0.5 μg/kg bw/day) (Table 3).
Conclusion
Although in this survey, no ZEA contamination was observed in any food samples, considering the high consumption and/or importance of these foods in Iran, more surveys are recommended. In this study which is the first one on exposure assessment of Tehran population to ZEA, no health risk for consumers were detected at these levels of contamination.