1. Background
Indian soldiers are compelled to carry load manually as wilderness of the high altitude terrains construct a critical barrier to the vehicular mode of transportation of load (1). Indian Army deploys more than hundred thousand soldiers in the high altitude border areas. The soldiers have to be well equipped and physically fit to guard the nation’s border. The equipment is generally heavy and is carried in a rough terrain with steep paths (up to 25% gradient) of high altitude. The maximum freedom of mobility gets the ultimate importance in modern warfare scenario; thus, the soldier must be optimally loaded. On the other hand, loads are distributed in waist, back, shoulders, and in the hands for a marching order in Indian Army (2). The composite load in existing load carriage ensembles (LCe) amounts to 21.4 kg consisted of a backpack (BP, 10.7 kg), a haversack (HS, 4.4 kg), and an web (2.1 kg) distributed in the back and waist side of body and INSAS rifle (4.2 kg) in hand (3).
Harman et al. (2000) (4) addressed that load carriage tasks put stress on the musculoskeletal system of the carrier. Carrying a load may increase lower limb loading, which places high stress on the soft tissues surrounding the leg joints (5), predisposing the participant to the risk of injuries as well as stress fractures, and brachial plexus palsy (6-8). Increase in electromyographic (EMG) amplitude is known to have positive correlation with increasing muscular force (9, 10). Increased EMG activity with increase in load has been reported for gastrocnemius, hamstring, and quadriceps muscles (11). Effects of acute, prolonged hypoxia (during simulated ascent) on performance and contractile properties of human skeletal muscle were evaluated by Perry and Rupp (2009) (12). They found that sustained isometric exercise exceeding 30% of maximum voluntary contraction (MVC) which caused substantial and sustained ischemia was not affected by acute hypoxia. Similar observation was cited by Orizio et al. (1993) (13) and Esposito et al. (2003) (14) who recorded EMG activity during isometric contraction and found acute or chronic hypoxia did not affect the maximal force output or fast to slow fibre motor unit (MU) ratio and MU activation pattern. In an experiment including 32-day simulated ascent of Mount Everest (8848 m) (Everest III Comex ‘97), effects of re-oxygenation on muscle function were assessed. The authors found that prolonged exposure to hypoxia slowed the propagation of myopotentials and alters sensorimotor control during sustained effort (15).
Soldiers are frequent visitors to high altitude (HA) areas for their occupational need. As per requirement, they have to carry moderate to heavy loads in these areas. Thus, proper evaluation of skeleto-muscular and physiological system during load carriage task at HA location is very important. A guideline on how to condition military personnel for load carriage tasks in the field locations (i.e. HA) and optimum weight of the equipment at specific height is also lacking in literature. Continuous monitoring of physiological and muscular responses at HA during load carriage task with and without graded walking would be relevant in this context. Hence, a study was designed with Indian Army soldiers to investigate their cardiorespiratory and electromyographic changes during load carriage with varying gradients at two HAs. The study also aimed to develop some guidelines for load carriage at HA with inclination based on relative workload.
2. Methods
2.1. Participants
Eight Indian infantry soldiers with mean (± SD) age of 27.2 (± 3.9) years, height of 171.1 (± 2.5) cm, and weight of 66.8 (± 6.7) kg took part in the study as volunteers. The participating soldiers were selected randomly for the study. The volunteers were low land natives of India and were on the way of their first HA posting. The participants who came under Shape-I category of Indian Army were included in the study. Participants with any prior medical (cardiorespiratory) history or occurrence of musculo-skeletal injuries were excluded from the study. Physical characteristics of the soldiers are presented in Table 1. The volunteers were proscribed from smoking and alcohol consumption throughout the study period. They were allowed to carry out jogging and light exercise in the morning; also, they had been relieved from night duty during the course of experiment.
Table 1.
Physical Characteristics of the Volunteers
| Parameters | Mean ± SD |
|---|---|
| Age, y | 26.2 ± 3.9 |
| Height, cm | 171.1 ± 2.9 |
| Weight, kg | 66.8 ± 6.8 |
| VO2max, mL.min-1.kg-1 | |
| HA1 | 44.9 ± 6.3 |
| HA2 | 37.0 ± 3.9 |
2.2. Ethical Clearance
A clearance from the ethical committee of the author’s institute, which conforms to the recommendations of the declaration of Helsinki (1983), was obtained prior to the study. Thereafter, soldiers were briefed about the purpose and the risk of the experimentation and their informed consent was obtained consequently.
2.3. High Altitude Acclimatization
At HAs, the participants followed the standard acclimatization schedule of Indian Army as per Army order (16). At the first HA location, i.e. Leh (3505 m, HA1), an acclimatization period of initial 6 days of arrival was strictly followed. On 1st and 2nd days: resting, except for short walk; on 3rd and 4th days: walking at slow pace at 1.5 to 3 km.hr-1; and on 5th and 6th days: walking up to 5 km and climbing up to 300 m at a slow pace were allowed. Symptoms of acute mountain sickness were monitored throughout the period by medical staff. At the second HA, (Tangtse 4300 m, HA2) the acclimatization period was reduced to 4 days as per Army order. On 1st and 2nd days: slow walking for a distance at 1.5 to 3 km.hr-1 without any steep climbs; on 3rd day: slow walking and climbing up to 300 m; and on 4th day: climbing 300 m without equipment were allowed. The participants were declared medically fit by a qualified medical doctor with experience in high altitude medicine.
2.4. Load Carriage Experiments
The volunteers were first accustomed with walking on a motorized treadmill (h/p/cosmos treadmill, Cortex Biophyzik Ltd, Leipzig, Germany) with different speeds and gradients. The participants walked on the treadmill for load carriage experiment at HA1 and HA2 with two magnitudes of load i.e. 10.7 kg (L1- Haversack (HS), Web and Rifle), 21.4 kg (L2- Backpack (BP), HS, Web and Rifle), and without load (No load, NL) at two gradients (0 and 10%) for 10 minutes. A 10 minutes duration was selected for the experiment in view of the fact that physiological systems take few minutes to get stabilized during continuous activity of same intensity. This phenomenon has been observed by the authors in their previous studies with similar experimental set up (3, 16, 17). During the experiments, walking speed was fixed at 3.5 km.hr-1 considering the suggestions on optimum speed at HA by previous researchers (i.e. 3 - 3.5 km.hr-1) and keeping in mind the associated difficulties of load carriage under hypoxic conditions (17, 18). Modes, magnitude, and the percentage of body weight and placement of the loads are briefed in Table 2. The load carriage experiments were randomized. The experiments were carried out in the temporary laboratory setup at both the study locations. The volunteers wore vest, shorts, and boot during the load carriage experiments for ease of electrode placement.
Table 2.
Percentage of Body Weight with Magnitude, Different Components, and Placement of Loads
| Mode | Weight | Components | % of Body Weight |
|---|---|---|---|
| Existing load carriage ensemble of Indian Army | 10.7 kg | Haver sack (HS)- in the waist, Web (WB)- in front waist region, Rifle- hand | 16.2 |
| Same as above | 21.4 kg | Back pack (BP)- back, HS, Wb, Rifle | 32.3 |
2.5. Measurement of Maximal Aerobic Capacity
The maximum oxygen consumption (VO2max) was measured during treadmill exercise with regular increase in the gradient while keeping the speed constant (Harbor protocol) (19). During the measurement of VO2max, participants wore vest, underwear, shorts, and physical training shoes. They were allowed to take rest for one hour before the beginning of the experiment. During the experiments, heart rate (HR) and oxygen consumption (VO2) of each individual were recorded by the process of breath-by-breath gas analysis using Meta-max 3B system (MMX 3B, Cortex, Germany). This protocol was performed at two high altitude locations.
2.6. Recording of Physiological and Subjective Data
Participants’ oxygen saturation (SpO2) and HR were monitored by fingertip pulse oximeter (ChoiceMMed Technologies, India) throughout acclimatization period and before and after the completion of each experiment. Physiological parameters such as VO2 and HR were recorded by using MMX 3B breath-by-breath gas analysis system. The relative work load (RWL, %VO2max) was calculated as percentage of VO2max at respective altitudes. The MMX 3B system was thoroughly calibrated for volume with standard 3 Lt volume syringe, standard gas mixture, pressure, and ambient air before start of the experiments. The validity, reliability, and stability of MMX 3B gas analysis system were verified in a combination of tasks similar to the present study (20). Room air temperature and relative humidity (RH) were monitored by a digital thermometer-hygrometer. Necessary information for ambient air pressure (Barometric pressure, Pr) was obtained from Indian air-force station at HA1 and environment monitoring centre at HA2. Changes in atmospheric pressure and relative humidity are presented in Table 3. The same experimental protocol was followed at both the altitudes. After each experiment, the participants rated their perceived exertion on a 14-point rating of perceived exertion (RPE) sheet (Borg’s 6 - 20 scale) (21). The average values of the last 3 minutes of the physiological parameters mentioned above were considered for statistical treatment.
Table 3.
Changes in Temperature, Relative Humidity, Barometric Pressure in Two High Altitudes
| Altitudes | Temperature, °C | RH, % | Pr, mm.Hg |
|---|---|---|---|
| HA1 | 22 - 28 | 18 - 35 | 511 |
| HA2 | 16.5 - 21.5 | 35 - 60 | 441 |
Abbreviations: RH, relative humidity; Pr, pressure.
2.7. Recording of Electromyography
Simultaneous to the physiological data collection, electromyographic recording was carried out throughout the experimentation on three groups of lower limb muscles including left and right Gastrocnemius medialis (GMR and GML), Tibialis anterior (TAR and TAL), and Vastus medialis (VMR and VML) muscles. The muscles of shoulder and back are rigorously used during load carriage with backpack (22). These muscles were not used in the study because the placement of EMG electrodes would require bare body experimentation, which would be difficult in the cold conditions of HA. On the other hand, leg muscles are also extensively used in walking and climbing (23). Hence, these muscles were taken for the study. Delsys Myomonitor (4.0) system along with pre-amplified electrodes (n = 6) and EMGworks 4.0 recording software were used to record electromyographic signals (frequency- 1024 Hz). Active bipolar pre-amplified electrodes (Delsys) were aligned along the fibres of the muscle under investigation according to the recommendations by SENIAM (24). Prior to electrode placement, each site was shaved, cleansed with alcohol, and gently abraded. In order to reduce cable movement artefact, cables were secured using elastic bands (25). EMGworks 4.0 analysis software was used to analyze the recorded data. First, the ‘Raw EMG’ signal plot was created; then, root mean square (RMS) value was computed on analysis software platform; finally, the data were exported to Microsoft Excel format and taken for final analysis. The acquisition, analyses, and representation of EMG data collected from isometric and ballistic contractions by Delsys Myomonitor (4.0) system were found reliable in an earlier study (26). Figures 1 and 2 show physiological and EMG data collection during load carriage task at HA1 with L2 at 0 and 10% gradients.
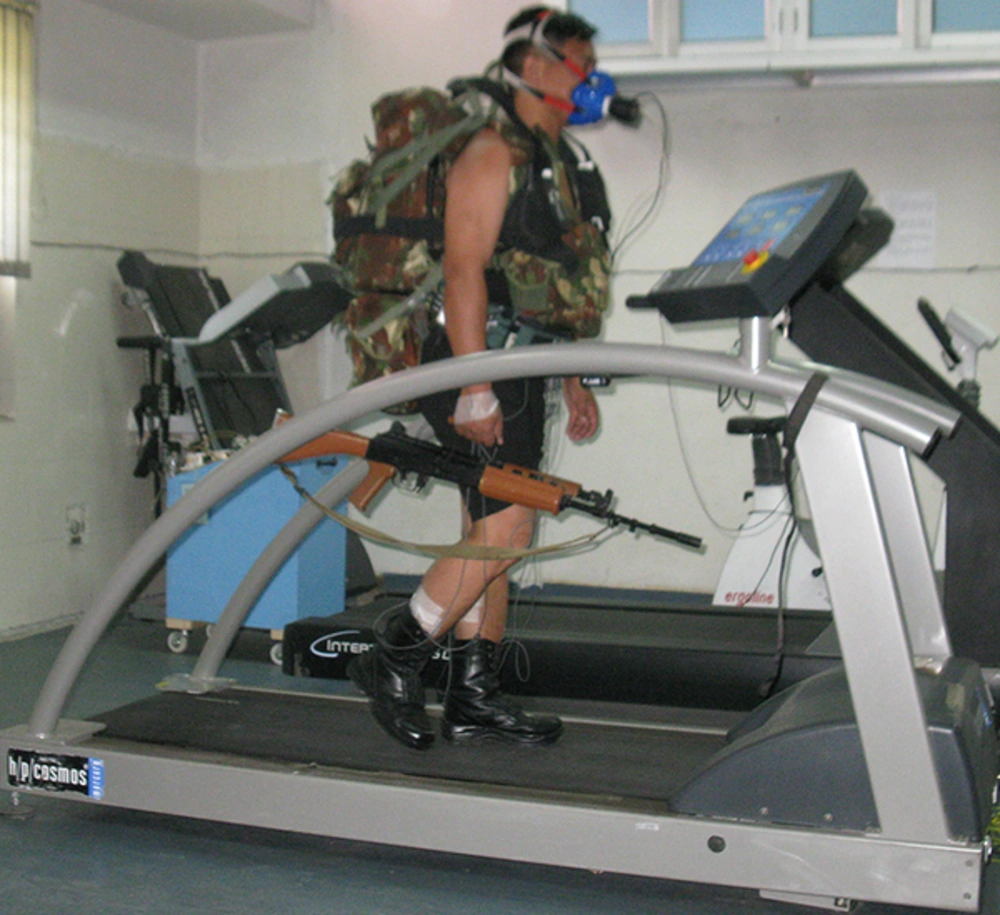
Figure 1.
Physiological and EMG Data Collection During Load Carriage Task at 0% at HA1
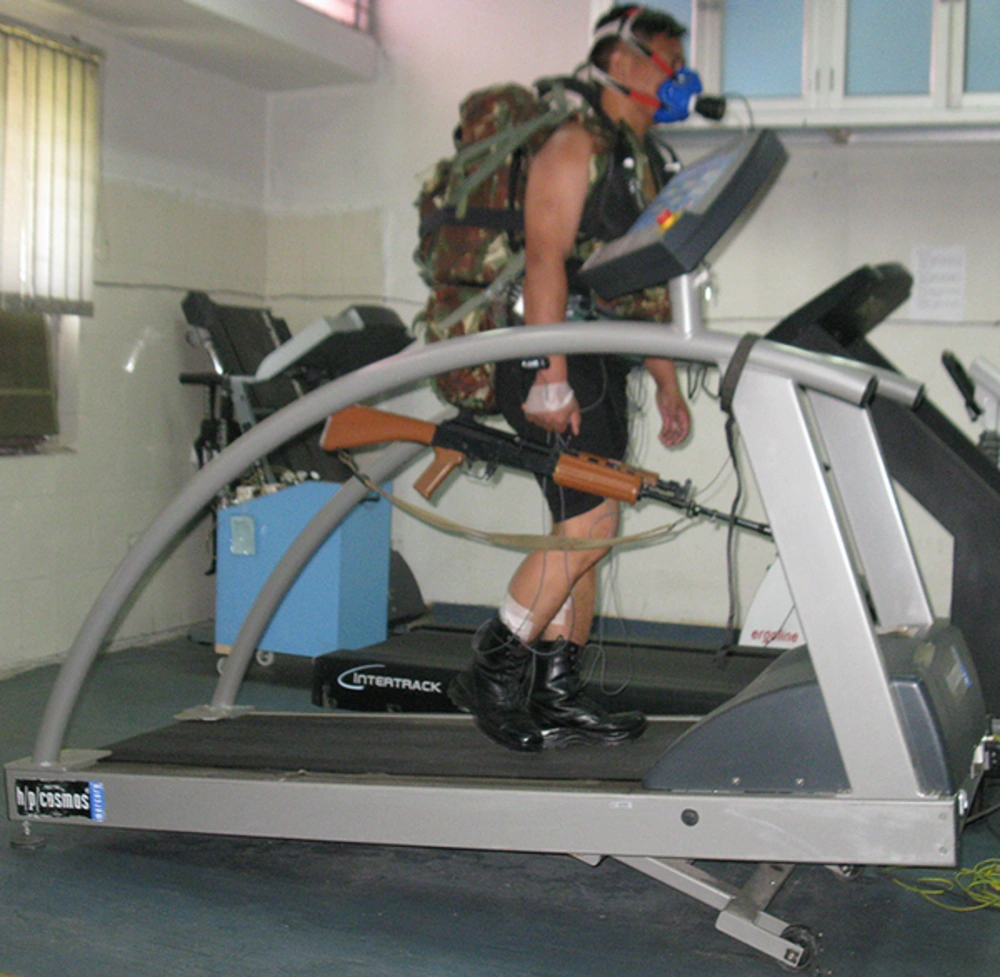
Figure 2.
Physiological and EMG Data Collection During Load Carriage Task at 10% at HA1
2.8. Normalization
Normalization of the RMS values was performed by calculating the percentage of RMS data obtained by doing maximum voluntary contraction (MVC) of the same muscle (27, 28). At least, 3 repetitions of the test were performed, which were separated by taking rest for more than 3 minutes to reduce any fatigue effects (29). Slight warming up exercises were performed (including stretching and low intensity aerobic exercises) before increasing the force of contraction during the protocol and keeping it for 3 - 5 seconds and then relaxing. MVC was taken at the two HAs. The participants were asked to perform unilateral plantar flexion at 90° of the ankle position for MVC of gastrocnemius. The participants were also asked to perform dorsiflexion in supine position against the force applied for tibialis anterior. They were required to stay in sitting position and extend the leg at 90° against the force for vastus medialis. The signal was processed as mentioned above. RMS was calculated with the EMGworks analysis software. Then, average of the RMS of the MVC was calculated in excel format and used for normalization. The mean of the last two minutes of RMS values of each muscle during each load carriage experiment was used for normalization. The same experimental protocol was followed at HA1 and HA2.
2.9. Statistical Analysis
Before going for statistical treatment, the data set was tested for skewness and normality by using Shapiro-Wilk test as the sample size was less than 50. A three way repeated measures ANOVA was applied for the physiological parameters as the same group of volunteers was exposed to two levels of altitudes, two levels of gradients, and three levels of loads to see over all significance across the conditions. The degree of freedom (df) of the data was checked through Mauchly’s test of sphericity for all independent variables and their combinations. The respective ‘F’ values were taken to check the level of significance. If the sphericity is not assumed, then it was corrected with Greenhouse Geisser’s correction factor. The corresponding ‘F’ values were taken as the level of significance. Subsequent to the observed significance level for the various cardiorespiratory and electromyographic parameters, Bonferroni Post-Hoc test was applied to compare between the conditions pairwisely. For all the tests, statistical significance was verified at P ≤ 0.05 level. Statistical analysis was performed using SPSS, version 16.0 (IBM Corporation, New York, USA).
3. Results
3.1. Physiological and Subjective Parameters
The SpO2 of the participants in the present study stabilized at around 92% at HA1 and around 91% at HA2 at rest. The average VO2max at two HAs was 44 (± 5.7) and 37.3 (± 4.0), respectively (Table 1). Changes in HR with different levels of gradients, loads, and altitudes are presented in Figure 3. Repeated measures ANOVA revealed that HR significantly increased with the following conditions; gradient: F (1, 7) = 161.379 and load: F (2, 14) = 72.897 (P < 0.05). HR had a significant increase with the interaction of gradient and altitude: F (1, 7) = 19.567, gradient and load: F (2, 14) = 4.526, and gradient, load, and altitude: F (2, 14) = 4.125 (P < 0.05). Pairwise comparison by Bonferroni test revealed a significant difference between the effects of two levels of gradient and the effects of three levels of load. Oxygen consumption responses with different gradients, loads, and altitudes are presented in Figure 4. From the results of repeated measures ANOVA, the VO2 showed a significant increase with the following conditions; gradient: F (1, 7) = 78.948, altitude: F (1, 7) = 8.267, and load: F (2, 14) = 154.386 (P < 0.05). VO2 also changed significantly with the following interactions; gradient and load: F (2, 14) = 28.358, altitude and load: F (1, 7) = 10.934, gradient, altitude, and load: F (2, 14) = 15.850 (P < 0.05). Post-Hoc test showed a significant difference between the effects of both levels of gradient, both levels of altitude, and all three levels of load. Changes in RWL with different gradients, loads, and altitudes are presented in Figure 5. RWL showed a significant increase with the following conditions; gradient: F (1, 7) = 114.101, altitude: F (1, 7) = 52.199, and load: F (2, 14) = 171.221 (P < 0.05). RWL also changed significantly with the interactions of gradient and load: F (2, 14) = 38.161, altitude and load: F (1, 7) = 11.637, gradient, altitude, and load: F (2, 14) = 10.875 (P < 0.05). Post-Hoc test revealed a significant difference between the effects of both levels of gradient, both levels of altitude, and all three levels of load. Perceived exertions changed with different gradients, loads, and altitudes as presented in Figure 6. Repeated measures ANOVA revealed that RPE had a significant increase with the following conditions; gradient: F (1, 7) = 39.625, load: F (1.256, 8.795) = 101.984, (P < 0.05). RPE had a significant increase with the interaction of gradient and load: F (2, 14) = 4.704, altitude and load: F (2, 14) = 7.432 (P < 0.05). Bonferroni pairwise comparison test revealed a significant difference between the effects of 0% and 10% of gradient as well as all three levels of load.
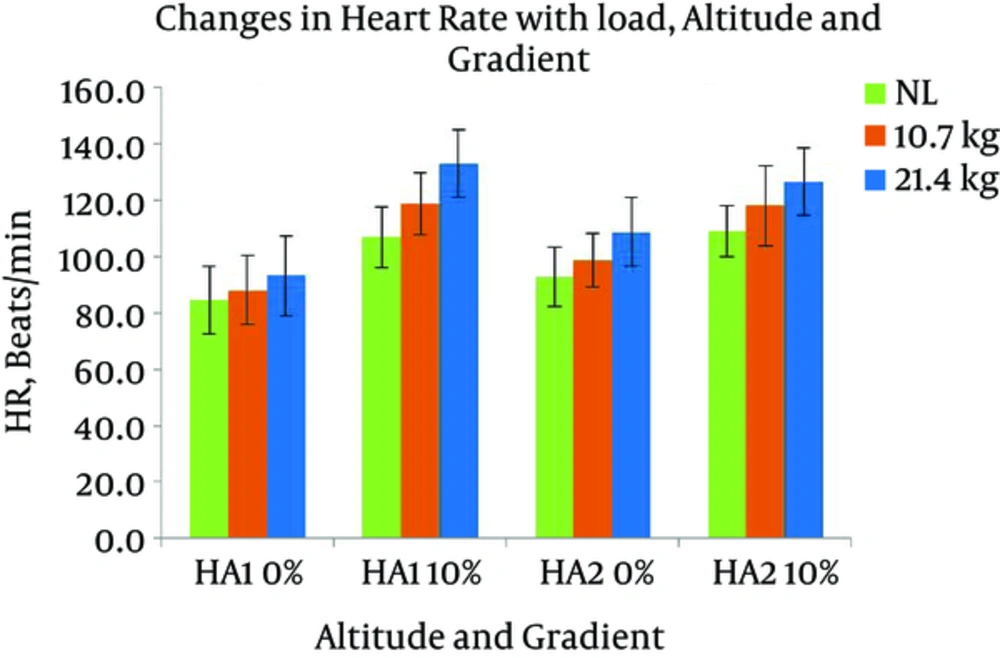
Figure 3.
Changes in HR with Altitude, Load, and Gradient
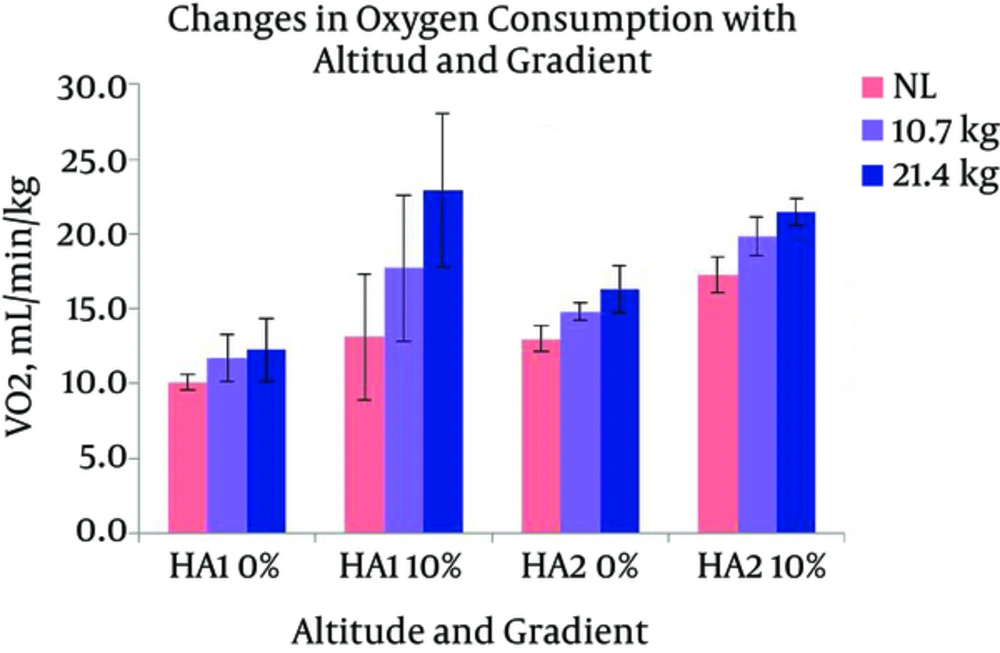
Figure 4.
Changes in VO2 with Altitude, Load, and Gradient
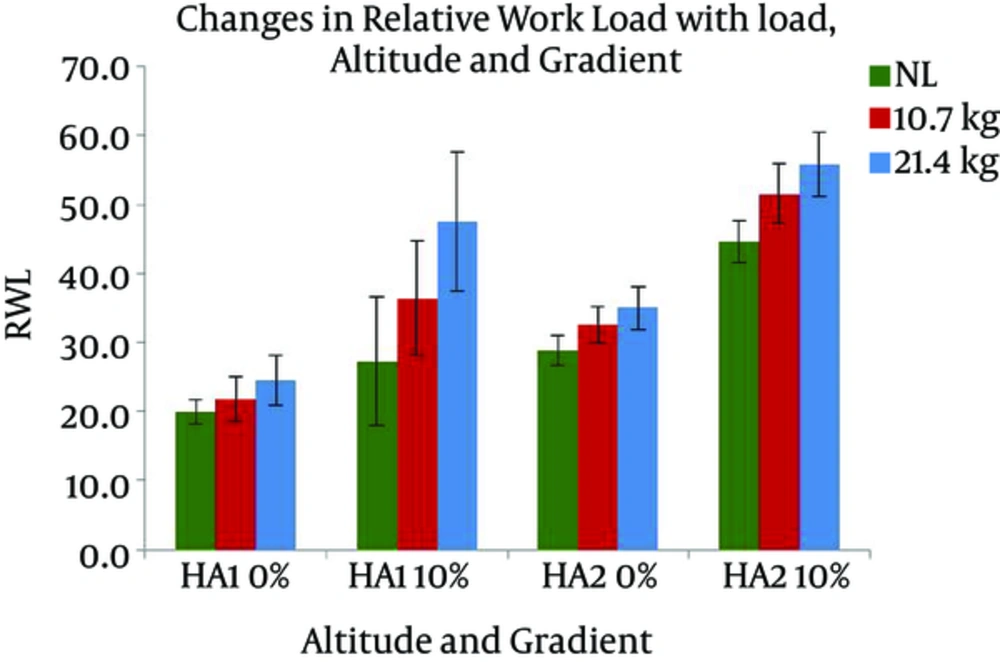
Figure 5.
Changes in RWL with Altitude, Load, and Gradient
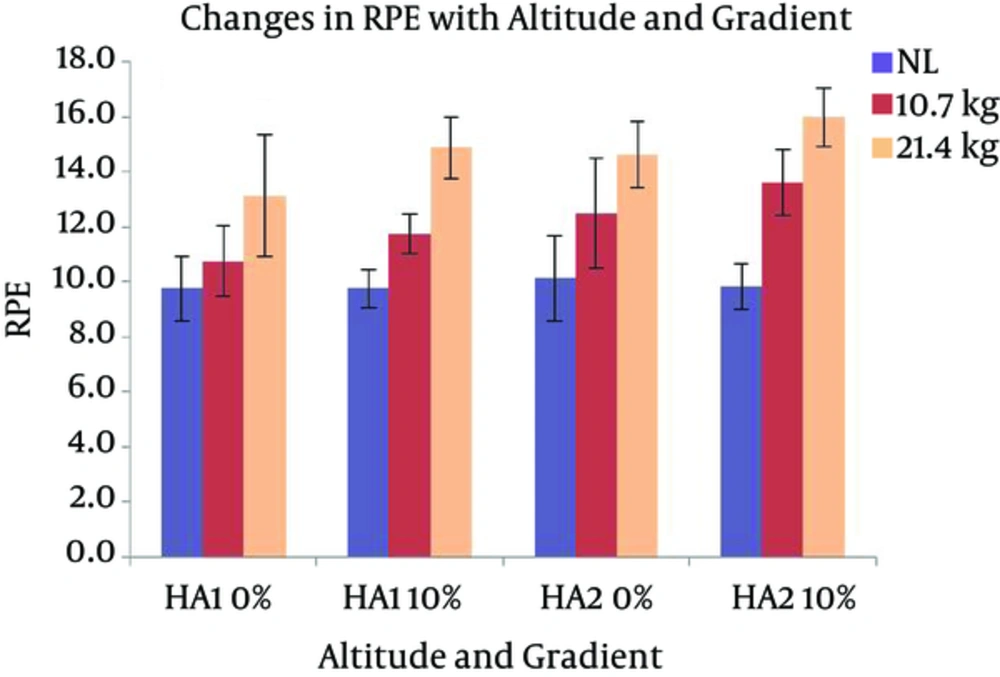
Figure 6.
Changes in RPE with Altitude, Load, and Gradient
3.2. Electromyographic Parameters
Changes in VMR activity with different gradients, loads, and altitudes are presented in Figure 7. The activation of VMR showed a significant increase with the following conditions; gradient: F (1, 7) = 24.517 and load: F (2, 14) = 7.118 (P < 0.05). VMR also changed significantly with the interaction of gradient and altitude: F (1, 7) = 7.804 (P < 0.05). Pairwise comparison found a significant difference between the effects of both levels of gradients, and the levels of 0 and 21.4 kg of load. VML response with different gradients, loads, and altitudes are presented in Figure 8. A significant increase was observed in VML activity with gradient: F (1, 7) = 82.440 and load: F (2, 14) = 10.111 (P < 0.05). Pairwise comparison revealed a significant difference between the effects of gradient levels of 0 and 10% and load levels of 0 and 21.4 kg. Changes in TAR activity with different gradients, loads, and altitudes are presented in Figure 9. At HA1, the response of TAR increased with load and gradient. The activities of TAR did not increase with gradient but changed with load. These changes were not statistically significant. TAL response with different gradients, loads, and altitudes is presented in Figure 10. The response of TAL showed a significant increase with load: F (2, 14) = 4.757 (P < 0.05). Activity of Gastrocnemius right with different gradients, loads, and altitudes is presented in figure 11. Overall, a significant increase was seen in GMR activity with following conditions; gradient: F (1, 7) = 22.677 and load: F (2, 14) = 10.945 (P < 0.05). Bonferroni pairwise comparison revealed a significant difference between the effects of 0% and 10% gradients and 0 and 21.4 kg loads. Changes in GML activity with different gradients, loads, and altitudes are presented in Figure 12. The activity of GML increased significantly with the following conditions; gradient: F (1, 7) = 15.322 and load: F (2, 14) = 16.596 (P < 0.05). Pairwise comparison by Bonferroni Post-Hoc test showed a significant difference between the effects of both levels of gradients, two levels of 0 and 21.4 kg load, as well as two levels of 10.7 kg and 21.4 kg load. The effects of HA and gradient which were significant based on Post-Hoc test on various physiological, subjective, and electromyographic parameters in terms of percentage increases are presented in Tables 4 and 5. The responses of TAR and TAL are not included in the tables as these muscles were not affected by HA and gradient factors.
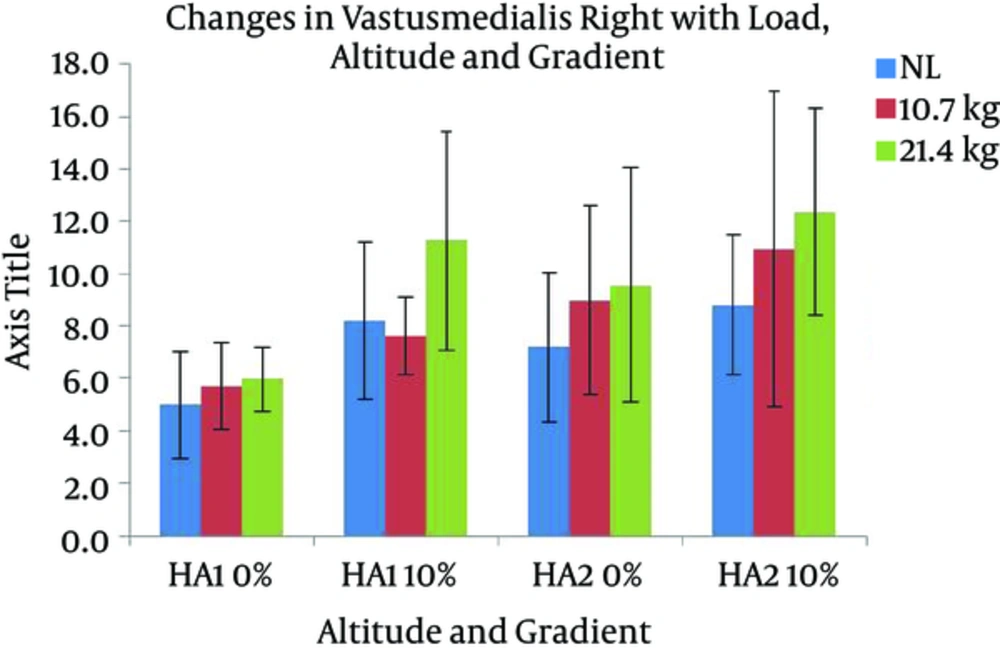
Figure 7.
Changes in Activity of Vastusmedialis Right with Altitude, Load, and Gradient
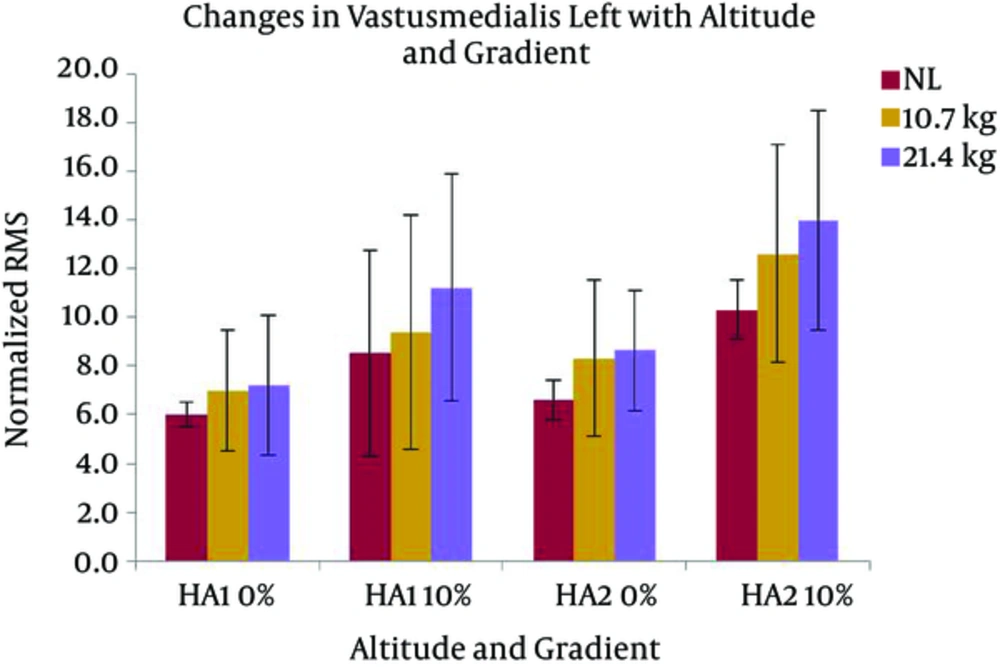
Figure 8.
Changes in Activity of Vastusmedialis Left with Altitude, Load, and Gradient
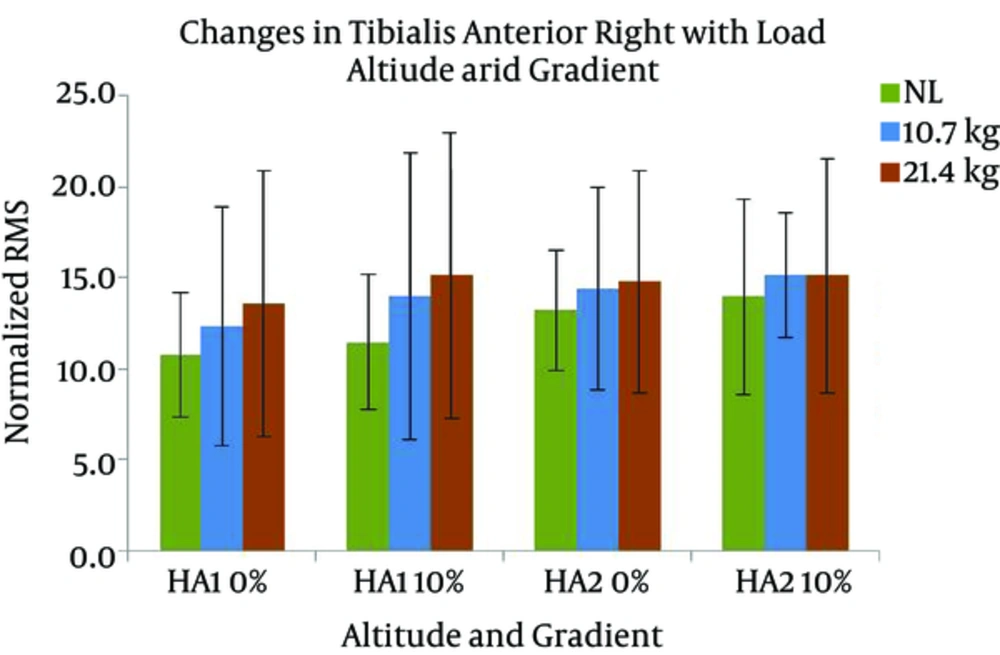
Figure 9.
Changes in Activity of Tebialis Anterior Right with Altitude, Load, and Gradient
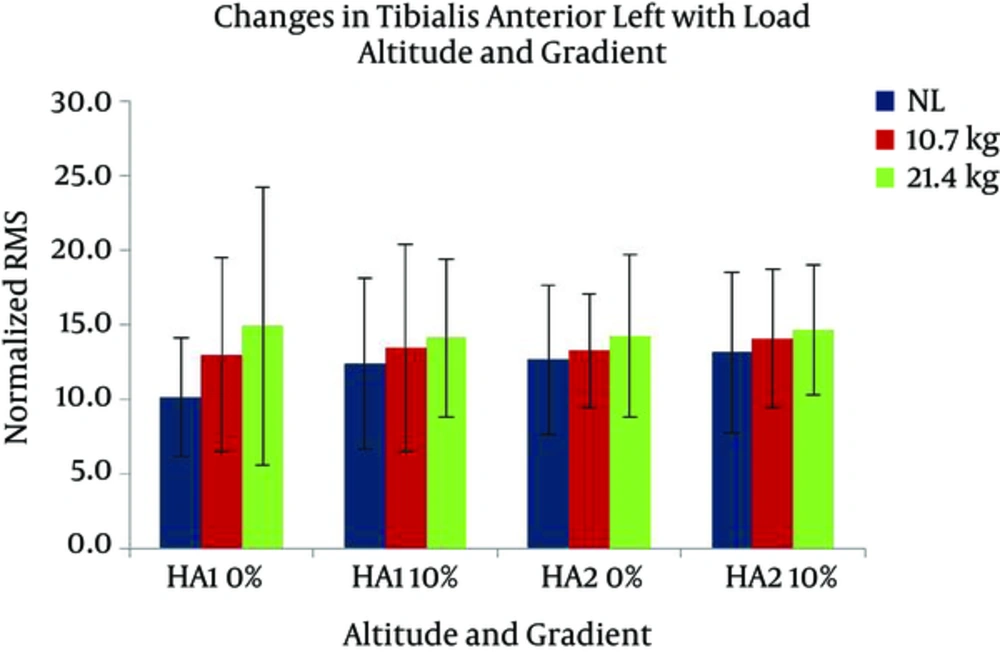
Figure 10.
Changes in Activity of Tebialis Anterior Left with Altitude, Load, and Gradient
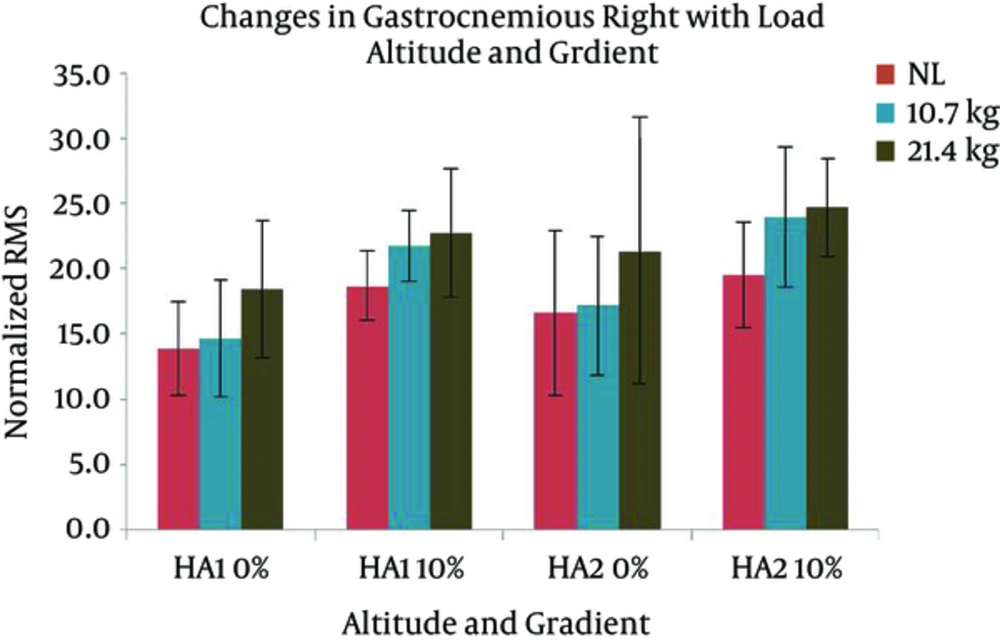
Figure 11.
Changes in Activity of Gastrocnemius Right with Altitude, Load, and Gradient
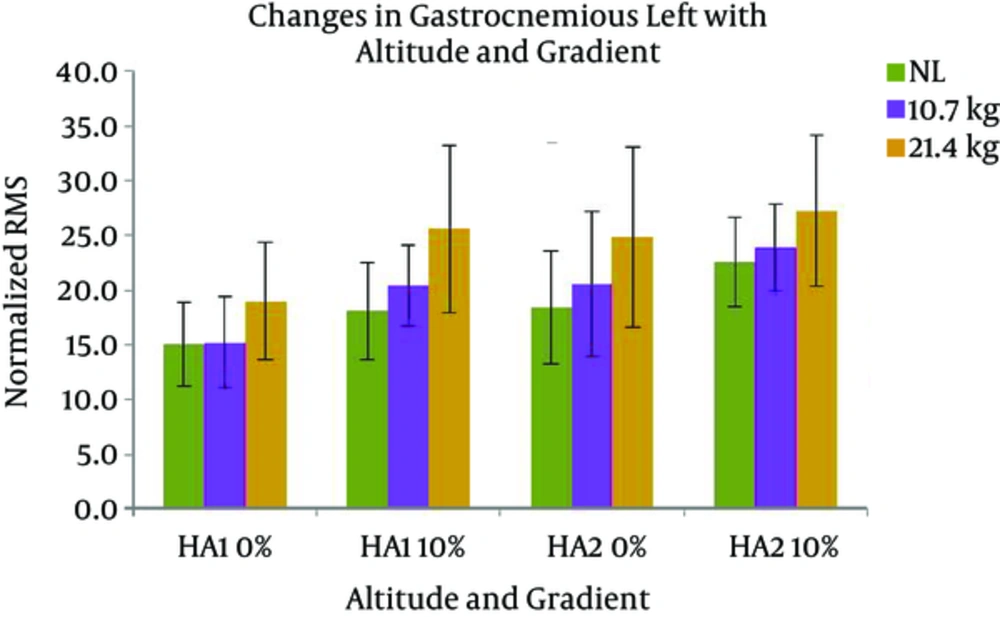
Figure 12.
Changes in Activity of Gastrocnemius Left with Altitude, Load, and Gradient
Table 4.
Effect of High Altitude on Various Parameters Across Three Loads and Two Altitudes in Terms of Percentage Variations
| Gradient | 0% | 10% | ||||||
|---|---|---|---|---|---|---|---|---|
| Muscles | NLHA1 V L1HA1 | NLHA1 V L2HA1 | NLHA2 V L1HA2 | NLHA2 V L2HA2 | NLHA1 V L1HA1 | NLHA1 V L2HA1 | NLHA2 V L1HA2 | NLHA2 V L2HA2 |
| HR | 4a | 10a | 6a | 17a | 11a | 25a | 8a | 16a |
| VO2 | 16a | 22a | 17a | 10a | 35a | 75a | 15a | 25a |
| RWL | 10a | 23a | 6a | 17a | 33a | 74a | 15a | 25a |
| RPE | 10a | 35a | 21a | 53a | 24a | 44a | 39a | 63a |
| VMR | 14 | 20a | 25 | 33a | 11 | 37a | 24 | 40a |
| VML | 17 | 20a | 26 | 31a | 10 | 32a | 22 | 36a |
| GMR | 5 | 33a | 4 | 29a | 16 | 22a | 23 | 27a |
| GML | 2 | 27a | 12 | 35a | 13 | 42a | 6 | 21a |
Abbreviations: HA1, high altitude 1; HA2, high altitude 2; NL, without load; L1, 10.7 kg; L2, 21.4 kg.
aSignificant after computing pairwise comparison, P< 0.05.
Table 5.
Effect of Gradient on Various Parameters Across Three Loads and Two Gradients in Terms of Percentage Variations
| +Altitude | HA1 | HA2 | ||||
|---|---|---|---|---|---|---|
| Muscles | NLG1 V NLG2 | L1G1 V L1G2 | L2G1 V L2G2 | NLG1 V NLG2 | L1G1 V L1G2 | L2G1 V L2G2 |
| HR | 26a | 35a | 43a | 18a | 20a | 17a |
| VO2 | 30a | 51a | 87a | 33a | 34a | 32a |
| RWL | 37a | 67a | 94a | 54a | 58a | 59a |
| RPE | 4a | 16a | 11a | 1a | 16a | 8a |
| VMR | 65a | 34a | 89a | 23a | 23a | 29a |
| VML | 42a | 34a | 56a | 56a | 51a | 62a |
| GMR | 35a | 49a | 23a | 18a | 39a | 16a |
| GML | 20a | 34a | 35a | 23a | 16a | 10a |
Abbreviations: G1, 0%; G2, 10%HA1; high altitude 1; HA2, high altitude 2; NL, without load; L1, 10.7 kg; L2, 21.4 kg.
aSignificant after computing pairwise comparison, P < 0.05.
4. Discussion
In the present study, the physiological parameters like VO2 and RWL significantly increased with increasing load, gradient, and altitude. HR and RPE of the participants increased significantly with load and gradient. On the other hand, the SpO2 status at two HAs indicated insufficient oxygenation of blood within the lung. Physiological and mechanical factors affecting walking and running extreme uphill and downhill gradients were evaluated by Minetti et al. (2002) (30). They observed that energy cost of walking and running increased with increment of gradient. The authors explained this elevated energy expenditure as a ‘safety factor’ to minimize tissue and joint injury. Studies by Crouter et al. (2001) (31) and Padulo et al. (2013) (32) supported this observation. Nag et al. (1978), (18) studied load carriage up to 55 kg on Nepalese porters at HA in steep mountainous paths and found increased VO2. Extreme muscular fatigue and longer recovery time of the white fibers were the reason behind the rise of VO2 according to the authors. They also mentioned that the porters’ inability to continue large amount of work at HA may have played a role in preventing overexertion at HA. The findings of the present study completely corroborated with the observations of Nag et al. (1978) (18).
In the present study, the soldiers rated their perceived exertion level as ‘16’ while carrying L2 at 10% gradient at HA2, which came between ‘hard’ and ‘very hard’ according to RPE table (21). On the other hand, corresponding HR and VO2 were 126.7 b.min-1 and 21.5 mL.min-1.kg-1, respectively. Such a response was not as intense or equivalent for the same load carriage manoeuvre. Possibly, the local (musculoskeletal) factor during load carriage overwhelmed the overall perception of exertion (33). Researchers have previously pointed the role of cardiopulmonary, central, and local muscular sensations as important factors behind elevated RPE (34-36). Earlier studies also claim that RWL, HR, and VO2 contribute to the central component of the perception of exertion (34, 37). The present study was carried out at HA. It can be expected that there was a miss match between the cardio-respiratory responses of the individuals and their perception of exertion during load carriage as an effort to cope up with the physical demands of carrying the same magnitude of load at HA. The role of local components in higher RPE in the present study can be revealed with evaluation of the activities of leg muscles during the same task.
The present study dealt with the analysis of three pairs of lower limb muscles to assess their activity with a combination of different loads, gradients, and altitudes. These muscles were affected by load and gradient in their respective activities. Vastus medialis is a part of quadriceps involved in knee extension (38). Gastrocnemius is a form of calf muscle involved in plantar flexion. Tibialis anterior as the most medial muscle of the anterior compartment of leg is responsible for dorsi-flexion and inverting the foot. The activity of these muscles has been widely studied using EMG (39-41). Franz and Kram (2012) (42) found the effect of grade and speed on hip, knee, and ankle extensor muscles with increased activation while walking uphill (9°). Patla (1986) (43) studied the effect of walking at various elevations on the EMG responses of selected lower limb muscles. Their findings showed that proximal muscles had a greater increase in muscle activation than distal muscles to cope up with the demands imposed by various inclines. Hill walking elicits modifications in muscle activation patterns to meet changes in anterior-posterior stability and propulsion requirements (44, 45). Such excessive activity of the soldiers’ leg muscles in the present study can be attributed to stabilized extra postural load of inclined walking and constant forward movement of the body. Holewijn et al. (1990) (46) measured metabolic, cardiovascular, and EMG responses of a treadmill walking task with a combination of multiple loads and speeds and found that loaded walking resulted in increased HR, VO2, and EMG activities. The soldiers of Indian Army carry the rifle in hand and HS in waist region. VML and GML muscles had a higher response while carrying the heavier load of 21.4 kg at both HAs and gradients. Heavier backpacks with rifle in right hand may have prompted the left leg muscles to contract at a greater degree to keep the body’s balance intact. On the other hand, excessive contraction of the leg muscles seemed to meet the demands of load carriage at inclination and stress of high altitudes.
An increase in EMG activity was more observed at HA2 than HA1 for almost all leg muscles in the present study, though the effect was not statistically significant. This observation is in agreement with the findings of Orizio et al. (1993) (13), Esposito et al. (2003) (14), and Caquelard et al. (2000) (15) who found the minimum effect of hypoxia in muscular performances. Number of isometric contractions of biceps brachii muscles at HA was assessed by Casale et al. (1999) (47). There was barely a change in the global EMG spectral, amplitude parameters, and conduction velocity during the ten days stay at HA for either voluntary or electrically elicited contractions. These facts intensify the findings of the present study indicating that leg muscles likewise are not considerably affected by HA hypoxia. The soldiers in the present study did not perform sustained contraction; instead they walked on treadmill while carrying load. Human gait cycle is divided into swing phase and stance phase. During normal walking, these phases interchange within each other, and double support phase occurs during the overlap between stance phases of the left and right feet (48, 49). Such phasic contractions of lower limb muscles have been tested in plains; but at high altitude, it is less explored. Thus, slightly higher rate of muscular contraction at HA2 can be credited to withstand the stress of load carriage at such an extreme condition and localised exertion.
Vogel et al. (1980) (50) recommended acceptable workload (AWL) for U.S. Army soldiers in outdoor work. According to their suggestion, soldiers could work at a rate of 50% of VO2max for 8 hrs and 50% - 75% of VO2max for 2 hrs. Indian soldiers in the present study had mean RWL of 44.6%, 51.5%, and 55.8% for carriages of NL, L1, and L2, respectively, at 3.5 km.hr-1 and 10% gradient at HA2. The soldiers had an RWL of 35% for L2 during level ground walking at the same speed and altitude. The participants rated their exertion as ‘16’ with this load, gradient, and altitude combination. Hence, load carriage up to 32% of body weight (BW, L2) is suggested for 2 hrs at 4300 m height, 3.5 km.hr-1 walking speed, and 10% gradient. A lower magnitude of load, i.e. 16% of BW, is suggested to be carried for up to 8 hr in this combination of height, speed, and gradient. The RWL for HA1 at same speed and gradient was 27.3%, 36.4%, and 47.5% in NL, L1, and L2, respectively. In these conditions, the soldiers’ perceived exertion was ‘15’, i.e. ‘hard’, for L2. Hence, at 3500 m height, a load up to 32% of BW is recommended for carriage for 8 hrs with gradient of 10% at speed not exceeded 3.5 km.hr-1. At level ground walking, maximum RWL at HA1 was 24.5% of VO2max. In this context, 32% of BW is recommended for carriage for longer duration such as 8 hrs at 3500 and 4300 m height, 0% gradient, and 3.5 km.hr-1 walking speed.
4.1. Study Limitations
The suggestions presented above are based on load carriage study at level ground and 10% gradient at two high altitudes. The effect of texture of the terrain, wind chill, snow, and steeper gradients etc. was excluded from the findings of the study. All the participants were on the way of their respective HA posting. Thus, due to limited time, data of load carriage task of similar intensity at sea level could not be recorded.
4.2. Conclusions
Load carriage with existing LCe at 3550 m and 4300 m heights with a speed of 3.5 km.hr-1 and 10% gradient resulted in a significant rise in HR, VO2 and RWL and RPE scores. The HR and RPE changed significantly with load and gradient. Significant activation of VMR, VML, GMR, and GML muscles were observed in response to increasing gradient and load. The activities in TAL changed only with load. There were little increase in activities of VMR, VML, GMR, and GML accompanied by increase in altitude. Slightly increased muscular activity of lower limbs could sustain the requirement of load carriage task in inclination of the treadmill and can be extrapolated to steep slopes of high mountains. Depending on the RWL and RPE at 3550 m height, a load up to 32% of BW is recommended for carriage for 8 hrs with gradient of 10% at speed not exceeded 3.5 km.hr-1. A load up to 32% of BW is suggested for carriage for 2 hrs at 4300 m height, 3.5 km.hr-1 walking speed, and 10% gradient. The findings of the study will be useful in designing load carriage task at various HAs and will be helpful in assessing injury proneness and prevention. The suggestions are applicable to the global soldier community and other civilians who regularly operate in HA terrain conditions.