
1. Background
A pregnant women's body mass index (BMI) plays a significant role in the outcome of the pregnancy and the birth weight of infants. BMI is the relative measurement of the percentage of fat and muscle mass in the human body, which is calculated by dividing weight in kilograms divided by the square of height in meters (1). High body mass index is also associated with increased blood pressure, gestational diabetes, postpartum hemorrhage, induction of labor, cesarean section, and macrosomic fetus, and conversely, the lowest maternal mortality rate during pregnancy is related to women who had a normal BMI before pregnancy (2, 3). Infants weighing more or less than the usual range is at a greater risk of death and physical and neurological impairment (4). The need to pay more attention to the examination and measurement of mothers' BMI and weight gain during pregnancy care, as well as to try as hard as possible to improve mothers' nutritional status and family education, is stressed in this field due to the relatively high prevalence of abnormal BMI and abnormal weight gain during pregnancy (weight gain more or less than the recommended amount) (5).
2. Objectives
Considering the consequences that the birth of babies with low weight imposes on the society, the objective of the current research is to ascertain the association between the mother's BMI during pregnancy and the birth weight of infants delivered in affiliated hospitals of Islamic Azad University, Tehran Medical Sciences between the years 2020 and 2021.
3. Methods
The present study is a cross-sectional descriptive study that consisted of infants born in affiliated hospitals of Islamic Azad University, Tehran Medical Sciences from 2020 to 2021. According to the objectives and type of study, and referring to previous studies (6) in this field that showed the prevalence of low birth weight to be 7.5% (P = 0.075), and taking into account the error of 5% (= 0.05) and the maximum error of 5% sampling (d = 0.05), 288 samples were included in the study. Methods of sampling was simple random sampling. The data collection form was designed as a checklist, including baby's birth weight, mother's age, baby's gender, delivery type, mother's body mass index, mother's preeclampsia, mother's parity, gestational age, mother's occupation, mother's education, family income. The inclusion criteria included singleton pregnancies, while the exclusion criteria were delivery of infants with birth defects. Information about infants, including gender and birth weight, as well as the women's information were entered into the checklist. The analysis of the obtained data was performed by the SPSS software version 26, and the level of statistical significance was set at P < 0.05. The Kolmogorov-Smirnov test was utilized to examine whether the data were normally distributed. The procedures of the present research were confirmed by the Ethic Committee of Islamic Azad University, Tehran Medical Sciences and in accordance with Helsinki Declaration. The information of patients has been kept confidential, and the checklist was coded and will be delivered to them if needed. Subjects voluntarily participated in the study, no cost was imposed on people, and no change was made in the routine course of treatment of patients. This research was conducted with the ethics code of IR.IAU.TMU.REC.1399.502 at Islamic Azad University, Tehran Medical Sciences.
4. Results
This research included 288 women mean age was 30.26 ± 5.9 years (Table 1).
Table 1.
Demographic Characteristics of Women and Their Infants a
| Variables | Values |
|---|---|
| Age of women | |
| 20 > | 7 (2.4) |
| 20 - 29 | 118 (41) |
| 30 - 39 | 148 (51.4) |
| 40 ≥ | 15 (5.2) |
| BMI of women | |
| Normal weight | 56 (19.4) |
| Overweight | 118 (41) |
| Obese | 114 (39.6) |
| Educational status of women | |
| High school degree | 54 (18.8) |
| Diploma | 118 (41) |
| Bachelor’s degree | 102 (35.4) |
| Master’s degree | 14 (4.9) |
| Occupation of women | |
| Housewives | 243 (84.4) |
| Part-time Job | 44 (15.3) |
| Full-time job | 1 (0.3) |
| Parity | |
| Nulliparous | 133 (46.2) |
| Multiparous | 155 (53.8) |
| Gestational age | |
| Preterm | 4 (1.4) |
| Term | 284 (96.8) |
| Type of delivery | |
| Natural | 77 (26.7) |
| Cesarean section | 211 (73.3) |
| History of preeclampsia | |
| Yes | 17 (5.9) |
| No | 271 (94.1) |
| Family income | |
| Under poverty line | 142 (49.3) |
| Sufficient | 146 (50.7) |
| Gender of infant | |
| Female | 133 (46.2) |
| Male | 155 (53.8) |
| Birth weight of infants | |
| LBW | 11 (3.8) |
| Normal | 263 (91.3) |
| Macrosomia | 14 (4.9) |
| Weight of women (kg) | 76.06 ± 13.5 |
| Height of women (m) | 161.79 ± 6.1 |
| BMI of women | 29.03 ± 4.8 |
| Birth weight of babies (grams) | 3262.86 ± 419.1 |
a Values are expressed as No. (%) or mean ± SD.
The frequency distribution of characteristics of women and their newborns based on women’s BMI is presented in Table 2 according to the chi-square test.
Table 2.
Frequency Distribution of the Studied Variables According to Women’s BMI
| Variables | Normal (n = 56) | Overweight (n = 118) | Obese (n = 114) | P Value a |
|---|---|---|---|---|
| Age of women | 0.017 * | |||
| < 20 | 4 (7.1) | 2 (1.7) | 1 (0.9) | |
| 20 - 29 | 27 (48.2) | 55 (46.6) | 36 (31.6) | |
| 30 - 39 | 23 (41.1) | 57 (48.3) | 68 (59.6) | |
| > 40 | 2 (3.6) | 4 (3.4) | 9 (7.9) | |
| Educational levels of women | 0.109 | |||
| High school degree | 17 (30.4) | 16 (13.6) | 21 (18.4) | |
| Diploma | 21 (37.5) | 53 (44.9) | 44 (38.6) | |
| Bachelors’ degree | 15 (26.8) | 46 (39) | 41 (36) | |
| Master’s degree | 3 (5.40) | 3 (2.5) | 8 (7) | |
| Occupation of women | 0.281 | |||
| Housewives | 47 (83.9) | 103 (87.3) | 93 (81.6) | |
| Part-time job | 8 (14.3) | 15 (12.7) | 21 (18.4) | |
| Full-time job | 1 (1.8) | 0 | 0 | |
| Parity | 0.398 | |||
| Nulliparous | 25 (44.6) | 60 (50.8) | 48 (42.1) | |
| Multiparous | 31 (55.4) | 58 (49.2) | 66 (57.9) | |
| Family income | 0.082 | |||
| Under poverty line | 35 (62.5) | 56 (47.5) | 51 (44.7) | |
| Sufficient | 21 (37.5) | 62 (52.5) | 63 (55.3) | |
| Type of delivery | 0.001 * | |||
| Natural | 25 (44.6) | 31 (26.3) | 21 (18.4) | |
| Cesarean section | 31 (55.4) | 87 (73.7) | 93 (81.6) | |
| Preeclampsia | 0.334 | |||
| No | 55 (98.2) | 111 (94.1) | 105 (92.1) | |
| Yes | 1 (1.8) | 7 (5.9) | 9 (7.9) | |
| Gestational age | 0.685 | |||
| Preterm | 1 (1.8) | 1 (0.8) | 2 (1.8) | |
| Term | 55 (98.2) | 117 (99.2) | 112 (98.2) | |
| Gender of infants | 0.224 | |||
| Female | 20 (35.7) | 57 (48.3) | 56 (49.1) | |
| Male | 36 (64.3) | 61 (51.7) | 58 (50.9) | |
| Birth weight of infants | 0.238 | |||
| Underweight | 1 (1.8) | 7 (5.9) | 3 (2.6) | |
| Normal | 53 (94.6) | 108 (91.5) | 102 (89.5) | |
| Macrosomia | 2 (3.6) | 3 (2.5) | 9 (7.9) |
a Chi-square test.
According to Table 3, the mean values of BMI were calculated in different subgroups of the studied samples. The highest BMI values were found in women 40 years old and older (P value = 0.001), family income (P value = 0.038), cesarean deliveries (P value ≤ 0.001) and no history of preeclampsia (P value = 0.007). Regarding the normality of BMI distribution, the t-test and ANOWA was used to analyze the data.
Table 3.
Women’s Mean BMI Based on Other Variables
| Variables | Means ± SD | P Value a |
|---|---|---|
| Age of women | 0.001 * | |
| > 20 | 25.02 ± 3.90 | |
| 20 - 29 | 27.94 ± 4.15 | |
| 30 - 39 | 29.89 ± 5.03 | |
| 40 < | 31.06 ± 4.96 | |
| Educational levels of women | 0.415 | |
| High school degree | 29.24 ± 4.81 | |
| Diploma | 29.04 ± 4.96 | |
| Bachelor’s degree | 29.22 ± 4.34 | |
| Master’s degree | 30.03 ± 6.20 | |
| Occupation of women | 0.385 | |
| Housewives | 28.93 ± 4.71 | |
| Part-time job | 29.70 ± 5.23 | |
| Full-time job | 24.97 | |
| Parity | 0.940 | |
| Nulliparous | 29.06 ± 4.76 | |
| Multiparous | 29.00 ± 4.83 | |
| Family income | 0.038 * | |
| Under poverty line | 28.44 ± 4.73 | |
| Sufficient | 29.61 ± 4.80 | |
| Type of delivery | < 0.001 * | |
| Natural | 4.55 ± 27.09 | |
| Cesarean section | 4.69 ± 29.74 | |
| Preeclampsia | 0.007 * | |
| No | 28.84 ± 4.71 | |
| Yes | 32.05 ± 5.15 | |
| Gestational age | 0.911 | |
| Preterm | 28.49 ± 8.07 | |
| Term | 29.04 ± 4.75 | |
| Gender of infants | 0.129 | |
| Female | 29.49 ± 4.82 | |
| Male | 28.63 ± 4.74 | |
| Birth weight of infants | 0.283 | |
| Underweight | 28.65 ± 4.51 | |
| Normal | 28.96 ± 4.80 | |
| Macrosomic | 30.69 ± 4.86 |
at-test and ANOWA.
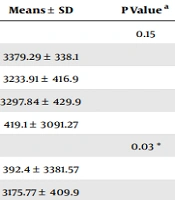
The mean birth weight values of infants according to the variables examined in this study are depicted in Table 4 by the t-test and ANOWA. The mean weight of infants was significant correlated to educational levels of women, parity, gestational age, gender of infant and BMI of women (P value ≤ 0.05). Based on the significant level mentioned between the mother's BMI and the baby's birth weight, there is a significant relationship between these two variables and it is proven that the mother's BMI is effective on the baby's birth weight.
Table 4.
The Mean Birth Weight of Infants Based on the Other Analyzed Variables
| Variables | Means ± SD | P Value a |
|---|---|---|
| Age of women | 0.15 | |
| < 20 | 3379.29 ± 338.1 | |
| 20 - 29 | 3233.91 ± 416.9 | |
| 30 - 39 | 3297.84 ± 429.9 | |
| > 40 | 419.1 ± 3091.27 | |
| Educational levels of women | 0.03 * | |
| High school degree | 392.4 ± 3381.57 | |
| Diploma | 3175.77 ± 409.9 | |
| Bachelor’s degree | 3292.83 ± 420.7 | |
| Master’s degree | 3320.71 ± 474.1 | |
| Occupational of women | 0.993 | |
| Housewives | 422.2 ± 3259.96 | |
| Part-time job | 3280.34 ± 410.6 | |
| Full-time job | 3200 | |
| Parity | 0.028 * | |
| Nulliparous | 3203.91 ± 438.3 | |
| Multiparous | 396.3 ± 3313.45 | |
| Family income | 0.706 | |
| Under poverty line | 3249.61 ± 402.6 | |
| Sufficient | 3275.75 ± 435.5 | |
| Type of delivery | 0.237 | |
| Natural | 3293.77 ± 410.7 | |
| Cesarean section | 3251.59 ± 422.5 | |
| Preeclampsia | 0.173 | |
| No | 3268.19 ± 409.1 | |
| Yes | 563.7 ± 3177.94 | |
| Gestational age | 0.001 * | |
| Preterm | 2432.50 ± 249.5 | |
| Term | 3274.56 ± 409.4 | |
| Gender of infant | 0.002 * | |
| Female | 388.8 ± 3179.51 | |
| Male | 3334.39 ± 431.9 | |
| BMI of women | 0.018 * | |
| Normal | 3231.70 ± 384.8 | |
| Overweight | 418.7 ± 3191.48 | |
| Obese | 422.1 ± 3352.06 |
at-test and ANOWA.
Table 5 displays Pearson's correlation coefficients between several research factors and infant birth weight.
Table 5.
The Correlation Coefficient Between the Analyzed Variables and the Birth Weight of Infants
| Variables | r | P Value a |
|---|---|---|
| Women’s weight | 0.173 | 0.003 * |
| Women’s BMI | 0.133 | 0.024 * |
| Maternal parity | 0.131 | 0.027 * |
| Gestational age | 0.236 | < 0.001 * |
| Gender of infant | 0.185 | 0.002 * |
a Pearson's correlation.
According to the linear model (Table 6), the four variables, women's BMI, gestational age, infant's gender, and parity, play a role in predicting the birth weight of infants in such a way that normal weight or overweight women give birth to infants with lower weight than obese women. Also, infants of nulliparous women, female newborns, and preterm infants have lower birth weights than their counterparts.
Table 6.
The Results of the Generalized Linear Model for Predicting the Birth Weight of Infants
| Variables | B | t | Confidence Interval | P Value |
|---|---|---|---|---|
| Women’s BMI | ||||
| Normal | -141.141 | -2.198 | (-14.717) - (-267.566) | 0.029 * |
| Overweight | -161.981 | -3.137 | (-60.332) - (-263.630) | 0.002 * |
| Obese a | 0 | - | - | - |
| Gestational age | ||||
| Preterm | -871.259 | -4.398 | (-481.342) - (-1261.176) | < 0.0001 * |
| Term a | 0 | - | - | - |
| Gender of infant | ||||
| Female | -174.136 | -3.735 | (-82.361) - (-265.911) | < 0.0001 * |
| Male a | 0 | - | - | - |
| Parity | ||||
| Nulliparous | -90.634 | -1.945 | (-1.069) - (-182.337) | 0.05 * |
| Multiparous a | 0 | - | - | - |
a The basis for the calculation of the data.
5. Discussion
The examination of the data from this study revealed that women's BMI might influence the result of pregnancy and newborns' birth weight, such that most infants with macrosomia are born to obese women. Furthermore, the findings of this study on the mode of birth revealed that the incidence of cesarean section increased with the women's BMI. According to the generalized linear model, among the predictors of newborn weight, we can refer to women’s BMI, gestational age, gender of infant and parity. In summary, the present research found that aberrant maternal BMI, particularly obesity, is related to poor maternal and newborn outcomes, which is consistent with the findings of previous studies in this area, which will be discussed more below. A significant conclusion of this research is that women in the population have a BMI of 29, which indicates a high propensity to be overweight in women of reproductive age and is a risk factor for both women of reproductive age and adolescents. Given that obesity has become a worldwide issue, the findings of this research and related studies may serve as a warning and a source of information for developing strategies to combat obesity in society. In the study by Upadhyay et al., which examined 206 pregnant women with an mean BMI of about 21, the mean birth weight of newborns was 3250 grams (7), which is numerically close to the mean birth weight of newborns studied in our study, and the results obtained were also completely consistent with our study. In addition, both studies demonstrate a statistically significant correlation between a woman's BMI and the birth weight of infants. In a comparable study conducted in Nigeria by Singh et al., the population of pregnant and reproductive-age women tended to be obese and overweight, and there was a strong correlation between maternal BMI and weight in both studies (8). The same outcomes were observed during the delivery of newborns in two genetically and environmentally distinct populations. Therefore, based on these findings, it may be concluded that a woman's weight and BMI before becoming pregnant are crucial. The findings demonstrated a strong correlation between the nutritional state of the woman, the health of the fetus, and the birth weight of the infant. It should be noted that the nutritional health of pregnant women affects the growth and development of the fetus. The women's weight and BMI may be used to estimate the weight of the infant at birth since, as previously discussed, the women's BMI before or at the initiation of pregnancy is also one of the markers of the women's nutritional health. Paprikar and Patole discovered that 72% of infants born to overweight women were large at gestational age (LGA) in a study of 150 pregnant women (9). According to the obtained results, it was explained that overweight women have a higher possibility of giving birth to infants with a higher weight than women with a normal weight, and the results of this study were completely consistent with the findings even in the presence of fundamental discrepancies, such as the difference in mean age and BMI. Similar to our findings, Zhao et al. demonstrated a strong association between maternal overweight or obesity and the delivery of LGA infants (10). In the study of Mohammadi et al., who examined 4397 pregnant mothers, it was reported that obese women have a higher risk of giving birth to macrosomic newborns (11). It was also proven that increasing the women’s BMI decreases the possibility of giving birth to an underweight newborn. In the study of Nemmati et al., a significant relationship was observed between women’s BMI and the birth weight of the baby (12). However, there was no statistically significant relationship between the women’s age and birth weight, which is completely consistent with our study from both perspectives. Given that both studies were conducted in Iran and the relative similarity of ethnicity and genetics, the results of these two studies could be considered for further consideration.
Bahrami Taghanaki et al. showed that women's BMI significantly influences birth weight, and the frequency of macrosomia is higher in obese women (13), which is similar and consistent with our results. Also, similar to the results of our study, a significant association was found between increasing BMI values and preeclampsia. Maleki et al. demonstrated a significant linear association between an increase in BMI values of women from before to after pregnancy and the birth weight of infants (14). Also, similar to our study, Yu et al. exhibited the presence of a significant correlation between the increased risk of having an infant born with a higher weight than a woman with a higher BMI (15). Low birth weight women are at increased risk of delivering LBW babies. Therefore, both extreme ranges of maternal BMI may influence the risk of adverse neonatal outcomes (16). According to the obtained results, Yu et al. stated that maternal overweight or obesity increases the risk of LGA and macrosomia as well as overweight and obesity in adulthood (15). Terada et al. performed a multiple regression analysis to identify factors affecting birth weight. They concluded that nulliparity, smoking, and low BMI women are related to low birth weight, women’s age, women’s height, pregnancy weight gain, maternal BMI, use of in-vitro fertilization, induction of labor, and duration of pregnancy with high birth weight (17). In terms of the relationship between low birth weight and nulliparity and female gender, as well as the association between high weight and women’s BMI, their findings are similar to the results of our study. In a study conducted by Ørskou et al., a significant relationship was detected between high birth weight, giving birth to the male gender, high maternal weight before pregnancy, gestational age over 42 weeks, and parity over 2, proving the correlation of these factors with high weight (18). In our research, the reversal of these characteristics with low weight was shown, indicating that the weight distribution of newborns differs between these two studies. In a systematic study and meta-analysis conducted on more than 1.6 million Chinese mothers, the effect of maternal BMI on adverse neonatal outcomes was investigated. In summary, this study found that maternal overweight or obesity was associated with preterm birth and infant suffocation, while maternal underweight was associated with low birth weight (19). A meta-analysis conducted in 2019 showed that as the mother's BMI increases, the chance of obesity in children increases significantly (20).
Since the sample of this study was examined only in a few hospitals, it cannot be generalized to the whole society and there is a need to conduct wider studies at the community level.
This study have limitations. Demographic information of the father may also affect the growth parameters of the babies, but it was not presented in this study. To collect data related to the mother's demographics, since there is no national health registry system, we have to rely on the information provided by the mother because.