
1. Background
Prediabetes is an intermediate condition of hyperglycemia with fasting plasma glucose (FPG) concentration above the normal range but below the diabetes cut-offs (1). According to the American Diabetes Association, prediabetes includes several parameters, namely impaired glucose tolerance (IGT), impaired fasting glucose (IFG), and hemoglobin A1c (HbA1c) value (range: 5.7 - 6.4%) (2, 3). If the hyperglycemic status is not controlled, prediabetic individuals will be advanced into type 2 diabetes after 5 - 10 years, which is established as a major risk factor of cardiovascular diseases (4).
Diabetes mellitus is considered a serious metabolic disorder with a major impact on the physical, psychological, and social health of individuals, families, and communities worldwide (5). It is characterized by hyperglycemia, resulting in micro-and macro-vascular complications, organ failure, and lipid disorders (5, 6). In 2019, at least 463 million subjects suffered from diabetes, and this number will reach 578 million individuals by 2030 according to the predictions (7). The World Health Organization estimated that in 2025 about 5.2 million individuals would have diabetes mellitus in Iran (8).
In recent years, the prevalence of prediabetes is increasing worldwide, and probably more than 470 million individuals will have prediabetes symptoms by 2030 (6). However, most of these individuals are unaware of their prediabetic status. A recent study performed on prediabetic individuals reported that 50 - 80% of these patients did not have enough basic information to manage this disease. These individuals require self-management educational programs to learn how to control and improve their condition (9, 10).
Monitoring biochemical indices, such as FPG, triglyceride (TG), total cholesterol (TC), and other anthropometric measures is an essential need of continuous monitoring of the pre-diabetic patients and their risk factors to control them (11, 12). However, identifying these factors is recommended as an effective and low-cost strategy to control prediabetes or delay the progression of type 2 diabetes among high-risk individuals (13).
2. Objectives
This study aimed to evaluate anthropometric indices and biochemical measurements among the prediabetic population in Hoveyzeh, Iran.
3. Methods
3.1. Study Setting
This cross-sectional population-based study was conducted on prediabetic subjects in Hoveyzeh located in southwest Iran during 2018 - 2019. The present study was approved by the Ethics Committee of Ahvaz Jundishapur University of Medical Sciences, Khouzestan Province, Iran (IR.AJUMS.REC.1397.689). A total of 240 subjects were randomly selected out of 4,000 prediabetic individuals covered by five comprehensive health service centers in Hoveyzeh. The study objectives were clearly explained to all the participants, and their consent was obtained by signing a consent form.
3.2. Participant Selection
The inclusion criteria were prediabetic individuals aged 30 - 75 years residing in Hoveyzeh. The exclusion criteria were not living in Hoveyzeh, reluctance to continue participating in the study, and acute or chronic illnesses (eg, mental illness, mental retardation, chronic infectious diseases, and motor disabilities). The required data for this study were documented in three categories, including demographic characteristics (eg, age, gender, family members, educational level, occupational status, and marital status), anthropometric indices (eg, height, weight, waist circumference [WC], hip circumference [HC], and body mass index [BMI]), and biochemical and physiological parameters (eg, blood lipids, FPS, and blood pressure).
3.3. Outcome Measures
Prediabetes: This status is defined as IFG (FPG: 100 - 125 mg/dL and 2-hour plasma glucose level < 140 mg/dL) or IGT (FPG < 126 mg/dL, but with 140 ≤ 2-hour plasma glucose concentration < 200 mg/dL) or HbA1c 6.0 - 6.49%. Hypertension: This status is defined as systolic blood pressure (SBP) of > 140 mmHg and diastolic blood pressure (DBP) ≥ 90 mmHg. BMI (kg/m2): This status is defined as a normal weight of < 25 kg/m2. Overweight: This status is defined as 25 ≤ BMI < 30 kg/m2. Obesity: This status is defined as a BMI of ≥ 30 kg/m2. Central obesity: This status is defined as WC of ≥ 80 cm for females and WC of ≥ 94 cm for males (14).
3.4. Statistical Analysis
Statistical analyses were carried out using SPSS software (version 22.0). The data were appropriately reported as number (percentage) or mean ± standard deviation. The Chi-square test and t-test were applied to compare categorical and continuous variables, and a P-value of less than 0.05 was set as a statistically significant level.
4. Results
4.1. Demographic Characteristics of Prediabetic Subjects
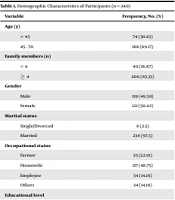
The demographic characteristics of all the participants are summarized in Table 1. Almost half of the participants were male, and most participants were married (97.5%) and within the middle-age range of 45 - 70 years (69.17%). Additionally, the illiteracy rate was reported as 55%.
Table 1.
Demographic Characteristics of Participants (n = 240)
| Variable | Frequency, No. (%) |
|---|---|
| Age (y) | |
| < 45 | 74 (30.83) |
| 45 - 70 | 166 (69.17) |
| Family members (n) | |
| < 4 | 40 (16.67) |
| ≥ 4 | 200 (83.33) |
| Gender | |
| Male | 119 (49.58) |
| Female | 121 (50.42) |
| Marital status | |
| Single/Divorced | 6 (2.5) |
| Married | 234 (97.5) |
| Occupational status | |
| Farmer | 55 (22.91) |
| Housewife | 117 (48.75) |
| Employee | 34 (14.16) |
| Others | 34 (14.16) |
| Educational level | |
| Illiterate | 131 (54.58) |
| Elementary school | 51 (21.25) |
| Secondary school | 18 (7.5) |
| Diploma | 14 (5.83) |
| Associate degree | 16 (6.66) |
| Bachelor’s degree and higher | 10 (4.16) |
4.2. Anthropometric Measurements of Prediabetic Subjects
The results of Table 2 show that the prediabetic subjects are in the overweight category. Table 3 tabulates the association between each variable of subjects’ anthropometric measurements and demographic characteristics. This study documented significant associations between height, HC, and BMI with both genders (P < 0.05). Moreover, there was no statistical relationship between other demographic and anthropometric variables (P > 0.05).
Table 2.
Anthropometric Measurements of Participants (n = 240)
| Variable | Weight (kg) | Height (cm) | Waist Circumference (cm) | Hip Circumference (cm) | Body Mass Index (kg/m2) |
|---|---|---|---|---|---|
| Individuals (Mean ± standard deviation) | 76.69 ± 11.94 | 166.35 ± 9 | 96.41 ± 10.15 | 102.58 ± 12.25 | 27.84 ± 4.71 |
Table 3.
| Weight (kg) | Height (cm) | Waist Circumference (cm) | Hip Circumference (cm) | Body Mass Index (kg/m2) | |
|---|---|---|---|---|---|
| Age (y) | |||||
| < 45 | 76.36 ± 12.94 | 165.28 ± 7.7 | 96.21 ± 10.2 | 102.8 ± 11.12 | 28.01 ± 4.77 |
| ≥ 45 | 76.83 ± 11.51 | 166.83 ± 9.51 | 96.5 ± 10.26 | 102.8 ± 11.42 | 27.77 ± 4.71 |
| P-value | 0.78 | 0.18 | 0.84 | 0.86 | 0.72 |
| Educational level | |||||
| ≤ Diploma | 76.47 ± 11.47 | 165.92 ± 9.04 | 96.44 ± 10.32 | 102.8 ± 11.49 | 27.93 ± 4.7 |
| Academic degree | 78.44 ± 15.5 | 169.92 ± 8.02 | 96.23 ± 9.52 | 100.88 ± 9.68 | 27.14 ± 4.91 |
| P-value | 0.43 | 0.03* | 0.92 | 0.42 | 0.42 |
| Marital status | |||||
| Single | 76.9 ± 11.93 | 166.41 ± 9.08 | 96.58 ± 10.24 | 102.69 ± 11.37 | 27.9 ± 4.73 |
| Married | 68.5 ± 10.42 | 164.17 ± 5.81 | 90 ± 7.07 | 98.67 ± 8.62 | 25.45 ± 3.99 |
| P-value | 0.09 | 0.55 | 0.12 | 0.39 | 0.21 |
| Gender | |||||
| Male | 77.61 ± 11.62 | 170.34 ± 8.19 | 96.06 ± 9.19 | 101.07 ± 9.48 | 26.85 ± 4.32 |
| Female | 75.78 ± 12.25 | 162.43 ± 8.02 | 96.76 ± 11.16 | 104.07 ± 12.72 | 28.82 ± 4.9 |
| P-value | 0.24 | < 0.001*** | 0.59 | 0.04* | 0.001** |
a Values are presented as means ± standard deviation.
b * Comparison between two groups.
4.3. Distribution of Clinical Features of Participants
The findings of FPG (mg/dL), TG (mg/dL), TC (mg/dL), and blood pressure variables (mmHg) of prediabetic subjects are presented in Table 4. The mean values of FPG, TG, and TC were 113.13 ± 6.8, 193.64 ± 115.44, and 193.64 ± 40.67 mg/dL, respectively. The mean values of SBP and DBP were 114.75 ± 15.25 and 73.25 ± 8.81 mmHg, respectively. The results in Table 5 show no statistically significant difference between clinical and demographic variables except between DBP and marital status (P < 0.05).
Table 4.
Clinical Features of Participants (n = 240)
| Variable | FPG (mg/dL) | TG (mg/dL) | TC (mg/dL) | SBP (mmHg) | DBP (mmHg) |
|---|---|---|---|---|---|
| Individuals (Mean ± standard deviation) | 113.13 ± 6.8 | 193.64 ± 115.44 | 193.64 ± 40.67 | 114.75 ± 15.25 | 73.25 ± 8.81 |
Abbreviations: FPG, fasting plasma glucose; TG, triglyceride; TC, total cholesterol; SBP, systolic blood pressure; DBP, diastolic blood pressure.
Table 5.
| Variable | FPG (mg/dL) | TG (mg/dL) | TC (mg/dL) | SBP (mmHg) | DBP (mmHg) |
|---|---|---|---|---|---|
| Age (y) | |||||
| < 45 | 113.38 ± 6.23 | 188.8 ± 117.87 | 195.09 ± 39.45 | 112.5 ± 14.65 | 72.16 ± 8.64 |
| ≥ 45 | 113.03 ± 7.08 | 177.89 ± 115.39 | 192.99 ± 41.35 | 115.75 ± 15.56 | 73.73 ± 8.90 |
| P-value | 0.7 | 0.50 | 0.71 | 0.13 | 0.2 |
| Educational level | |||||
| ≤ Diploma | 113.24 ± 6.88 | 181.69 ± 117.09 | 192.87 ± 40.82 | 115 ± 14.74 | 73.64 ± 8.65 |
| Academic degree | 112.27 ± 6.40 | 177.69 ± 108.98 | 199.92 ± 39.94 | 112.69 ± 19.71 | 70 ± 9.8 |
| P-value | 0.49 | 0.87 | 0.40 | 0.47 | 0.08 |
| Marital status | |||||
| Single | 113.26 ± 6.83 | 181.52 ± 116.79 | 193.25 ± 40.52 | 115 ± 15.39 | 73.33 ± 8.93 |
| Married | 108.33 ± 4.59 | 170.83 ± 87.90 | 208.67 ± 48.77 | 105 ± 8.37 | 70 ± 0.00 |
| P-value | 0.08 | 0.82 | 0.82 | 0.11 | < 0.001*** |
| Gender | |||||
| Male | 113.15 ± 6.73 | 191.84 ± 13.91 | 194.62 ± 36.61 | 115.67 ± 13.53 | 73.70 ± 8.42 |
| Female | 113.12 ± 6.93 | 170.84 ± 94.66 | 192.67 ± 41.89 | 113.84 ± 16.92 | 72.81 ± 9.24 |
| P-value | 0.97 | 0.16 | 0.71 | 0.36 | 0.44 |
Abbreviations: FPG, fasting plasma glucose; TG, triglyceride; TC, total cholesterol; SBP, systolic blood pressure; DBP, diastolic blood pressure.
a Values are expressed as means ± standard deviation.
b * Comparison between two variables.
5. Discussion
This population-based study was designed to evaluate anthropometric indices and biochemical parameters in a prediabetic population in Hoveyzeh in southwest Iran. This study was performed on 240 individuals aged 30 - 75 years, and the majority of the prediabetic population were housewives, married, and illiterate. The data obtained from this study showed abnormal anthropometric indices in the whole prediabetic population. The aforementioned results documented significant associations between HC and BMI with both genders. There was no statistical relationship between clinical and demographic variables except between DBP and marital status.
The prevalence of prediabetes and type 2 diabetes has been rising dramatically in Iran in recent years. It is estimated that type 2 diabetes incidence will reach approximately 9.2 million in the Iranian population by 2030 (8). Hyperglycemia has been associated with abnormal lipid metabolism, and improving glycemic status in hyperglycemia subjects is related to the enhancement of lipid profile and various complications (15).
The primary and rapid modifications in lifestyle in many societies have raised the prevalence of obesity, particularly abdominal obesity, and other risk factors (eg, high blood pressure), which have been documented to be the severe risk factors for the rising prevalence of prediabetes and type 2 diabetes (16). The lower abdominal obesity and higher physical activity make individuals, mainly urban populations, less likely to have prediabetes (17).
Some previous studies have reported that obesity and abdominal obesity indicators, such as BMI > 30 kg/m2, WC, and HC, may be independent predictors for prediabetes and type 2 diabetes mellitus (18-20). A meta-analysis of the published literature has suggested that the incidence of diabetes was associated with BMI and WC (21). Similar associations between abdominal obesity indicators and diabetes incidence were reported in an Iranian population (22). However, the current study demonstrated abnormal anthropometric indices in prediabetic individuals.
In the present study, prediabetic subjects were overweight and had abnormal FPG tests. According to some studies, prediabetes and type 2 diabetes mellitus are also associated with some of the Iranian population’s demographical factors. The association between prediabetes and education level was reported in an Iranian urban population. Low educational level was higher in prediabetic women than normal glycemic subjects (4). The data from a cross-sectional study conducted in the northeast of Iran, Khorasan province, showed that diabetes was not related to educational level and marital status (23). However, most prediabetic populations (age range: 30 - 75 years) were housewives, married, and illiterate in the present study.
The current study showed the effects of demographic variables on clinical parameters and anthropometric measures. A significant association was observed between marital status and DBP. A similar association was reported between gender with HC and BMI. The collected data in this study indicated that only 10.8% of adults with academic degrees suffer from prediabetics, demonstrating low educational levels and poor awareness among prediabetic individuals. In this study, inadequate awareness among prediabetic individuals may be a significant barrier to effective prevention and control of glycemic status. Therefore, a suitable educational program is proposed to inform these individuals.
5.1. Conclusions
The results of this study showed that abdominal obesity indicators, including increasing WC and BMI, are observed in prediabetic subjects, and there was no statistical relationship between other demographic and anthropometric variables. According to the obtained findings, most prediabetic individuals were illiterate; possibly, further awareness and educational programs may lead to adopting a healthy lifestyle associated with the management and control of prediabetic status. Therefore, it is recommended to implement educational programs in patients with prediabetes in future investigations.