
1. Background
Every year, cardiovascular diseases (CVDs) claim the lives of over 17 million people globally (1). This number is projected to increase to over 22 million annually by 2030 (2). An estimated 78% of CVD deaths occur in developing countries (3). According to the American Heart Association, in 2030, 1 out of every 3 Americans will be affected by CVDs. In Europe, out of 4,000,000 deaths per year, 2,000,000 will be related to CVDs (4). CVDs are one of the most critical health problems and the first cause of death in Iran (5), and lead to 50% of annual deaths and 79% of deaths caused by chronic diseases (6).
The development of different methods to diagnose and treat patients with CVDs has changed the lives of many patients. Affected patients, often with percutaneous coronary intervention, can return to partial normal activity with a low risk of cardiac events (7). Percutaneous coronary intervention is more cost-effective than coronary artery bypass grafting and reduces the patient’s hospitalization. It is also more suitable for elderly patients who cannot tolerate heavy and prolonged operations due to physical or clinical conditions (8). Several invasive and non-invasive methods are used to determine the severity and extent of coronary artery disease (CAD), but the gold standard for diagnosis remains angiography, and the transfemoral coronary angiography (TFA) method is more commonly used in some centers (9). Despite its many benefits, angiography has complications, including bleeding, hypotension, hematoma, severe pain when removing the arterial sheath, and even embolism in the lower parts of the catheter insertion site (10). This method can have side effects such as myocardial infarction, arrhythmia, and ecchymosis. These can increase the patient's risk of mortality and treatment costs and decrease their comfort (9, 11). The incidence of these complications has been estimated from 0.7 to 28% in different studies (12, 13).
One of the critical priorities in the care of patients undergoing angiography is paying attention to complications and trying to control and reduce them (14). In this regard, interventions and solutions such as sandbags, vascular closure devices, skin sutures of the femoral artery, and radial angiography have been recommended. However, these methods sometimes do not control all complications (15). In most cases, patients are kept in bed to prevent possible complications after angiography (16). This strategy is associated with patient discomfort, increased medical costs, and prolongation of the patient’s stay in the hospital, and patients suffer complications such as back pain due to immobility and often need painkillers for relief (17). On the other hand, slight bleeding may occur after the removal of femoral arterial sheaths, and sometimes, it is necessary to press the position for 10 to 20 minutes with a FemoStop device or hand to prevent bleeding (18). Also, hematoma caused by soft tissue bleeding around the sheath may cause local swelling and pain. Clot formation in the femoral artery may also cause a decrease in heart rate (HR), coldness or paleness, and sensory changes (19).
There is evidence that bleeding at the site of the sheath is more common in women. In people over 60, absolute rest and immobility of the foot are recommended to prevent this complication. Patients usually use a sandbag for 4 h - 6 h to keep the bandaged leg and to create pressure to prevent bleeding. Using a sandbag due to its weight and patients’ inability to bear it can cause discomfort and aggravate immobility and complications such as back and leg pain. Therefore, considering the complications of using sandbags, it has been recommended to conduct more studies on compression bandages compared to sandbags (20, 21). For instance, a study showed that the FemoSeal vascular closure device could reduce femoral compression time and access site complications after removing the catheter sheath (22). Another study showed that the FemoStop device effectively reduced femoral complications in patients following femoral sheath removal after coronary angioplasty and stent placement (23). Despite evidence showing the effectiveness of FemoStop in reducing complications after removing the sheet after TFA, this device has not been used in the clinical settings of Iran, and sandbags are still most commonly used to control complications. Considering the mentioned complications of sandbags and their importance, the research team designed and used a simple and non-invasive device with an air pressure mechanism called the FemoStop device to maintain hemostasis and control complications after TFA. Patients are expected to feel more comfortable using this device and be able to change their position in bed.
2. Objectives
This study aimed to design and determine the effect of using the FemoStop device on hemostasis during sheath removal and preventing complications after TFA in patients with CAD.
3. Methods
3.1. Design
This randomized controlled trial was conducted between 2019 and 2021 and was retrospectively registered in the Iranian Registry of Clinical Trial (No. IRCT20200410047011N2, Date: 2022/12/13).
3.2. Participants and Setting
Eighty patients with CAD undergoing TFA referred to a Heart and Vascular Hospital in Tehran, Iran, were recruited by convenience sampling and were assigned to the experimental and control groups by coin toss. The sample size was calculated based on a previous study (24), considering the type I error of 5% (α = 0.05) and the type II error of 20% (β = 0.2) using the G-Power software version 3.0.10, including the possibility of dropping out 20%, the study recruited 80 patients. A researcher assistant generated the random allocation sequence, enrolled patients, and assigned them to the intervention (n = 40) and control (n = 40) groups. Inclusion criteria included being alert, not suffering from hemophilia and coagulation disorders, age between 45 and 70, and being a candidate for TFA. The exclusion criteria were refusal to continue the study, complications such as abnormal bleeding, hematoma, and very severe pain during the intervention, and the use of painkillers or narcotics before, during, and after TFA. Patients in the experimental group used a FemoStop device, and patients in the control group used sandbags according to the hospital protocols.
3.3. The Intervention
In both experimental and control groups, after the angiography and during the patient’s recovery, the sheath was first removed by the nurse of the angiography department under complete monitoring. For 30 minutes, hemostasis was done by manual pressure. Then, the nurse laid gauze on the puncture site.
In the experimental group, a FemoStop device was used to maintain hemostasis and prevent bleeding and hematoma immediately after removing the femoral sheath. A trained nurse in the catheterization ward performed the hemostasis by manual pressure according to the protocols determined based on point pressure at the artery puncture site. The tourniquet was left in place for 4 h - 6 h and opened. All procedures were performed under the supervision of a physician.
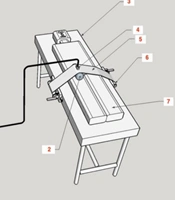
The FemoStop device is a disposable pressure device to maintain homeostasis at the puncture site following TFA. The research team designed and modeled this thigh strap using the trans-radial (TR) bandage device used in radial angiography. The FemoStop device includes 2 durable strips with a width of 3.5 and a total length of 100 cm and an air cushion placed at the puncture site of the femoral artery after coronary angiography. The maximum air capacity of the air cushion is 60 cc. The FemoStop device is tied around the patient’s thigh and waist in the form of a figure 8 and fixed with a buckle that can be shortened and lengthened. The one-meter-long FemoStop device can be stretched up to 2 m due to its elasticity and can be adjusted according to the height and weight of the patient (Figure 1). The FemoStop device can also be washed and sterilized for reuse.
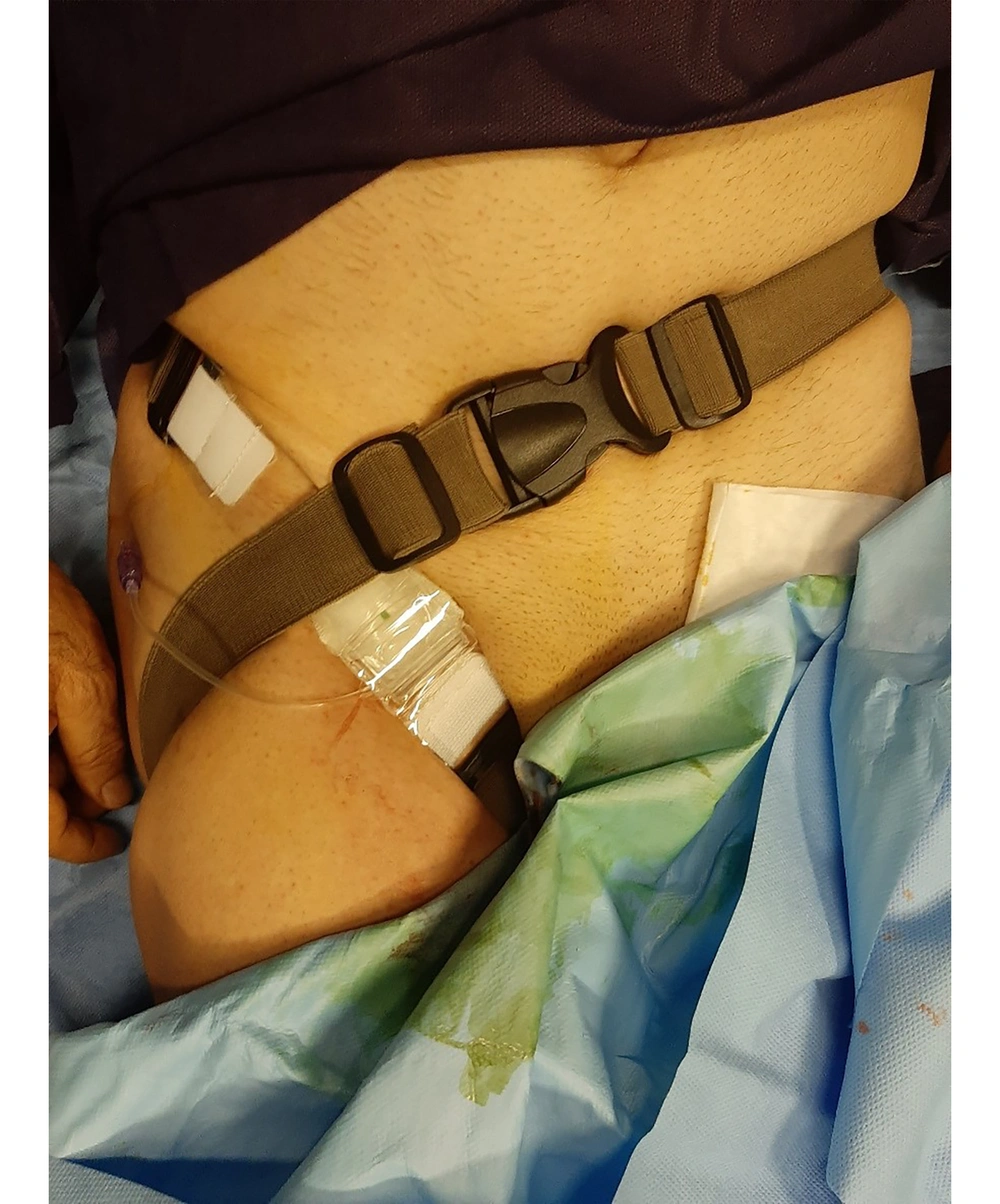
Figure 1.
Femostop at the femoral puncture site
Trans-radial bandage, which was used in the middle part of the FemoStop device and as the main part, was registered by Faraz Tab Jam Gostar Company on 10/12/2011 under the trade number 41138931518 and registration number 10320714987.420250 and has a Ministry of Health and Medical Education license. This device has a transparent plastic inflatable cushion connected to elastic bands, which was decided to be placed on the puncture site of the femoral artery after coronary angiography.
The air pressure of the thigh airbag was determined based on blood pressure and anatomical conditions by the patent and hemostasis method. In this method, the air cushion was filled with a special syringe of 30 mL of air, and then the air was slowly deflated until it reached the point of blood exit from the puncture sheath. Then, the air evacuation was immediately stopped, and 3 mL of air was inflated into the cushion. Patients were allowed to gently bend and straighten their knees in bed, turn slowly to the right and left, or sit and semi-sit during the first 2 h after the inflatable thigh strap was closed.
Then, the patients could slowly get out of bed and walk gently in the ward with full caution and in the presence of a physician and one of the researchers. If the patients experienced increasing discomfort and pain in the groin area after using the FemoStop device, the routine methods would immediately replace the use of the FemoStop device, and the patient would be excluded from the study. Also, to follow up on unwanted side effects after the intervention and discharge of the patient, including the occurrence of infection, ecchymosis, groin pain, and paresthesia of the patient's limbs 1 month after discharge, the patients in the experimental group were advised to visit a physician. In addition, the patient’s health status was recorded over the phone or in person for 1 month.
According to the hospital routine, a sandbag was used in the control group instead of the FemoStop device. The sandbag’s weight was 2.5 kg, and it was placed in the puncture site of the femoral artery for 6 h. Patients in the control group had to keep their legs straight in all stages. A pillow was placed under their back when the patients were in a semi-sitting position. In case of bleeding, the patient was placed in a supine position, and 5 cm above the dressing site was pressed manually to control the bleeding in the following hours, but the patient’s position was not changed.
All patients in the experimental and control groups received prophylactic anticoagulants such as aspirin 80 mg and Plavix 300 mg single dose at least 2 h before the angiography or during admission to the ward for angiography as ordered by the physician. One of the researchers with an MSc in emergency nursing with 19 years of experience in medical-surgical wards, critical care units, and intensive care units performed most interventions in the experimental group. Also, 3 trained nurses collaborated in care and recorded observations after the intervention in the critical care units. Figure 2 shows the study process.
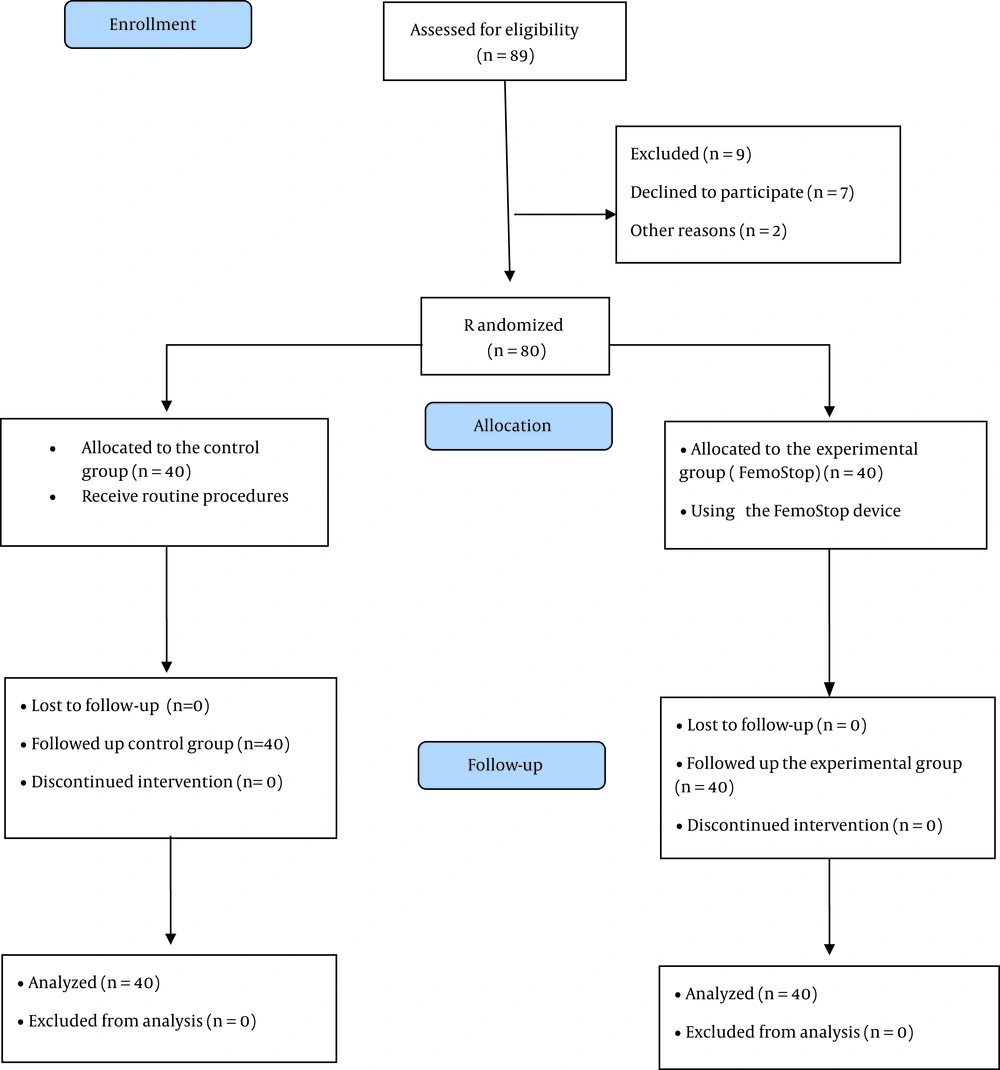
Figure 2.
The study process
3.4. Measurements
Three trained and experienced nurses as researcher’s assistants using a chart (before and immediately after closing the FemoStop device, 15 minutes, 1 h, 2 h, 2.5 h, 3h, 3.5 h, 4 h, 4.5 h, 5 h, and 6 hours after closing the FemoStop device, totally of 12 times) recorded and reported all possible complications.
The data collection tool included the individual characteristics questionnaire (gender, age, marital status, education, occupation, history of using sandbags, and history of angiography), the visual analog scale for measuring pain intensity, and the Christensen scale for hematoma size, the number of blood gases to determine the bleeding volume, laboratory indicators (such as prothrombin time (PT), partial thromboplastin time (PTT), international normalized ratio (INR), and hemodynamics of the patients (systolic blood pressure (SBP), diastolic blood pressure (DBP), temperature, respiratory rate (RR), HR, and arterial oxygen saturation (SaO2).
To measure the pain severity, the VAS was used. This scale includes a continuous line with two end-points (0 and 10), and respondents specify their level of agreement with a statement by indicating a position. A score of ten indicated the most severe pain and a zero indicated no pain. The visual pain measurement tool is the most widely used globally, and its validity and reliability have been confirmed (25). Christensen’s scale was used to measure the size of the hematoma, in which a small hematoma was considered between 2 and 5 cm2, a large hematoma was equal to or more than 5 cm2, and a very large hematoma was equal to or more than 10 cm2. In a hematoma with an irregular shape, the largest and smallest diameters of the hematoma were measured, and the area of the hematoma was calculated by multiplying the diameters. Previous studies have confirmed its validity and reliability (1, 21). The amount of blood loss was calculated based on the number of gases soaked in blood. Each 4 × 4 blood-soaked gauze contains approximately 10 ml of blood (1, 26). Then, the bleeding volume was calculated by multiplying the number of gases collected by 10. The patients’ laboratory measurements (PT, PTT, and INR) and hemodynamics (SBP, DBP, temperature, RR, HR, and SaO2) were also checked and recorded.
The data were analyzed with SPSS software and using descriptive (mean, standard deviation (SD), frequency, and percentage) and analytical tests (including Fisher’s exact test, chi-square, independent t-test, and repeated measures-ANOVA (RM-ANOVA). The Kolmogorov-Smirnov test was used to check the normality of the data. A significance level of P < 0.05 was considered. The statistical analyst was blinded to group allocation.
4. Results
4.1. Characteristics of Patients
The mean age of the patients was 63.98 ± 10.15 (40-86 years), and most (41.3%) were between 61 and 70. Among them, 52.5% were male, 86.3% were married, 38.8% had undergraduate education, and most (42.5%) were housewives. Sixty percent had a history of angiography. Two groups in terms of age (P = 0.585), gender (P = 0.823), marital status (P = 0.193), education level (P = 0.456), occupation (P = 0.772), PT (P = 0.377), PTT (P = 0.091), INR (P = 0.079) and history of angiography (P = 0.710) had no statistically significant differences (Table 1).
Table 1.
Individual Characteristics of Patients
| Variables | Experimental | Control | Statistic Value | P-Value | df |
|---|---|---|---|---|---|
| Age, y | 63.35 ± 9.54 | 60.64 ± 10.82 | t = -0.552* | 0.585 | 78 |
| PT | 12.78 ± 1.17 | 12.96 ± 0.50 | t = 0.890* | 0.377 | 53.088 |
| PTT | 33.95 ± 89.2 | 32.50 ± 4.49 | t = -1.713* | 0.091 | 66.632 |
| INR | 1.19 ± 0.15 | 1.13 ± 0.13 | t = -1.785* | 0.079 | 63.600 |
| Gender | ** | 0.823 | 1 | ||
| Male | 20 (0.50) | 22 (0.55) | |||
| Female | 20 (0.50) | 18 (0.45) | |||
| Marital status | ** | 0.193 | 1 | ||
| Single/widow | 3 (5.7) | 8 (0.20) | |||
| Married | 37 (5.92) | 32 (0.80) | |||
| Education level | χ2 = 1.571*** | 0.456 | 2 | ||
| High school | 13 (5.32) | 18 (0.45) | |||
| Diploma | 13 (5.32) | 9 (5.22) | |||
| Academic education | 14 (0.35) | 13 (5.32) | |||
| History of angiography | ** | 0.110 | 1 | ||
| Yes | 20 (0.50) | 12 (0.30) | |||
| No | 20 (0.50) | 28 (0.70) | |||
| Occupation | χ2 = 1.518*** | 0.772 | 2 | ||
| Housewife | 18 (0.45) | 16 (0.40) | |||
| Retired | 18 (0.45) | 18 (0.45) | |||
| Employed | 4 (0.10) | 6 (0.15) |
Abbreviations: df, degree of freedom; PT, prothrombin time; PTT, partial thromboplastin time; INR, international normalized ratio.
a Values are expressed as mean ± SD or No. (%). *Independent t-test, **Fisher’s exact test, ***Chi-square test
4.2. Primary Outcomes
Independent t-tests showed that patients' pain intensity, HR, RR, temperature, SBP, DBP, and SaO2 in the experimental and control groups were not significantly different before the intervention (P > 0.05). However, immediately after the intervention, the SaO2 level of the patients in the experimental group was higher than the control group (P = 0.031).
Fifteen minutes after using the FemoStop, the pain intensity (P = 0.004) and HR (P = 0.036) of the experimental group patients were lower than the control group, and the SaO2 level of the experimental group patients was higher than the control group (P = 0.004).
Thirty minutes after the intervention, pain intensity (P < 0.001), HR (P = 0.032), SBP (P = 0.025), and DBP (P = 0.030) of patients in the experimental group were lower than those in the control group, and the SaO2 level of the experimental group patients was higher than the control group (P = 0.004).
One hour after using the FemoStop, pain intensity (P = 0.027), SBP (P = 0.025), and DBP (P = 0.030) of patients in the experimental group were lower than in the control group.
Two hours (P = 0.019) and 2.5 h (P = 0.042) after the intervention, the pain intensity of the experimental group patients was lower than the control group.
Three and a half hours after the intervention, the experimental group patients' HR (P = 0.011) and RR (P = 0.050) were lower than the control group.
While 3 h, 4 h, 5 h, and 6 h after the intervention, there was no significant difference between pain intensity, HR, RR, temperature, SBP, DBP, and SaO2 of the 2 groups of patients (P > 0.05) (Table 2).
Table 2.
Comparison of the Mean Scores of Pain, HR, RR, Temperature, SBP, DBP, and SaO2 of Patients in the Experimental and Control Groups at the 12 Stages a
| Variables | Pain | HR (BPM) | RR (bpm) | Temperature (°C) | SBP (mmHg) | DBP (mm Hg) | SaO2 (%) |
|---|---|---|---|---|---|---|---|
| Pre-test | |||||||
| Experimental | 6.83 ± 1.23 | 69.55 ± 11.70 | 16.72 ± 1.48 | 36.84 ± 0.23 | 131.60 ± 16.11 | 77.30 ± 6.89 | 94.87 ± 14.13 |
| Control | 6.7 ± 0.93 | 71.27 ± 13.42 | 16.75 ± 1.48 | 36.91 ± 0.22 | 128.5 ± 15.72 | 74.60 ± 8.76 | 96.77 ± 1.02 |
| Independent t-test | |||||||
| t | -0.509 | 0.613 | 0.075 | 1.406 | -0.871 | 1.532 | 0.848 |
| df | 78 | 78 | 78 | 78 | 78 | 73.918 | 78 |
| P-value | 0.612 | 0.542 | 0.940 | 0.164 | 0.386 | 0.130 | 0.399 |
| Immediately after tying the FemoStop | |||||||
| Experimental | 5.9 ± 1.17 | 68.7 ± 13.26 | 16.62 ± 1.42 | 36.89 ± 0.19 | 124.15 ± 12.79 | 73.45 ± 6.77 | 97.1 ± 0.98 |
| Control | 6.40 ± 1.12 | 71.1 ± 14.9 | 16.97 ± 1.73 | 36.93 ± 0.22 | 128.7 ± 11.41 | 76.17 ± 7.23 | 96.6 ± 1.05 |
| Independent t-test | |||||||
| t | 1.944 | 0.761 | 0.987 | 0.754 | 1.678 | 1.739 | 2.192 |
| df | 78 | 78 | 78 | 78 | 78 | 78 | 78 |
| P-value | 0.056 | 0.449 | 0.327 | 0.453 | 0.097 | 0.086 | 0.031 |
| 15 minutes after tying the FemoStop | |||||||
| Experimental | 5.33 ± 0.97 | 68.40 ± 12.22 | 16.62 ± 1.42 | 36.89 ± 0.19 | 124.15 ± 12.79 | 73.45 ± 6.77 | 97.36 ± 0.96 |
| Control | 6.05 ± 1.21 | 74.85 ± 14.65 | 16.97 ± 1.73 | 36.93 ± 0.22 | 128.7 ± 11.41 | 76.17 ± 7.23 | 96.65 ± 0.97 |
| Independent t-test | |||||||
| t | 2.943 | 2.137 | 0.987 | 0.754 | 1.678 | 1.739 | -2.995 |
| df | 78 | 78 | 78 | 78 | 78 | 78 | 78 |
| P-value | 0.004 | 0.036 | 0.327 | 0.453 | 0.097 | 0.086 | 0.004 |
| 30 minutes after tying the FemoStop | |||||||
| Experimental | 2.88 ± 1.22 | 68.2 ± 12.19 | 16.52 ± 1.24 | 36.89 ± 0.19 | 122.62 ± 12.29 | 72.8 ± 6.39 | 97.3 ± 0.96 |
| Control | 4.05 ± 1.43 | 74.72 ± 14.37 | 16.97 ± 1.73 | 36.93 ± 0.22 | 128.7 ± 11.41 | 76.17 ± 7.23 | 96.65 ± 0.97 |
| Independent t-test | |||||||
| t | 3.947 | 2.190 | 1.336 | 0.754 | 2.290 | 2.210 | 2.995 |
| df | 76.155 | 78 | 70.677 | 78 | 78 | 78 | 78 |
| P-value | <0.001 | 0.032 | 0.186 | 0.453 | 0.025 | 0.030 | 0.004 |
| 1 hour after tying the FemoStop | |||||||
| Experimental | 3.08 ± 0.88 | 69 ± 11.67 | 16.52 ± 1.24 | 36.89 ± 0.19 | 122.62 ± 12.29 | 72.8 ± 6.39 | 97.30 ± 0.96 |
| Control | 3.6 ± 1.17 | 73.9 ± 12.99 | 16.97 ± 1.73 | 36.93 ± 0.22 | 128.7 ± 11.41 | 76.17 ± 7.23 | 97 ± 0.75 |
| Independent t-test | |||||||
| t | 2.257 | 1.774 | 1.336 | 0.754 | 2.290 | 2.210 | -1.551 |
| df | 72.681 | 78 | 70.667 | 78 | 78 | 78 | 73.529 |
| P-value | 0.027 | 0.080 | 0.186 | 0.453 | 0.025 | 0.030 | 0.125 |
| 2 hours after tying the FemoStop | |||||||
| Experimental | 2.43 ± 0.63 | 69 ± 11.67 | 16.52 ± 1.24 | 36.89 ± 0.19 | 122.62 ± 12.29 | 72.8 ± 6.39 | 97.30 ± 0.96 |
| Control | 2.85 ± 0.92 | 73.9 ± 12.99 | 16.97 ± 1.73 | 36.93 ± 0.22 | 126.8 ± 9.5 | 75.67 ± 7.12 | 97.07 ± 0.72 |
| Independent t-test | |||||||
| t | 2.401 | 1.774 | 1.336 | 0.754 | 1.699 | 1.899 | -1.175 |
| df | 69.293 | 78 | 70.667 | 78 | 78 | 78 | 72.579 |
| P-value | 0.019 | 0.080 | 0.186 | 0.453 | 0.093 | 0.061 | 0.244 |
| 2 and a half hours after tying the FemoStop | |||||||
| Experimental | 2.38 ± 0.62 | 69 ± 11.67 | 16.52 ± 1.24 | 36.89 ± 0.19 | 122.2 ± 11.89 | 72.8 ± 6.39 | 97.35 ± 0.94 |
| Control | 2.75 ± 0.95 | 73.9 ± 12.99 | 16.97 ± 1.73 | 36.93 ± 0.22 | 126.55 ± 9 | 75.67 ± 7.12 | 97.12 ± 0.72 |
| Independent t-test | |||||||
| t | 2.077 | 1.774 | 1.336 | 0.754 | 1.845 | 1.899 | -1.193 |
| df | 67.446 | 78 | 70.667 | 78 | 78 | 78 | 72.866 |
| P-value | 0.042 | 0.080 | 0.186 | 0.453 | 0.069 | 0.061 | 0.237 |
| 3 hours after tying the FemoStop | |||||||
| Experimental | 2.28 ± 0.64 | 69 ± 11.67 | 16.52 ± 1.24 | 36.89 ± 0.19 | 122.2 ± 11.89 | 72.9 ± 6.35 | 97.35 ± 0.94 |
| Control | 2.48 ± 1.08 | 73.85 ± 12.98 | 16.87 ± 1.66 | 36.92 ± 0.22 | 126.05 ± 8.76 | 74.95 ± 6.46 | 97.15 ± 0.69 |
| Independent t-test | |||||||
| t | 1.004 | 1.757 | 1.065 | 0.703 | 1.648 | 1.430 | 1.073 |
| df | 63.183 | 78 | 78 | 78 | 78 | 78 | 71.748 |
| P-value | 0.319 | 0.083 | 0.290 | 0.484 | 0.103 | 0.157 | 0.287 |
| 3 and a half hours after tying the FemoStop | |||||||
| Experimental | 2.18 ± 0.5 | 67.4 ± 7.96 | 16.27 ± 0.9 | 36.9 ± 0.18 | 122.45 ± 11.45 | 72.92 ± 6.4 | 97.32 ± 0.91 |
| Control | 2.4 ± 1.03 | 73.6 ± 12.76 | 16.87 ± 1.66 | 36.92 ± 0.22 | 125.85 ± 8.66 | 74.47 ± 6.3 | 97.15 ± 0.66 |
| Independent t-test | |||||||
| t | 1.240 | 2.607 | 2.000 | 0.442 | 1.497 | 1.091 | 0.979 |
| df | 56.369 | 376.65 | 60.170 | 78 | 78 | 78 | 70.988 |
| P-value | 0.220 | 0.011 | 0.050 | 0.659 | 0.139 | 0.279 | 0.331 |
| 4 hours after tying the FemoStop | |||||||
| Experimental | 2 ± 0.55 | 70.15 ± 12.62 | 16.52 ± 1.24 | 36.9 ± 0.18 | 122 ± 11.9 | 72.97 ± 6.81 | 97.37 ± 0.95 |
| Control | 2.28 ± 0.9 | 74.55 ± 13.14 | 16.87 ± 1.6 | 36.92 ± 0.22 | 125.45 ± 8.73 | 74.55 ± 6.7 | 97.30 ± 0.6 |
| Independent t-test | |||||||
| t | 1.638 | 1.527 | 1.092 | 0.386 | 1.478 | 1.042 | -0.420 |
| df | 64.659 | 78 | 78 | 78 | 78 | 78 | 66.238 |
| P-value | 0.106 | 0.131 | 0.278 | 0.700 | 0.143 | 0.301 | 0.676 |
| 5 hours after tying the FemoStop | |||||||
| Experimental | 2.13 ± 0.56 | 70.15 ± 12.62 | 16.52 ± 1.24 | 36.9 ± 0.18 | 122 ± 11.9 | 72.97 ± 6.81 | 97.37 ± 0.95 |
| Control | 2.23 ± 0.89 | 74.55 ± 13.14 | 16.87 ± 1.6 | 36.92 ± 0.22 | 125.45 ± 8.73 | 74.55 ± 6.7 | 97.3 ± 0.6 |
| Independent t-test | |||||||
| t | 0.600 | 1.527 | 1.092 | 0.386 | 1.478 | 1.042 | -0.420 |
| df | 65.873 | 78 | 78 | 78 | 78 | 78 | 66.238 |
| P-value | 0.551 | 0.131 | 0.278 | 0.700 | 0.143 | 0.301 | 0.676 |
| 6 hours after tying the FemoStop | |||||||
| Experimental | 2 ± 0.64 | 70.15 ± 12.62 | 16.52 ± 1.24 | 36.9 ± 0.18 | 122 ± 11.9 | 72.97 ± 6.81 | 97.37 ± 0.95 |
| Control | 2 ± 0.71 | 74.55 ± 13.14 | 16.87 ± 1.6 | 36.92 ± 0.22 | 125.45 ± 8.73 | 74.55 ± 6.7 | 97.3 ± 0.6 |
| Independent t-test | |||||||
| t | 0 | 1.527 | 1.092 | 0.386 | 1.478 | 1.042 | -0.420 |
| df | 78 | 78 | 78 | 78 | 78 | 78 | 66.238 |
| P-value | 1 | 0.131 | 0.278 | 0.700 | 0.143 | 0.301 | 0.676 |
Abbreviations: df, degree of freedom; HR, heart rate; BPM, beats per minute; RR, respiratory rate; bpm, breaths per minute; ºC, degrees Celsius; SBP, systolic blood pressure; DBP, diastolic blood pressure; mmHg, millimeter of mercury; SaO2, arterial oxygen saturation.
a Values are expressed as mean ± SD.
Fisher’s exact test showed that the experimental and control groups in terms of bleeding and hematoma in the pre-test stages, immediately, 15 minutes, 30 minutes, 1 h, 2 h, 2.5 h, 3 h, 3.5 h, 4 h, 4.5 h, 5 h, and 6 h after tying the FemoStop had no significant differences (P > 0.05) (Table 3).
Table 3.
Comparison of the Bleeding of Patients in the Experimental and Control Groups at 12 Stages a
| Stage and Bleeding Volume (CC) | Experimental | Control | Fisher’s Exact Test, P-Value |
|---|---|---|---|
| Bleeding | |||
| Before tying the FemoStop | 0.712 | ||
| 0 | 37 (92.5) | 35 (87.5) | |
| 10 | 3 (7.5) | 5 (12.5) | |
| Immediately after tying the FemoStop | 0.066 | ||
| 0 | 37 (92.5) | 30 (75) | |
| 10 | 3 (7.5) | 10 (25) | |
| 15 minutes after tying the FemoStop | 0.087 | ||
| 0 | 38 (95) | 32 (80) | |
| 10 | 2 (5) | 8 (20) | |
| 30 minutes after tying the FemoStop | 0.359 | ||
| 0 | 39 (97.5) | 36 (90) | |
| 10 | 1 (2.5) | 4 (10) | |
| 1 hour after tying the FemoStop | 0.108 | ||
| 0 | 39 (97.5) | 34 (85) | |
| 10 | 1 (2.5) | 6 (15) | |
| 2 hours after tying the FemoStop | 0.201 | ||
| 0 | 39 (97.5) | 35 (87.5) | |
| 10 | 1 (2.5) | 5 (12.5) | |
| 2 and a half hours after tying the FemoStop | 0.494 | ||
| 0 | 40 (100) | 38 (95) | |
| 10 | 2 (5) | 0 (0) | |
| 3 hours after tying the FemoStop | 1.000 | ||
| 0 | 40 (100) | 39 (97.5) | |
| 10 | 0 (0) | 1 (2.5) | |
| 3 and a half hours after tying the FemoStop | 0.359 | ||
| 0 | 39 (97.5) | 36 (90) | |
| 10 | 1 (2.5) | 4 (10) | |
| 4 hours after tying the FemoStop | 0.116 | ||
| 0 | 40 (100) | 36 (90) | |
| 10 | 4 (10) | 0 (0) | |
| 5 hours after tying the FemoStop | 0.241 | ||
| 0 | 40 (100) | 37 (92.5) | |
| 10 | 0 (0) | 3 (7.5) | |
| 6 hours after tying the FemoStop | 0.241 | ||
| 0 | 40 (100) | 37 (92.5) | |
| 10 | 0 (0) | 3 (7.5) | |
a Values are expressed as No. (%).
RM-ANOVA test showed that pain intensity (P < 0.001) (Figure 3), HR (P = 0.036) (Figure 4), and SBP (P < 0.001) (Figure 5) patients in the experimental and control groups had a significant change during the study. However, the RR (P = 0.308) (Figure 6), DBP (P = 0.089) (Figure 7), SaO2 (P = 0.205) (Figure 8), and temperature (P = 0.195) (Figure 9) showed no significant changes among the 2 groups.
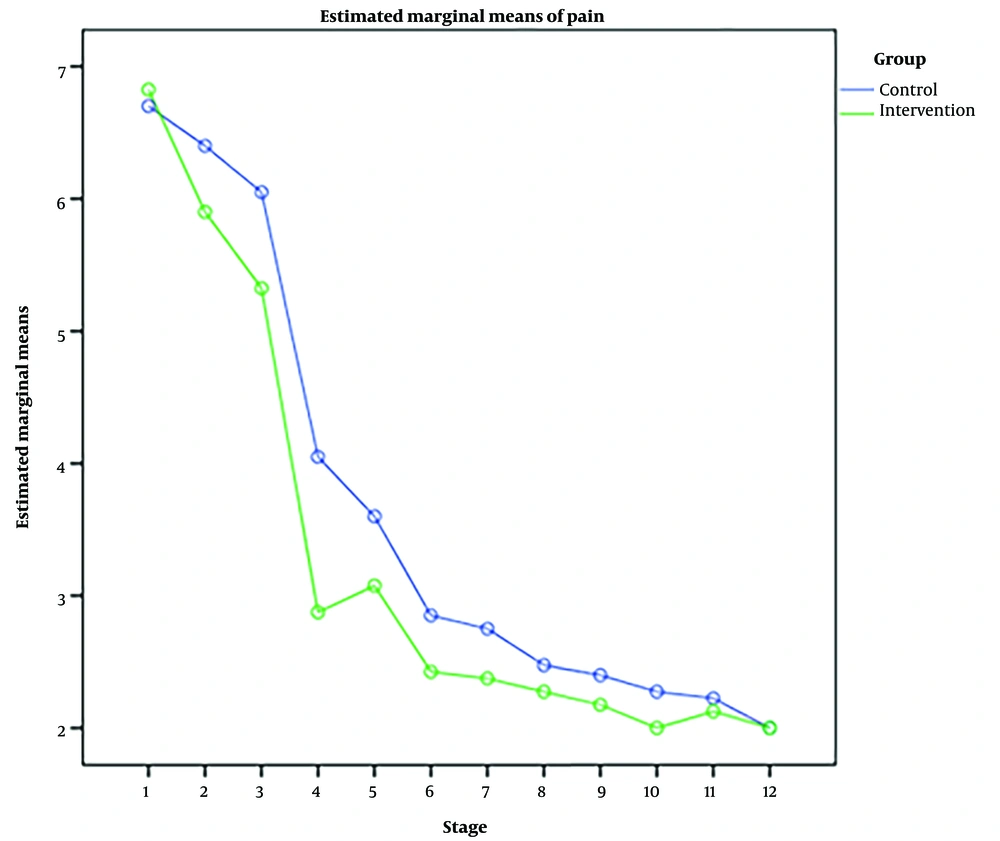
Figure 3.
Changes in pain intensity in the experimental and control groups
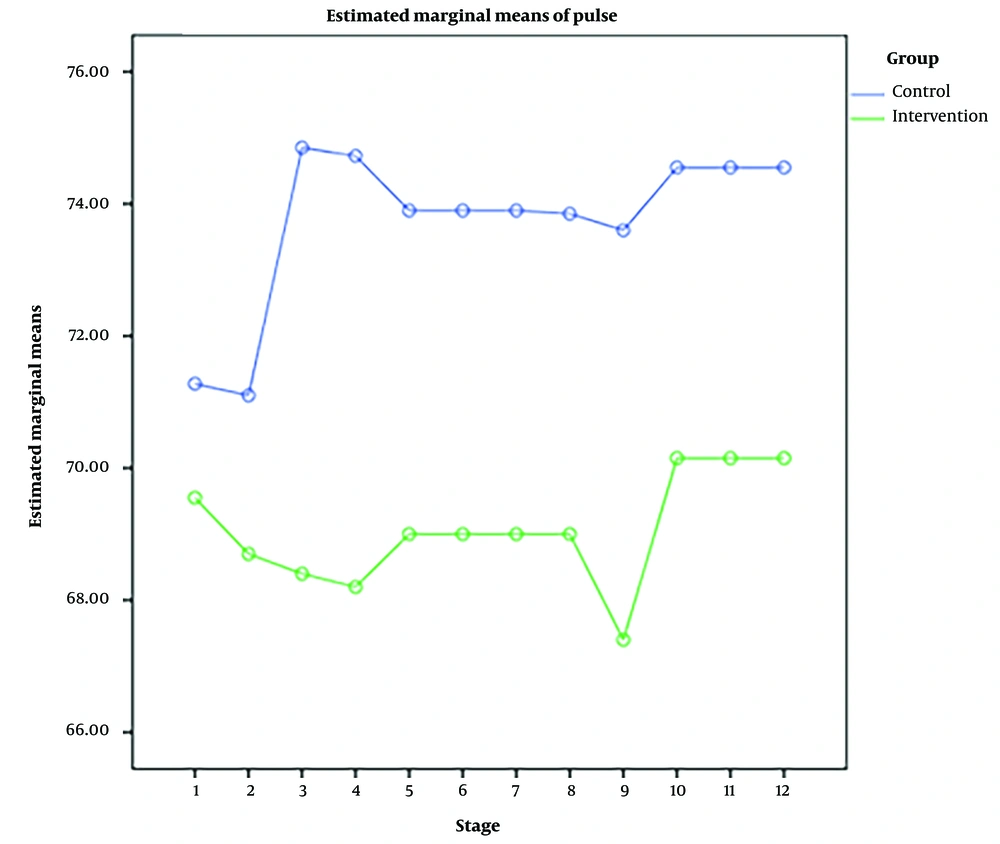
Figure 4.
Heart rate changes in the experimental and control groups
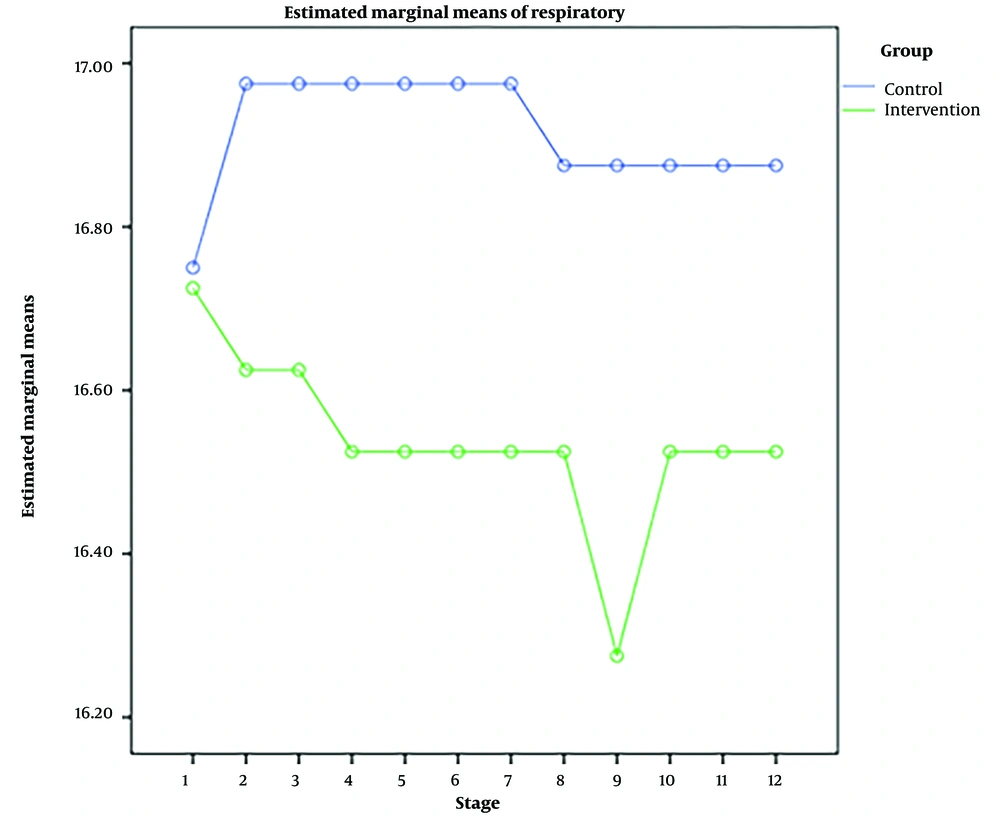
Figure 5.
Respiratory rate changes in the experimental and control groups
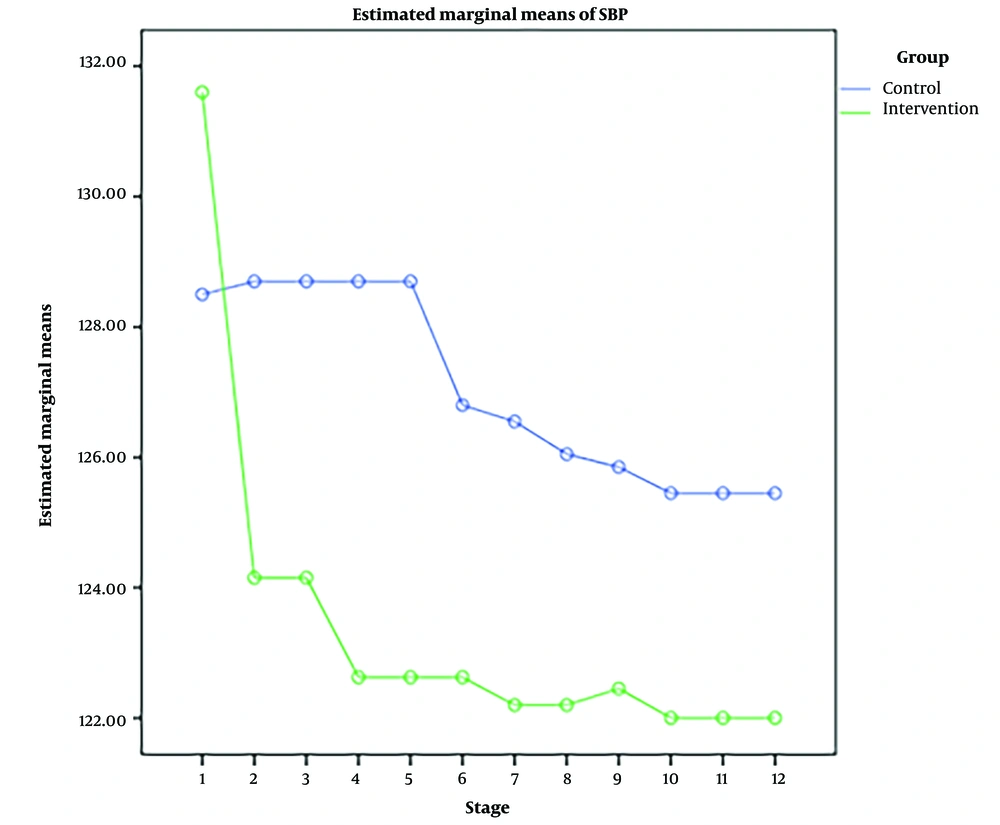
Figure 6.
Systolic blood pressure changes in the experimental and control groups
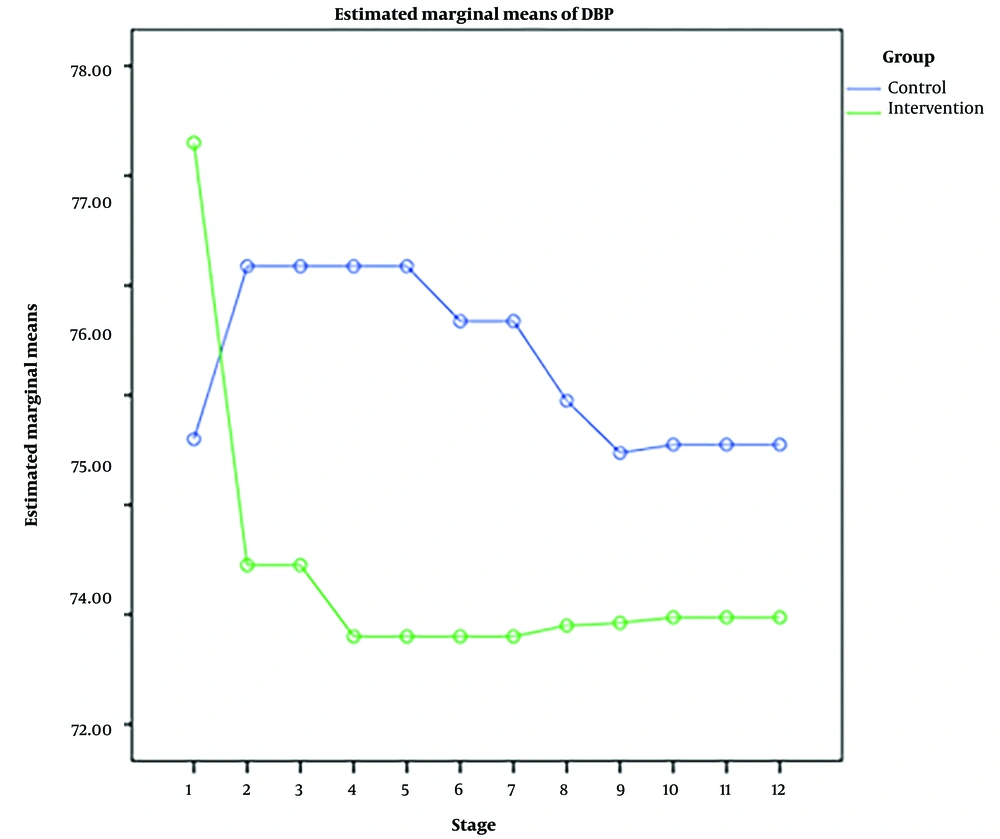
Figure 7.
Diastolic blood pressure changes in the experimental and control groups
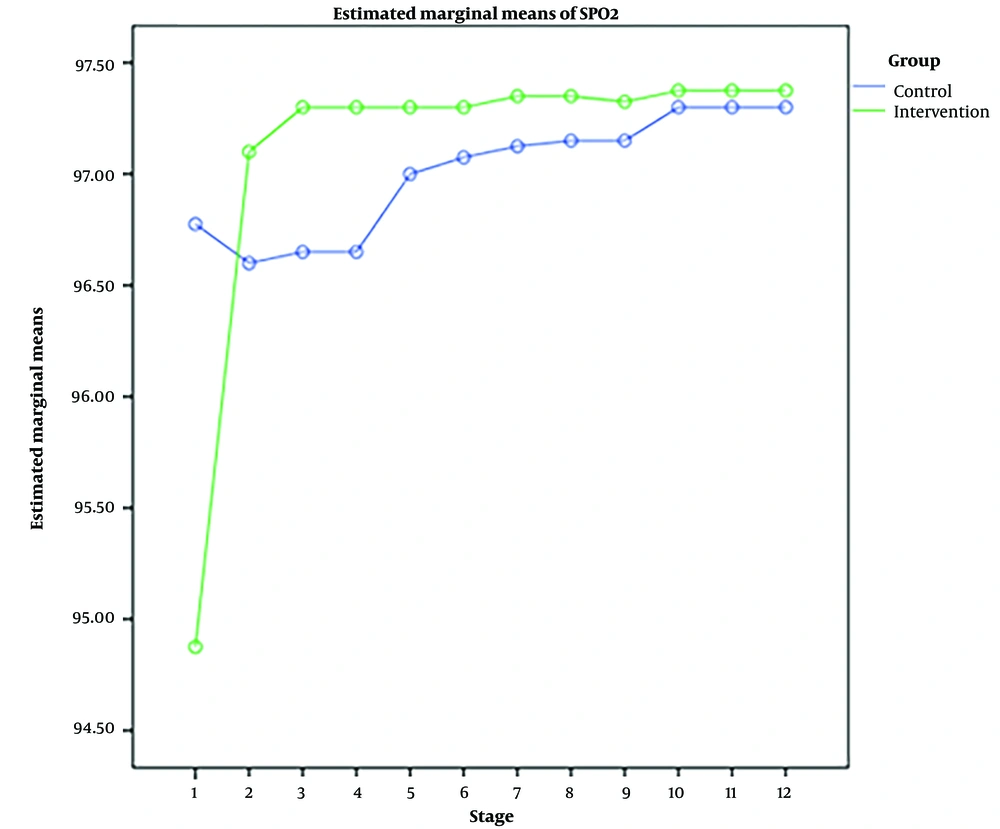
Figure 8.
Arterial oxygen saturation changes in the experimental and control groups
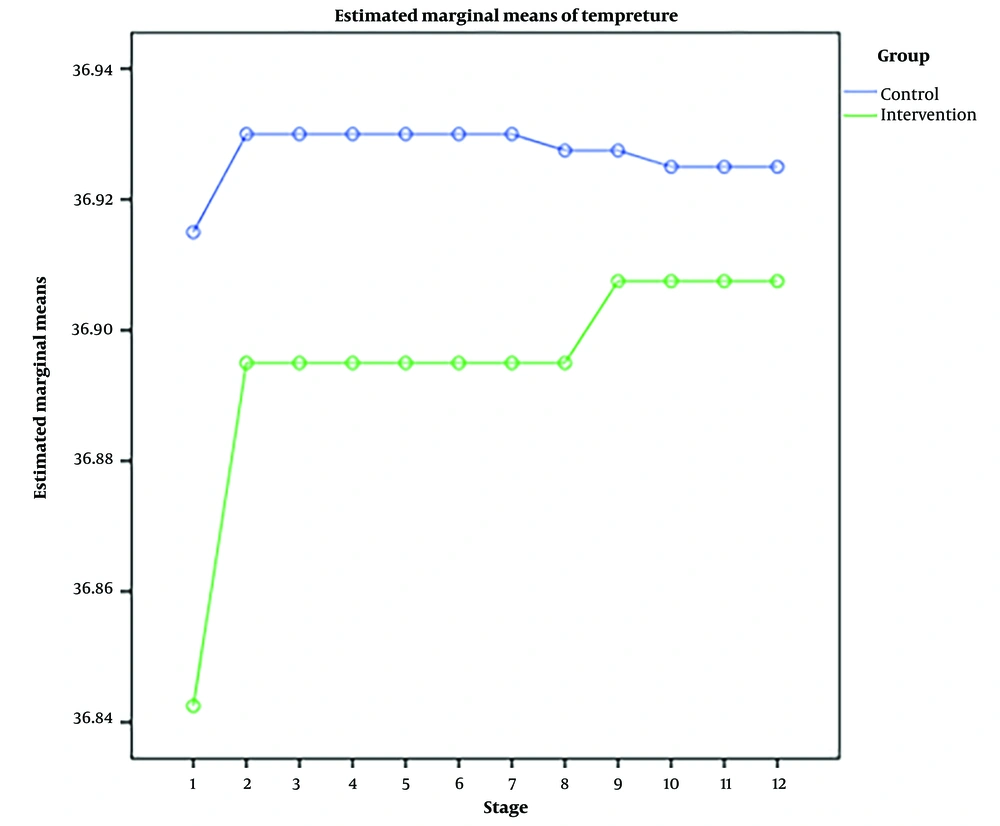
Figure 9.
Temperature changes in the experimental and control groups
Also, the RM-ANOVA test showed that the pain intensity (P < 0.001), SBP (P < 0.001), and DBP (P = 0.004) patients in the experimental group patients decreased significantly during the study process. However, HR (P = 0.2), RR (P = 0.095), SaO2 (P = 0.284), and temperature (P = 0.220) did not change significantly.
As well as the patient’s pain intensity (P < 0.001), SBP (P = 0.04), HR (P = 0.024), and SaO2 (P = 0.001) in the control group decreased significantly during the study process. However, there were no significant changes in the RR (P = 0.466), DBP (P = 0.272), and temperature (P = 0.585) in the patients (Table 4).
Table 4.
Changes in Pain Intensity, HR, RR, Temperature, SBP, DBP, and SaO2 in the Experimental and Control Groups at the 12 Stages
| Variables and Comparison | F a | df | P-Value |
|---|---|---|---|
| Intensity of pain | |||
| Between groups | 374.523 | 4.22 | <0.001 |
| Within the experimental group | 193.546 | 4.091 | <0.001 |
| Within the control group | 185.180 | 3.965 | <0.001 |
| HR, BPM | |||
| Between groups | 2.822 | 3.233 | 0.036 |
| Within the experimental group | 1.536 | 3.121 | 0.200 |
| Within the control group | 3.763 | 2.174 | 0.024 |
| RR, bpm | |||
| Between groups | 1.207 | 2.903 | 0.308 |
| Within the experimental group | 2.087 | 3.482 | 0.095 |
| Within the control group | 0.799 | 2.239 | 0.466 |
| SBP, mmHg | |||
| Between groups | 11.088 | 2.190 | <0.001 |
| Within the experimental group | 13.405 | 1.665 | <0.001 |
| Within the control group | 3.244 | 2.214 | 0.04 |
| DBP, mmHg | |||
| Between groups | 2.483 | 1.932 | 0.089 |
| Within the experimental group | 6.369 | 1.849 | 0.004 |
| Within the control group | 1.324 | 1.941 | 0.272 |
| SaO2 | |||
| Between groups | 1.633 | 1.034 | 0.205 |
| Within the experimental group | 1.182 | 1.007 | 0.284 |
| Within the control group | 9.370 | 2.816 | 0.001 |
| Temperatures, ºC | |||
| Between groups | 1.689 | 1.489 | 0.195 |
| Within the experimental group | 1.559 | 1.601 | 0.220 |
| Within the control group | 0.338 | 1.102 | 0.585 |
Abbreviations: df, degrees of freedom; HR, heart rate; BPM, beats per minute; RR, respiratory rate; bpm, breaths per minute; ºC, degrees celsius; SBP, systolic blood pressure; DBP, diastolic blood pressure; mmHg, millimeter of mercury; SaO2, arterial oxygen saturation.
a Greenhouse-Geisser
5. Discussion
This study aimed to design and manufacture a FemoStop device and compare its effectiveness with sandbag pressure on hemostasis during sheath removal and reducing puncture site complications following TFA. The findings showed that the mean pain intensity scores, HR, RR, temperature, SBP, DBP, and the SaO2 of the experimental and control groups before the intervention were hemogenic.
The FemoStop patients experienced less pain intensity than the control group, and hematoma and bleeding did not differ between the 2 groups. The results of some similar studies are, to some extent, consistent with the present study. For example, Hassan et al. showed that a locally designed femoral compression device was a simple, safe, and effective alternative to manual compression for hemostasis following diagnostic TFA (27). Kim et al. demonstrated that a pneumatic compression device was effective and safe for the hemostasis of femoral catheterization. They observed that 4 h of bed rest was sufficient for hemostasis (28). Ghods et al. compared the efficacy of sandbags and air cushions on complications after coronary angioplasty. They demonstrated that using air cushions at the catheter sheath site did not change the incidence of hematoma and bleeding and significantly reduced the severity of back pain, patient discomfort, and the need for painkillers. Also, changing the patients’ position in the bed after removing the catheter sheath increased the patient’s comfort (21). Yasrebirad et al. showed that using compression bandages increased patients’ comfort after coronary angiography. They also reported that compression bandages resulted in better bleeding control than sandbags (29). Also, Yasrebirad et al. found that bleeding was significantly more severe at 4 h and 6 h after coronary angiography in patients who used sandbags than those who used compression bandages. Also, the proportion of patients who did not complain of pain was higher in the pressure bandage group than in the sandbag group (30). Kor et al. showed that reducing the weight of a sandbag without increasing vascular complications reduced back pain and improved patients’ comfort after femoral artery catheterization (31).
Generally, a review of various studies demonstrates that complications after sheath removal after angiography have been a focus of research, and several methods have been investigated to manage these complications. Physiologically, applying pressure can effectively reduce bleeding. Still, the effectiveness, the role of applying pressure in controlling or developing other complications, and its cost-effectiveness should also be considered.
Holm et al. showed that the FemoSeal, compared to manual pressure, significantly reduced hematoma after angiography (32). On the other hand, Hermanides et al. reported that the closure device or manual compression after angiography did not make a difference in complications after angiography (33). Botti et al. noted that since some complications, such as bleeding, may be delayed, pressure bandage to control and manage complications after angiography is not recommended (34). As mentioned in the previous studies, methods such as FemoSeal and pressure bandages have been used, while in the present study, the FemoStop device the researchers designed was used. Different interventions, patients’ conditions, duration of use, and the way of measuring side effects after the intervention can be considered the most important reasons for the difference between the results of this study and other studies.
In the present study, the trend of changes in HR and SBP of patients in the experimental and control groups after the intervention was significant, and in patients who had used the FemoStop device, this trend was less than in the control group. However, the changes in RR, DBP, SaO2, and temperature of patients in the 2 groups were not significant, and the 2 groups were not significantly different in terms of these variables. In most mentioned studies, complications such as bleeding, hematoma, or pain were considered by researchers, but hemodynamic indicators were investigated. Therefore, we could not compare these outcomes with previous studies.
5.1. Limitations
In this study, patients were evaluated in the pre-test immediately, 15 minutes, and 1 h after the intervention. It is suggested that in future studies, due to the sensitivity of the patient’s condition, the patient’s condition should be evaluated every 15 minutes in the first hour after the intervention.
5.2. Conclusions
Generally, the findings demonstrated that the design and use of the FemoStop device could effectively control and reduce some complications after removing the TFA sheath, such as pain intensity, HR, and SBP of patients. It is suggested to conduct more studies to confirm this device’s efficacy in managing complications in patients. Therefore, this method can be recommended as a simple, cheap, and effective non-pharmacologic intervention after being confirmed in more studies. If this device is deemed useful, the nursing personnel fatigue will be minimized, and patients with fewer complications and more comfort will feel more satisfied. This should be taken into account by policymakers and managers of medical centers.