
1. Background
Type 2 diabetes mellitus (T2DM) is one of the most common metabolic disorders worldwide. The development of T2DM is primarily caused by a combination of two main factors: Defective insulin secretion by pancreatic β-cells and the inability of insulin-sensitive tissues to respond to insulin (1). Currently, diabetes affects over 463 million people worldwide (2), and its prevalence in the United States is 10.5% (3). Diabetes mellitus has affected more than 415 million people worldwide. It is estimated that more than 640 million people will be diagnosed with diabetes mellitus by 2040 (4). It is also estimated that 85.5% of patients with diabetes mellitus in Iran have type 2 diabetes (5). It is predicted that by 2030, about 9 million Iranians will be at risk of diabetes (6).
Fatigue is a persistent and uncomfortable complaint among people with type 2 diabetes (7). As the most common symptom of type 2 diabetes, fatigue is associated with increased HbA1c levels and low quality of life (8, 9). In other words, fatigue is a physiological phenomenon of multidimensional mental symptoms that includes physiological, psychological, and situational aspects and causes a decrease in physical performance (10).
Exercise is a cost-effective treatment method to prevent and cure type 2 diabetes and its effects (11). Stretching exercises can reduce muscle stiffness and pain by increasing its strength. It can also improve flexibility (12). Stretching exercise is also used to regulate the function of the autonomic nervous system (13). Stretching programs reduce the occurrence or severity of accidental injuries by increasing flexibility. Stretching leads to the lengthening of the muscle-tendon unit, reducing the maximum force, the amount of pressure production, and tensile stress on the muscle-tendon apparatus (14).
The results of a study conducted by Chen and Hu showed that a modified stretching exercise program can be used to increase self-care abilities in young women with menstrual back pain (15). The results of the study by Tahran and Yesilyaprak showed that modified posterior shoulder stretching exercises in addition to a treatment program were more effective in improving pain during activity, rotation of internal range of motion (ROM), and dysfunction, than a treatment program without posterior shoulder stretching exercises. In addition, stretching exercises produce significant clinical improvements (16). Also, Kruse and Scheuermann showed that long-term stretching, as a new low-intensity alternative therapeutic intervention, is able to improve several parameters of vascular function (17).
As mentioned, fatigue is one of the common problems in patients with type 2 diabetes, which can be caused by various factors and requires care and treatment to be controlled. Exercise is one of the non-medicinal methods that is cost-effective and has fewer side effects compared to other treatment methods. Much research has been conducted on fatigue in patients with type 2 diabetes, but none has shown the effects of modified stretching exercises on the fatigue of patients with type 2 diabetes. Based on the search and knowledge of the researcher, so far, no research has been done in this regard, and the gap in knowledge is evident. Therefore, this study was conducted to determine the effects of modified stretching exercises on the intensity of fatigue in patients with type 2 diabetes.
2. Objectives
This study aimed to determine the effects of modified stretching exercises on fatigue intensity in patients with type 2 diabetes.
3. Methods
3.1. Research Methods, Statistical Population, and Sample
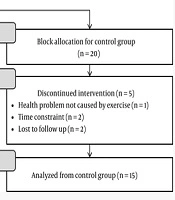
In the current clinical trial study, the research population consisted of all patients with type 2 diabetes in the Internal Clinic of Shahid Fayaz-Bakhsh Hospital, Tehran, in 2021. Fifty patients with type 2 diabetes were selected by non-randomized sampling method and, based on random block allocation, divided equally into two groups: The experimental group (25 people) and the control group (25 people) (Figure 1). Random block allocation was done in such a way that the groups were formed as A, B, and C. Before assigning people to one of the groups, a list of these letters (A, B, and C), i.e., block sizes of 3, 9, and 12, was created by the reliable website https://www.sealedenvelope.com. Each of the referring and qualified people was assigned to one of the groups. Inclusion criteria included the ability to communicate and answer the consent form questions to participate in the study, age of 30 to 60 years, a type 2 diabetes diagnosis by an endocrinologist for at least 6 months, signing the consent form, lack of regular physical exercise and fasting blood sugar of equal to or more than 7 mmol/L (126 mg/dL) or the 2-hour glucose tolerance test level of equal to or more than 11.1 mg/dL. Exclusion criteria included performing amputations in hands and feet, suffering from neurological and mental diseases such as depression and schizophrenia, and the use of neuropsychiatric drugs. Before starting the intervention and after fully explaining the purpose of the study, consent forms were obtained from the patients. The confidentiality of the collected information, voluntary participation in the study, and free withdrawal at each stage of the study were emphasized. This study has been approved by the Research Ethics Committee of Yasuj University of Medical Sciences under the code IR.YUMS.REC.1400.025, and registered on the website of the Iranian Clinical Trials Registry under the IRCT code IRCT20210209050312N1, 22/06/2021. The sample size required for the study was calculated as follows:
Considering the parameters α = 0.05, 1-α = 0.95, Z1-α/2 = 1.96, β = 0.2, 1-β = 0.8, Z1-β = 0.85, and patients' fatigue information of 5.79 ± 1.33 in the control group and 4.55 ± 1.57 in the intervention group based on a similar study (18), the number of 23 people for each group was calculated. A 10% dropout for each group was estimated, giving a final sample size of 25; however, a total of 50 people were enrolled.
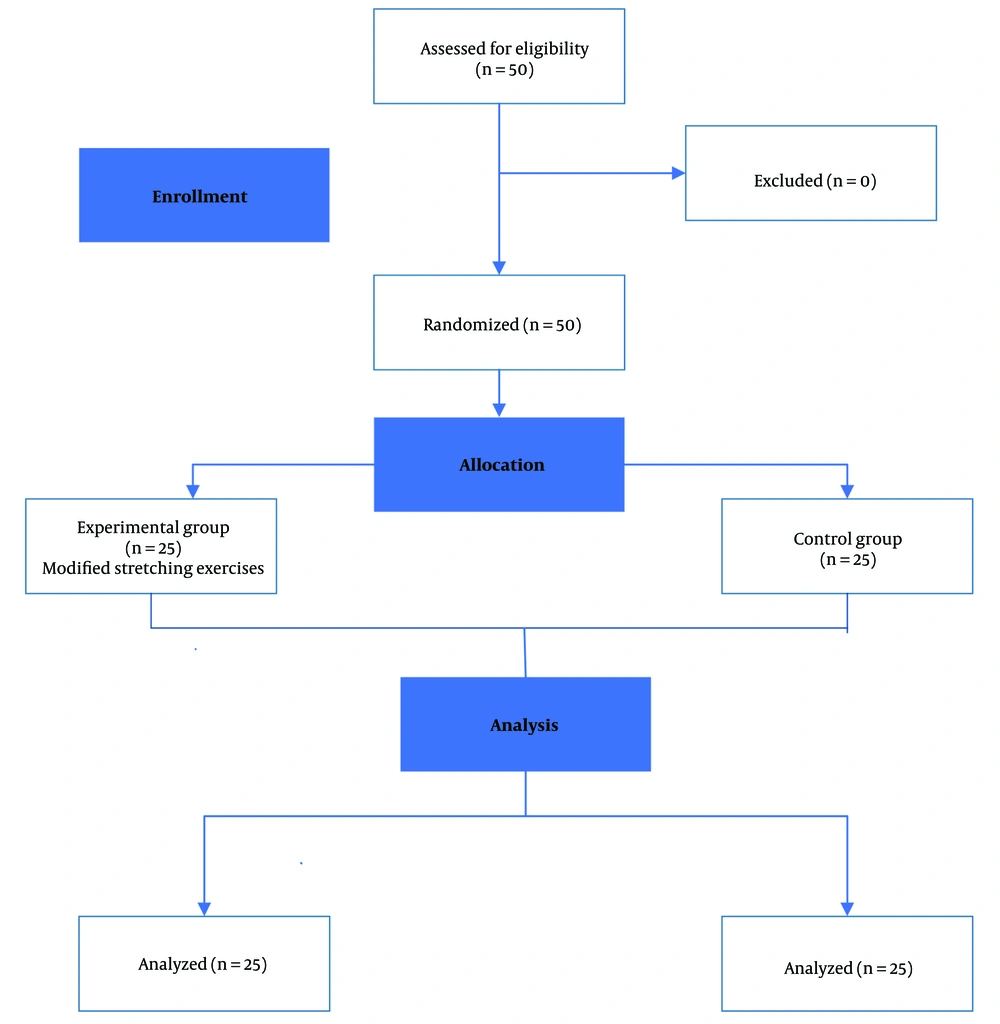
Figure 1.
Flow diagram of participant recruitment and retention according to CONSORT 2010
3.2. Questionnaires
3.2.1. Multidimensional Fatigue Scale
In addition to demographic characteristics, the Multidimensional Fatigue Scale (MFI) was used. This scale was designed by Smets et al. (19), consisting of 20 items and 5 subscales: General fatigue (4 questions), physical fatigue (4 questions), decreased activity (4 questions), decreased motivation (4 questions), and mental fatigue (4 questions). The minimum and maximum scores for the intensity of fatigue on this scale are 20 and 100, respectively. The scoring of the scale is done on a 5-point Likert spectrum from 1 = yes, completely true, to 5 = no, completely false.
The minimum and maximum points for the intensity of fatigue in this scale are 20 and 100, respectively. Scoring the scale in the form of a 5-point Likert scale yes, it is equal to a score of 1, which means that it is completely correct, and a score of 5, which means that it is completely false.
Items 19, 18, 17, 16, 14, 13, 10, 9, 5, and 2 are graded in reverse order, and their operation is as follows:
A score of 5 means completely correct, and a score of 1 indicates completely false.
The scores of all the items are added up to obtain the total score of the scale. The total score of each domain is between 4 and 20, and the total score of fatigue, which is defined by the sum of the scores of the domains, can be between 20 and 100. A higher score indicates higher fatigue. Subscales and questions are shown in Table 1.
Table 1.
The Number of Questions on the Fatigue Subscales
| Row | Subscale | Question | Number of Questions |
|---|---|---|---|
| 1 | General fatigue | 1, 5, 12, 16 | 4 |
| 2 | Physical fatigue | 2, 8, 14, 20 | 4 |
| 3 | Decreased activity | 3, 6, 10, 17 | 4 |
| 4 | Decreased motivation | 4, 9, 15, 18 | 4 |
| 5 | Mental fatigue | 7, 11, 13, 19 | 4 |
The validity and reliability of this scale were evaluated in different demographic groups, such as patients with cancer treated with radiotherapy, patients with chronic fatigue syndrome, first-year students of psychology and medicine, soldiers, and third-year medical students. The validity and reliability of this scale in Iran have been verified by Khani Jazani et al. (20), Chehrehgosha et al. (21), and Hafezi et al. (22). Confirmatory factor analysis showed that the questions of each dimension describe the same dimension, and the scale has good internal consistency. The alpha coefficient is higher than 0.8 for general, physical, and mental fatigue and higher than 0.65 for reduced activity and motivation (16-18). The frequency of training sessions was 3 times a week for one month, with a total of 12 sessions. Each session lasted 30 to 45 minutes, based on similar articles (21, 22), at 10 and 11 in the morning.
The results of other studies also confirm the appropriate validity and reliability of this tool (20, 22). Cronbach's alpha coefficient of this scale was checked again by the researcher and was reported to be 0.56.
The number of training sessions was 3 times a week, for 1 month, for a total of 12 sessions. Each session was 30 to 45 minutes, at 10 and 11 in the morning. A fatigue assessment was conducted in the morning. It is worth noting that patients with diabetes should try to exercise when their blood sugar is balanced. The interventions were carried out individually. Also, interventions were implemented for male patients by the researcher and for female patients by the help of a trained female assistant. The place of the training was a room in the physiology department of Shahid Fayaz-Bakhsh Hospital in order to keep the privacy of the patients. Before the start of the intervention, the participants of the intervention group warmed up with different exercises, such as walking, jogging, or jumping rope, since the best time to exercise is when the heart rate and body temperature have increased. The exercises were performed gently and regularly. These movements included triceps, wall slide, spine rotation, squats, bringing elbows close to knees while moving, walking jumps, one leg raises, standing thigh stretches, assisted hamstring stretches in the sitting position, biceps stretch, oblique thigh stretch in the standing position, assisted hamstring stretch in the standing position, soleus muscle stretch in the standing position, thigh stretch in the supine position, cross hamstring stretch, standing stretch biceps and soleus muscle, bending the hip while kneeling, stretching the muscles of the back of the thigh while lying down with a towel, and stretching the biceps and soleus muscle while standing. A pamphlet, along with a compact disc, was presented to the test group so that the patients could do these exercises and home exercises. In order to make sure that the participants did the exercises, the researcher contacted them. Immediately after the exercises, the multidimensional fatigue questionnaire was completed again by the patients of the two groups. No training was given to the control group. For illiterate people, the questionnaire was read, and they answered orally (Table 2).
Table 2.
Four-Week Schedule of Modified Stretching Exercises
| Weeks | Schedule |
|---|---|
| 1st | Triceps, wall slide, spine rotation, squats, bringing elbows close to knees while moving, walking jumps, one leg raises, standing thigh stretches, assisted hamstring stretches, sitting position, and biceps stretch |
| 2nd | Triceps, wall slide, spine rotation, squatting, bringing elbows close to knees while moving, walking jumps, one leg raises, diagonal thigh stretch in the standing position, assisted hamstrings in the standing position, stretching the soleus muscle in the standing position |
| 3rd | Triceps, wall slide, spine rotation, squats, bringing the elbows close to the knees while moving, walking jumps, one leg raises, lying thigh stretch, cross hamstring stretch, stretching of the biceps muscle, and standing soleus |
| 4th | Triceps, wall slide, spine rotation, squats, bringing elbows close to knees while moving, walking jumps, one leg raises, kneeling hip flexion, lying hamstring stretch with a towel, stretching the biceps muscle, and standing soleus |
3.3. Statistical Analyses
The collected data before the intervention and one week after the intervention were imported to SPSS software version 22 to be analyzed. The Shapiro-Wilk test was used to check the normal distribution of the study variables. Descriptive statistics and paired t-tests, chi-square, and independent t-tests, as well as Mann-Whitney and Wilcoxon tests, were used.
4. Results
In this study, 50 patients with type 2 diabetes between the ages of 30 and 60 were studied. They were divided into two groups: An intervention group (modulated stretching exercises) and a control group. The results were obtained from the analysis of the collected data.
Participants in this study were 64% men and 36% women. Based on the results of the Shapiro-Wilk test, the age variable was not normal in the three groups (P-value < 0.05). Therefore, the non-parametric Mann-Whitney test was used to compare the age distribution between the two groups. No statistically significant difference was observed in the demographic variables (age) between the two studied groups (P-value > 0.05). In other words, the two groups were the same in terms of age. The distribution of gender, education, and occupation had no statistically significant difference between the modified stretching group and the control group (P-value > 0.05) (Table 3).
Table 3.
Comparison of Demographic Information in Study Groups a
| Variables and Level | Modified Stretching Exercise Group | Control Group | Statistical Test | P-Value |
|---|---|---|---|---|
| Gender | Chi-square | 1.00 | ||
| Male | 16 (64) | 16 (64) | ||
| Female | 9 (36) | 9 (36) | ||
| Education | Chi-square | 0.612 | ||
| Iliterate | 4 (16) | 4 (28) | ||
| High school dropout | 10 (40) | 9 (36) | ||
| Diploma | 6 (24) | 7 (28) | ||
| Higher education | 5 (20) | 2 (8) | ||
| Occupation | Chi-square | 0.162 | ||
| Unemployed | 6 (24) | 10 (40) | ||
| Blue collar worker | 5 (20) | 4 (16) | ||
| White collar worker | 5 (20 | 6 (24) | ||
| Self-employed | 9 (36) | 9 (36) | ||
| Median age (interquartile range) | 51 (10) | 54 (16) | Mann-Whitney | 0.412 |
a Values are expressed as No. (%) unless otherwise indicated.
The average scores of total fatigue and subscales of general fatigue, physical fatigue, decreased activity, decreased motivation, and mental fatigue of people had no statistically significant difference between the groups before the intervention (P-value > 0.05) (Table 4).
Table 4.
Comparison of Fatigue Scores and its Subscales in Studied Groups Before Intervention a
| Variables (Before Intervention) | Modified Stretching Exercise Group | Control Group | P-Value b |
|---|---|---|---|
| Normal variables | |||
| Total fatigue | 52.28 ± 6.50 | 53.44 ± 5.68 | 0.505 |
| General fatigue | 9.28 ± 2.62 | 9.56 ± 1.66 | 0.654 |
| Physical fatigue | 11.56 ± 1.85 | 11.88 ± 1.96 | 0.556 |
| Decreased activity | 10.64 ± 1.41 | 10.96 ± 2.05 | 0.523 |
| Decreased motivation | 10.60 ± 2.39 | 11.04 ± 1.85 | 0.472 |
| Mental fatigue | 10.20 ± 2.06 | 10 ± 1.32 | 0.685 |
a Values are expressed as mean ± standard deviation.
b Statistical test: t-test.
After the intervention, the distributions of total fatigue (P-value < 0.001), general fatigue (P-value < 0.001), physical fatigue (P-value < 0.001), mental fatigue (P-value < 0.001), and decreased motivation (P-value < 0.01) were significantly lower in the modified stretching group than in the control group. Also, after the intervention, the mean score of decreased activity was significantly lower in the modified stretching group than in the control group (P-value < 0.01). In the modified stretching group, the average scores of general fatigue (P-value < 0.001), physical fatigue (P-value < 0.001), decreased motivation (P-value < 0.001), mental fatigue (P-value < 0.001), and total fatigue (P-value < 0.001) were significantly lower after stretching exercises compared to before the intervention (Table 5).
Table 5.
Comparison of Fatigue Scores and its Subscales in Studied Groups After Intervention
| Variables (After Intervention) | Modified Stretching Exercise Group | Control Group | P-Value a |
|---|---|---|---|
| Normal variables b | |||
| Decreased activity | 6 ± 1.19 | 10.64 ± 2.32 | < 0.001 |
| Abnormal variables c | |||
| General fatigue | 5 (2) | 10 (4) | < 0.001 |
| Physical fatigue | 6 (2) | 12 (2) | < 0.001 |
| Decreased motivation | 6 (1) | 11 (1) | < 0.001 |
| Mental fatigue | 6 (2) | 110 (2) | < 0.001 |
| Total fatigue | 29 (7) | 54 (5.9) | < 0.001 |
a * Statistical test: Mann-Whitney - t-test.
b Values are presented as mean ± standard deviation.
c Values are presented as median (interquartile range).
In the control group, there was no statistically significant difference in the total fatigue scores and the subscale scores of general fatigue, physical fatigue, mental fatigue, decreased activity, and decreased motivation (P-value > 0.05) before and after the intervention (Table 6).
Table 6.
Comparison of Fatigue Score and its Subscales in Studied Groups Before and After Intervention
| Groups and Variables | Before Intervention | After Intervention | P-Value a |
|---|---|---|---|
| Stretching Exercises Group | |||
| Normal variable b | |||
| Total fatigue | 52.28 ± 6.51 | 30.04 ± 4.37 | < 0.001 |
| General fatigue | 9.28 ± 2.62 | 5.76 ± 1.45 | < 0.001 |
| Physical fatigue | 11.56 ± 1.85 | 6.20 ± 1.29 | < 0.001 |
| Decreased activity | 10.64 ± 1.42 | 6 ± 1.19 | < 0.01 |
| Decreased motivation | 10.60 ± 2.40 | 5.64 ± 1.32 | < 0.01 |
| Mental fatigue | 10.20 ± 2.06 | 6.44 ±1.71 | < 0.01 |
| Control Group | |||
| Normal variable b | |||
| Total fatigue | 53.44 ± 5.69 | 54.44 ± 6.31 | 0.240 |
| General fatigue | 11.88 ± 1.96 | 12.24 ± 2.18 | 0.280 |
| Physical fatigue | 10.00 ± 1.32 | 10.24 ± 1.74 | 0.353 |
| Abnormal variable c | |||
| Decreased activity | 10 (4) | 12 (2.5) | 0.088 |
| Decreased motivation | 11 (3.5) | 10 (3) | 0.170 |
| Mental fatigue | 11 (3) | 11 (1.5) | 0.791 |
a * Statistical test: Wilcoxon, paired t-test.
b Values are presented as mean ± SD.
c Values are presented as median (interquartile range).
5. Discussion
This study was conducted to determine the effects of modified stretching exercises on the intensity of fatigue in patients with type 2 diabetes. Despite methodological differences, such as intervention duration, time, and sample size, the results of this study were in accordance with similar studies conducted on modified stretching exercises. Few studies have been conducted regarding the effects of modified stretching exercises on fatigue, and most of them have investigated the effects of modified stretching exercises in other conditions or examined the effects of other similar therapeutic interventions on the intensity of fatigue.
The findings of this study showed that the average overall score of fatigue intensity of patients with type 2 diabetes before the intervention in the two groups of modified stretching exercises and control did not have a statistically significant difference. In this regard, Cho and Sohng showed that before the intervention, the average scores of fatigue intensity were the same in both the test and control groups, and no significant difference was observed (23). These findings are in line with the current study, and the reason behind it might be the use of the same dependent variable at the beginning of the study.
The results of the present study showed that one week after the research interventions were completed, modified stretching exercises decreased the average overall score of fatigue intensity in patients with type 2 diabetes. Therefore, the results of the present study showed that one week after the research interventions were completed, there was a statistically significant difference between the modified stretching group and the control group in the score of fatigue intensity. The method of modified stretching movements had a positive effect on the improvement of fatigue in patients with type 2 diabetes. Therefore, in this regard, Chandralekha and Mercy Russelin Prabha showed a significant improvement in the frequency of fatigue after performing stretching exercises during dialysis (24). The results of their study align with the current research. The similarity between their study and the current research is in the type of study and measuring the level of fatigue, but these studies are different in terms of the nature and number of patients. Also, Mohamed Soliman showed that after 8 weeks of conducting the program, the intra-dialysis range of motion caused a reduction in fatigue (25). This study aligned with the present study, but the type and nature of the study were different. On the other hand, Velthuis et al. showed that aerobic and resistance exercises were effective in reducing the intensity of fatigue in patients with prostate and breast cancer (26). The results of this study are consistent with the present study, but they are different in terms of sample size and the nature of the disease.
Stretching exercises reduce musculoskeletal problems. Also, this exercise program, with proper design and supervision, is more effective than absolute rest for reducing discomfort and fatigue (27). Stretching exercises provide the possibility to restore muscle length, reduce stress, readjust body position, and improve muscle range (28). Therefore, in this regard, Larkey et al. showed that Chee Goong/Tai Chi can be effective in reducing fatigue in breast cancer survivors (29). This study is in line with the current research, but the difference is in the duration of intervention and the number of patients. Of course, they are different in the nature of the disease. Furthermore, Chan et al. showed that Chee Goone exercise reduced fatigue and was effective as a rehabilitation program in reducing fatigue in patients with a disease similar to chronic fatigue syndrome (30). This study is in line with the current research because of the result of the test, and their difference lies in the nature and number of patients. On the other hand, Schmidt et al. showed that resistance exercises play an important role in reducing fatigue caused by chemotherapy side effects in breast cancer patients (31). This study is in accordance with the current research, but it is different in sample size and type of disease. They are different in the duration of the intervention, the nature, and the number of patients.
The results of the present study showed that before and after the interventions, in the control group, the changes in the overall average score of fatigue intensity of patients with type 2 diabetes were not statistically significant. In this regard, Sveaas et al. showed that a 3-month exercise program had a beneficial effect on fatigue in patients with axial spondyloarthritis. Also, the dependent variables in the control group did not show a significant difference before and after the intervention (32). This study aligned with the present work in terms of results and consequences but was different in terms of the sample size and the nature of the disease.
Factors such as the lack of cooperation of type 2 diabetes patients due to unfavorable conditions caused by the COVID-19 pandemic and the risks taken by diabetic patients, again due to COVID-19 conditions, are some of the limitations of this study. According to the findings of this study, it is suggested that future research assess the effects of modified stretching exercises on the quality of life of patients with type 2 diabetes.
5.1. Conclusions
According to the findings of this study, modified stretching exercises can improve the intensity of fatigue in patients with type 2 diabetes. Therefore, it can be concluded that performing modified stretching exercises has a significant effect on reducing the intensity of fatigue in patients with type 2 diabetes. Also, since constructive communication between the patient and the nurse is one of the main aspects of nursing as a profession, it is suggested that the members of the health team consider the implementation of these non-pharmacological methods in the treatment program of patients with type 2 diabetes and use the modified stretching movements' method.
Due to the fact that the study was conducted in the midst of COVID-19, it had limitations such as the non-cooperation of type 2 diabetes patients due to adverse conditions caused by COVID-19 and the sensitivity of diabetic patients to the conditions of COVID-19.
This study is one of the few studies that have been conducted in the field of modified stretching exercises. Also, the presence of accurate measurement tools, the optimal intervention protocol, difficulty sampling due to the conditions of COVID-19, and getting a positive result from this intervention are all considered strengths of this study.