1. Background
According to an American Diabetes Association report, diabetes is a chronic diseases that may cause physical and mental problems in patients (1). Patients with diabetes usually complain that the most problematic and challenging aspect of their disease is fatigue (2). Reviewing published articles and online databases indicates that these patients encounter problems learning about the illness and the principles of self-care programs. The most common obstacle is suffering from physical problems and complications such as diabetes-related fatigue (3, 4). Fatigue is an unpleasant mental feeling causing a mood that ranges from weakness to exhaustion (5). It decreases the ability for physical and mental activities (6) as well as weakens normal functions in the family or in social roles (7). Although various studies have been conducted on diabetes, the number of previous studies that include fatigue and its incidence in these patients is not sufficient. Yet most investigations have indicated that fatigue is one of the most problematic and unpleasant symptoms and complications of diabetes (2, 4, 8, 9). Weijman concluded that patients with diabetes complain twice as often as patients without diabetes (9). In another study, 1,137 newly diagnosed patients with type two diabetes indicated a fatigue incidence that was estimated at 61% (10). Isna Treatment and Health Service (a statistical study in U.S.A.) reported that fatigue is the most serious challenge for 85% of patients with diabetes whose life and daily activities were affected by this complication (11). Similarly, up to the present time research in Iran, only one study in Shiraz in 2010 reported that the prevalence of fatigue in patients with diabetes based on demographic factors was 55.7% (12). Those diabetes patients who are not aware of their own health condition due to the existence of symptoms such as weakness and fatigue faced greater risks of acute and chronic diabetes complications. Moreover, they did not have the necessary cooperation for self-care activities, were unwilling to participate in educational programs, and would not follow remedial and hygienic instructions appropriately (13). The first step to control fatigue requires an exact evaluation and an appropriate measurement of the problem. Since community health nurses spend more time with patients due to the key roles in instructing individuals and improving health status, they are probably the first members from the treatment team to determine, measure, and control fatigue (14).
2. Objectives
This present study investigated the effective factors causing fatigue in patients with type two diabetes who were referred to Isfahan Endocrine and Metabolism Research Centre because the importance of fatigue and its consequences in controlling diabetes as well as the lack of adequate research into this area.
3. Patients and Methods
This cross-sectional study was done at the Isfahan Endocrine and Metabolism Research Centre from the beginning of March to the end of December 2012. The study subjects based on the findings of a statistical study with a ratio of 0.85 (p), (11) 95% confidence interval, and the level of statistical significance of 0.05 (d), and using a statistical formula n = n = (z2 × p (1-p))/d2 consisted of 195 patients with type two diabetes who were chosen from the available patients visiting Isfahan Endocrine and Metabolism Research Centre for treatment. They were selected based on the available sampling method and the inclusion criteria consisted of at least a six-month history of type two diabetes and a registered medical file in the above-mentioned centre. The exclusion criteria consisted of illnesses such as anemia, depression, thyroid disorders, heart failure, or any kind of infections that cause fatigue. The data-collection instruments of the study were two questionnaires. One questionnaire consisted of two parts: the first part collected demographic data such as age, gender, height, weight, job, related education, marital status, and activity rate) and the second part dealt with the information pertinent to the illness such as the duration of diabetes, type of treatment, the results of glycated hemoglobin last test (HbA1C), serum lipids, and the chronic complications of diabetes. The other questionnaire included a short form of a Multidimensional Fatigue Symptom Inventory (MFSI-SF) translated into Persian by the researcher. The Persian questionnaire was reviewed by 8 university professors of the Nursing and Midwifery Faculty from Islamic Azad University, Khorasgan Branch who confirmed its validity. The reliability was evaluated using Cronbach’s alpha coefficient. Considering the obtained results, the reliability proved to be acceptable. This part of the questionnaire consists of 30 phrases and five dimensions, four of which indicate different kinds of general, physical, emotional, and mental fatigue; and one is an indication of the dimension of vigor that reflects the ability to resist fatigue and is graded based on a five-point Likert scale. Each phrase score ranges from 0 (Never) to 4 (Very Much). Therefore, the total score of every single dimension varied between 0 and 24, and the total score of fatigue, which is obtained by the subtraction of vigor, dimension score from the total scores of the other four fatigue dimensions, would be a figure between -24 and 96. A higher score in each dimension except for the vigor dimension indicates more fatigue, while a vigor dimension higher score is an indication of less fatigue. The researcher obtained the necessary introduction letters and written permits from Islamic Azad University, Khorasgan Branch to have access to the sections investigated. All participating individuals were, at first, informed about the nature and the objectives of the study. Once they stated their willingness to cooperate, the questionnaires were completed through interview by the researcher. The collected data were finally analyzed by SPSS (ver 16) by utilizing the following statistical test chi-squared, independent t-test, and ANOVA.
4. Results
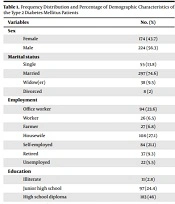
The mean and standard deviation for patient age were 54.14 and 6.88, respectively. Most patients (54.9%) were 30–39 years old. A total of 68.7% of the samples were female and 31.3% were male. Most participants were married (90.8%) and (52.3%) undergraduates. A total of 65.6 % of males had average physical activities, while 52.2 % of the females had no average physical activities. Most male participants (54.1 %) were overweight and in the female group, 49.3% of them were obese. A total of 46.7% of participants had lower levels of fatigue, 31.3% had moderate levels, 7.2% had higher levels of fatigue, and 14.9% had no fatigue. The mean and standard deviation of fatigue total scores in the investigated samples were 20.10 and 18.13, respectively; which is an indication of fatigue lower levels. The mean scores of fatigue multifaceted dimensions except for the vigor dimension were higher in females compared to males (Table 1). The result of independent samples t-test indicates there is a statistically significant difference between male and female fatigue mean total scores (t = -3.70, df = 190, P < 0.05). Table 2 indicates that the mean and standard deviation of fatigue total score in males and females were 13.24 ± 17.73 and 23.22 ± 17.49, respectively. There was no statistically significant difference between different age levels and fatigue. However, participants with a body mass index (BMI) above 30 and no average physical activities significantly expressed higher fatigue levels. The mean and standard deviation of fatigue total score in participants with no control of hemoglobin A1C were higher than for samples having control hemoglobin A1C. Additionally, the mean and standard deviation of fatigue total score in those with abnormal cholesterol, triglycerides, and cholesterol LDL were higher than for participants with normal rates (Table 3). According to the results obtained by independent sample t-test and P ˃ 0.05, there is no statistically significant relation between the mentioned test amounts and fatigue total score. Table 4 indicates that the mean of fatigue total score in those having chronic complications was higher than for individuals without chronic complications. Based on the results obtained from statistical procedures, there is a significant relation between fatigue total score and the complications of nephropathy, neuropathy, and foot ulcer history.
Table 1. Means and Standard Deviations of Fatigue Dimensions Scores of the Investigated Sections Based on Gender a
| Fatigue Dimensions | Gender | Total Sample | |
|---|---|---|---|
| Male | Female | ||
| General | 6.8 ± 5.44 | 8.47 ± 4.98 | 7.95 ± 5.18 |
| Physical | 4.42 ± 4.02 | 8.18 ± 4.84 | 7 ± 4.92 |
| Emotional | 5.90 ± 4.88 | 9.32 ± 5.32 | 8.26 ± 5.42 |
| Mental | 5.70 ± 3.89 | 6.18 ± 3.96 | 6 ± 3.94 |
| Vigor | 9.59 ± 4.27 | 8.95 ± 3.91 | 9.15 ± 4 |
| Total | 13.24 ± 17.73 | 23.22 ± 17.49 | 20.10 ± 18.13 |
aData are presented as Mean ± SD.
Table 2. Means and Standard Deviations of Fatigue Total Score Based on Gender, Age, BMI, and Physical Activity a
| Variable | Fatigue Score | |
|---|---|---|
| Values | t-value | |
| Gender | 0.000 | |
| Female | 23.22 ± 17.49 | |
| Male | 13.24 ± 17.73 | |
| Age | 0.16 | |
| 30-39 | 42 ± 20.95 | |
| 40-49 | 19.89 ± 17.03 | |
| 50-59 | 18.78 ± 17.51 | |
| More than 60 | 21.91 ± 19.75 | |
| BMI | 0.000 | |
| Normal | 15.39 ± 16.72 | |
| Overweight | 15.69 ± 18.5 | |
| Obesity | 26.68 ± 16.83 | |
| Physical Activity | 0.000 | |
| Yes | 15.73 ± 17.26 | |
| No | 25.09 ± 17.88 | |
a Data are presented as Mean ± SD.
Table 3. Means and Standard Deviations of Fatigue Total Score Based on Hemoglobin A1C and Serum Lipids a
| Variable | Fatigue Score | t-value |
|---|---|---|
| Hemoglobin A1C | 0.363 | |
| Control | 19.04 ± 17.77 | |
| Not Control | 21.45 ± 18.46 | |
| Cholesterol | 0.303 | |
| Normal | 19.47 ± 18.00 | |
| Not Normal | 23.06 ± 18.86 | |
| Triglyceride | 0.455 | |
| Normal | 19.07 ± 18.46 | |
| Not Normal | 21.04 ± 17.91 | |
| Cholesterol LDL | 0.354 | |
| Normal | 19.13 ± 17.14 | |
| Not Normal | 21.64 ± 19.73 | |
| Cholesterol HDL | ||
| Normal | 22.01 ± 19.85 | 0.323 |
| Not Normal | 19.21 ± 17.34 |
a Data are presented as Mean ± SD.
Table 4. Means and Standard Deviations of Fatigue Total Score Based on Chronic Complications of Diabetes a
| Variable | Fatigue Score | |
|---|---|---|
| Values | t-value | |
| Heart Disease | ||
| Yes | 24.13 ± 20.1 | 0.138 |
| No | 19.15 ± 17.61 | |
| Retinopathy | ||
| Yes | 20.35 ± 19.99 | 0.88 |
| No | 19.92 ± 16.99 | |
| Neuropathy | ||
| Yes | 23.45 ± 18.34 | 0.001 |
| No | 14.48 ± 16.50 | |
| Foot Ulcer History | ||
| Yes | 33.76 ± 20.14 | 0.005 |
| No | 19.09 ± 17.65 | |
| Nephropathy | ||
| Yes | 21.77 ± 18.1 | 0.035 |
| No | 15.55 | |
a Data are presented as Mean ± SD.
5. Discussion
The mean and standard deviation of the age of the participants were 54.14 ± 6.88. The highest percentage (54.9%) belonged to the 50–59 age group and the lowest (1.5%) included the 30–39 age group. Females comprised 68.7% and males 31.3% of the research sample. Fatigue mean total score of these samples is 20.10 with a standard deviation of 18.13 indicating a lower level of fatigue. The mean score of multidimensional fatigue, except for the vigor dimension in females was higher than for males. which indicates more fatigue in females. For the majority of the participants the rate of fatigue in terms of general, physical, emotional, and mental dimensions was low and in terms of the power to resist fatigue (vigor dimension), the rate was medium. In a study that investigated gender-based differences in terms of obesity, C-reactive protein (CRP), physical activity, depression, sleep quality, and fatigue in older people, Valentine et al. found that fatigue rate in females was higher than for males, which is in harmony with the results of the current study. The reason for the difference between male and female fatigue severity are multifarious and probably related to biological and mental factors (15). Among the multiple dimensions of fatigue, the emotional dimension gained the highest score in the present study (Table 1). In another study that determined the quality of fatigue and its relation with a specific pattern of clinical characteristics, Hardy et al. found that there was a strong association between diabetes and emotional fatigue, which is in line with the results of the present study (16). The findings from ANOVA (F = 1.825, df = 3, P ˃ 0.05) did not indicate a statistically significant difference among fatigue mean total scores in the classified age groups. However, Khoshandish showed that there was a statistically significant correlation between fatigue severity and age, in such a way that when age increases, fatigue severity increases too (12). Fritschi also found that there was a reverse and significant relation between the age of the investigated samples and fatigue (r = - 0.23, P < 0.05), which is contrasts the present study (17). In these research samples, being employed or a housewife and having insufficient physical activities can be the cause of higher fatigue total scores in younger participants when compared to older patients. Although several lifestyle factors may cause or increase the feelings of fatigue, overweight and low levels of physical activities are strongly associated with fatigue rates in individuals and have special clinical importance for patients with diabetes (8). In the present study, patients with a BMI higher than the normal level and with little physical activities showed greater fatigue severity compared to other patients. Valentine et al. Fritschi and Quinn (2010), and McIlvenny et al. (2000) results all were in line with the results of the present study (8, 15, 18). Data analysis did not show any statistically significant association between fatigue and the levels of hemoglobin A1C, cholesterol, triglyceride, and cholesterol LDL in terms of laboratory test amounts. However, the mean and standard deviation of fatigue total score in patients who had no control of hemoglobin A1C were higher than for patients who did control hemoglobin A1C. The mean and standard deviation of fatigue total score in patients with abnormal levels of cholesterol, triglycerides, and cholesterol LDL were higher than for patients with normal levels. Fritschi indicated that their results in terms of hemoglobin A1C feature is in line with the result of the present study (17). Chronic complications and difficulties caused by diabetes have great impacts on the body, mind, and individual activities of patients (19). The findings of the present study reflect higher fatigue scores in patients with chronic complications as compared with patients without complications. However, this relation is significant only in terms of the complications of nephropathy, neuropathy, and foot ulcer history. In a study to investigate the differences between demographic, work experience, and lifestyle-related variables; and fatigue among healthy people, patients with diabetes, and patients with other widespread chronic diseases; Weijman et al. found that the mean and standard deviation of fatigue in healthy samples were (53.52 ± 21.89), in patients with diabetes without complications (55.77 ± 20.27), and in diabetics with chronic complications, they were (71.23 ± 24.74). These findings indicated a greater level of fatigue in patients with complications and were in line with the present study (9). Chronic complications can result in physical disability and may cause restrictions that can have a negative influence on general health conditions as well as on mental-social functions. These complications may also cause psychological problems, particularly depression and anxiety, the prevalent signs of which are fatigue and reduction of energy (20). The use of the available sampling method, mental involvement, and factors such as economic, social, and family problems of patients at the time of the questionnaires completion, imposed limitations on the present study and could influence the state of their responses to the questions. As a result, fatigue should be considered as a complex and multifaceted phenomenon viewed about the maximum possible factors that make up the nature of this complication. Therefore, considering the high prevalence of fatigue and its complications in patients with diabetes, it is highly suggested to follow the present research by further and broader studies to investigate and determine the maximum factors effective in causing as well as controlling fatigue in these patients.