1. Background
Diabetes mellitus (DM) is one of the most prevalent endocrine disorders in children, which afflicts about one out of every 300 to 500 children under eighteen years of age (1, 2). The annual incidence of DM is 3.7 cases in every 100000 people in Iran. This statistics varies from one to 35 cases in every 100000 people under the age of 14 worldwide (3). Diabeticpatients are hospitalized in hospitals as 2.4 times high as the patients with other diseases while in children this ratio is as 5.3 times high as their counterparts (4). DM accounts for over 20%of mortalities in Iran (5). The high rate of mortality, complications, and economic costs as well as social and personal burdens of DM indicate the urgent need to support diabetic patients in disease control (6). Treatment objectives in diabetic patients include monitoring blood glucose levels and preventing acute problems in the long run. The treatment consists of five strategies including nutritional treatment, exercise training, monitoring and control of blood glucose, medication therapy, and education (7). Treatment and management of DM depend on patients’ behavior as promoted self-care leads to better blood glucose control and health improvement; however, many diabetic patients fail to provide adequate self-care, which leads to insufficient or absence of blood glucose control because they do not closely adhere to the recommendations provided by medical professionals (6). Despite considerable budgets allocated to the prevention and control of DM, the number of diabetic patients and their complications are increasing. The main reason may be poor self-care as DM requires specific lifetime self-care behavior (8). Nurses, as the individuals responsible to provide training and consultation to children with DM and their families, need to recognize all aspects of DM including its effects and control measures (9). Based on studies excessive self-care autonomy increased with age and demonstrated less favorable treatment adherence (10). There are fundamental differences in DM self-care between pediatric and adult patients. Young children do not have the cognitive ability to master DM management, and adolescents often do not possess the emotional maturity to sustain the tasks of daily therapy (11).
2. Objectives
The first step in planning management strategies and controlling DM is to identify the needs of diabetic patients, particularly in terms of self-care. Thus, the present study was conducted to investigate and compare self-care behavior in children and adolescents with type 1 DM (DM-1).
3. Materials and Methods
In this descriptive study, school-age children aging 10 to 17 years, who were referred to the Endocrinology and Metabolism Research Institute of Isfahan, were studied in the first half of 2012. The juvenile diabetic patients who had medical files in the institute were selected as the participants. The included patients were those who were diagnosed with DM for at least one year (12) with no other chronic condition except thyroid disorder; many studies have shown an association between DM and thyroid disorders (13-15). The ethical measures taken prior to the study consisted of obtaining permission from the Endocrinology and Metabolism Research Institute of Isfahan, explaining research objectives to the subjects and ensuring them of the confidentiality of the data, obtaining informed consent from the subjects, anonymous completion of the questionnaire, and providing the right to leave the study at any stage of research progress. The study population consisted of 147 children and adolescents with DM-1. However, due to the distortion of information, failing to meet the inclusion criteria, and lack of consent, some patients were excluded from the study and a total of 99 patients (33 children and 66 adolescent) with DM-1 were included. Patients with the age of 10 to 17 years (16-18) were finally selected as the participants.
The data were collected using a researcher-made, two-part questionnaire. The first part of the questionnaire was designed to collect demographic data (age, gender, etc.) of the subjects. The second part comprised 25 items that addressed self-care performance across six subscales including nutrition, exercise training, self-monitoring of blood glucose, management of hypoglycemia and hyperglycemia, insulin injection, and DM management when afflicted by other diseases. The items were on a five-point Likert scale each point standing for any of Always, Often, Sometimes, Scarcely, and Never. The scores ranged from five (highest score) to one (lowest score) on each item. The total score of self-care performance was assigned to four score categories based on the 25 items: very good (21-25), good (15-20), moderate (11-14), and weak (1-10). The questionnaire was developed based on scientific findings and academic sources. Following initial revisions, the content validity of the questionnaire was approved by ten professors in the School of Nursing and Midwifery of Khorasgan Islamic Azad University and by the Endocrinology and Metabolism Research Institute of Isfahan. The test-retest reliability of the questionnaire was calculated at 0.85 using Cronbach’s alpha formula. The data were analyzed using SPSS 18 (SPSS Inc, Chicago, IL, USA). Both descriptive and inferential statistics (including t test and Pearson correlation formula) were used to analyze the data. A P value of less than 0.05 was considered as statistically significant.
4. Results
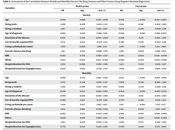
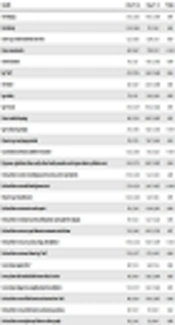
From 99 subjects, 59.6% were female and 40.4% were male. The participants’ mean age was 13.97 ± 2.48 years. In the subscale of self-monitoring of blood glucose, 72.7% of children and 59.1% of adolescents had very good performance. In exercise training, 33.3% of children and 37.9% of adolescents had very good and moderate performance, respectively. In terms of hypoglycemia and hyperglycemia management, 39.4% of children and 47% of adolescents had good performance. In insulin injection, 78.8% of children and 69.7% of adolescents showed good performance. In the subscales of nutrition, 36.4% of children and 40.9% of adolescents had moderate performance. Regarding DM management when afflicted by other diseases, 56.4% of children and 47% of adolescents had moderate performance (Table 1).
Overall, 36.4% of children and 21.2% of adolescents had never participated in any exercise training classes or programs. Moreover, 42.4% of children and 28.8% of adolescents reported that they had never controlled their blood glucose before exercise training. In addition, 12.1% of children and 22.7% of adolescents used to inject insulin on a certain part of body and had not considered circular injection to different parts of body and avoiding recurrent injections to the same locus. Only 18.8% of children and 21.2% of adolescents reported that they had regularly controlled their blood glucose at specific intervals when afflicted by other diseases and had moderate management of DM.
The results showed no significant difference (P = 0.11) in the total self-care score between children and adolescents across different subscales (Table 2).
In comparison of self-care performance, there was a significant difference in the mean scores of exercise training and self-monitoring of blood glucose between male and female subjects (P = 0.034). Thus, the results revealed that female patients had weaker training performance in comparison with males. There was a significant difference between males and females regarding self-monitoring of blood glucose between male and female subjects, the level of significance in t-test was obtained to be 0.029 (P < 0.05). Therefore, the results proved weaker performance in females in comparison with males (Table 3).
Table 1.
Levels of Self-Care Performance Associated With Diabetes in Children and Adolescentsa
| Performance | Very Good | Good | Medium | Weak |
|---|---|---|---|---|
| Nutrition | ||||
| Children | 18.2 | 33.3 | 36.4 | 12.1 |
| Adolescents | 12.1 | 28.2 | 40.9 | 18.2 |
| Exercise | ||||
| Children | 33.3 | 18.2 | 24.2 | 24.2 |
| Adolescents | 19.7 | 21.2 | 37.9 | 21.2 |
| SMBG | ||||
| Children | 72.7 | 24.2 | 0 | 3.0 |
| Adolescents | 59.1 | 30.3 | 9.1 | 1.5 |
| Hyperglycemia and Hypoglycemia Management | ||||
| Children | 27.3 | 39.4 | 24.2 | 9.1 |
| Adolescents | 17.6 | 47.0 | 28.8 | 7.6 |
| Insulin Injection | ||||
| Children | 18.2 | 78.8 | 3.0 | 0 |
| Adolescents | 27.3 | 69.7 | 3.0 | 0 |
| Sick Day Management | ||||
| Children | 12.5 | 28.1 | 3.56 | 3.1 |
| Adolescents | 30.3 | 19.7 | 0.47 | 3.0 |
aAbbreviation: SMBG, self-monitoring of blood glucose.
Table 2.
Comparison of Self-Care Performance in Children and Adolescentsa
| Performance | Mean ± SD | Standard Error of the Mean | T-Test Statistics | T-Test P Value |
|---|---|---|---|---|
| Nutrition | 1.380 | 0.171 | ||
| Children | 15.909 ± 4.38 | 0.762 | ||
| Adolescents | 14.530 ± 4.82 | 0.594 | ||
| Exercise | 0.979 | 0.330 | ||
| Children | 9.818 ± 3.63 | 0.632 | ||
| Adolescents | 9.060 ± 3.62 | 0.446 | ||
| SMBG | 1.152 | 0.252 | ||
| Children | 8.848 ± 1.56 | 0.272 | ||
| Adolescents | 8.848 ± 1.43 | 0.177 | ||
| Hyperglycemia and hypoglycemia management | 0.852 | 0.396 | ||
| Children | 20.787 ± 5.80 | 1.010 | ||
| Adolescents | 19.818 ± 5.089 | 0.626 | ||
| Insulin injection | 1.630 | 0.106 | ||
| Children | 22.393 ± 2.82 | 0.492 | ||
| Adolescents | 21.378 ± 2.96 | 0.365 | ||
| Sick day management | 1.773 | 0.079 | ||
| Children | 14.937 ± 2.81 | 0.497 | ||
| Adolescents | 13.848 ± 2.86 | 0.352 | ||
| Total performance | 1.582 | 0.117 | ||
| Children | 92.242 ± 16.64 | 2.898 | ||
| Adolescents | 87.121 ± 14.40 | 1.773 |
aAbbreviation: SMBG, self-monitoring of blood glucose.
Table 3.
Comparison of Self-Care Performance Associated With Diabetes in Female and Malea
| Performance | Mean ± SD | Standard Error of the Mean | T-Test Statistics | T-Test P Value |
|---|---|---|---|---|
| Nutrition | 0.459 | 0.647 | ||
| Female | 15.169 ± 4.56 | 0.593 | ||
| Male | 14.725 ± 4.96 | 0.784 | ||
| Exercise | 2.155 | 0.034 | ||
| Female | 8.678 ± 3.37 | 0.439 | ||
| Male | 10.250 ± 3.82 | 0.604 | ||
| SMBG | ||||
| Female | 8.355 ± 1.63 | 0.213 | 2.215 | 0.029 |
| Male | 8.975 ± 1.14 | 0.180 | ||
| Hyperglycemia and hypoglycemia management | -0.243 | 0.809 | ||
| Female | 20.033 ± 4.97 | 0.647 | ||
| Male | 20.300 ± 5.87 | 0.928 | ||
| Insulin injection | -0.091 | 0.928 | ||
| Female | 21.696 ± 2.84 | 0.370 | ||
| Male | 21.750 ± 3.11 | 0.493 | ||
| Sick day management | 0.496 | 0.621 | ||
| Female | 14.322 ± 3.08 | 0.401 | ||
| Male | 14.025 ± 2.56 | 0.411 | ||
| Total performance | -0.452 | 0.651 | ||
| Female | 88.254 ± 15.46 | 2.013 | ||
| Male | 89.675 ± 15.21 | 2.405 |
aAbbreviation: SMBG, self-monitoring of blood glucose.
5. Discussion
In the present study, the subjects had very good performance in self-monitoring of blood glucose. Fisher reported that DM management was closely associated with blood glucose self-monitoring and control and it could be considered as the DM management cornerstone; however, consultation with nutrition experts was necessary in 18.8% of children and 7.7% of adolescents. In this regard, children and adolescents should be provided with adequate knowledge and information on the necessity of nutrition consultation. Hence, it is necessary to consult with nutrition experts, particularly for children (19) and consultation is the key to nutritional care in patients with DM (20) . Heidari et al. asserted that education plays a significant role in enhancing knowledge, modifying attitudes, and improving performance in diabetic patients in terms of appropriate nutritional behavior. Therefore, nutrition education along with insulin therapy is an important factor in controlling DM-1 (21). Studies conducted by Salvatoni et al., Herbst et al., and Lopes Souto et al. have shown an association of physical activity and exercise training with adequate long-term blood glucose control, particularly with decreased levels of glycosylated hemoglobin (HbA1C) and increased insulin sensitivityin patients with DM-1 (22-24).
Mohammadian reported that the fear of exercise-induced hypoglycemic attacks or radical drop in blood glucose account for diabetic adolescents’ disinterest in exercise training and sports (25). The same fear was witnessed in the present subjects. Bernardini et al. reported that only 50% of children with DM-1 who had controlled their blood glucose before exercise, had experienced hypoglycemia more often than hyperglycemia incidents during exercise training (26). Parents and coaches need to consider this issue because hypoglycemia attacks may decrease in these patients during and after exercise training. Although carrying DM Identity Card is required of all diabetic patients, adolescents showed no concern in this regard as 50.8% of them had never carried their cards. This indicates more attention to educating diabetic patients about potential risks of not carrying their identity cards in order to prevent the side effects of blood glucose fluctuation. In case of blood glucose fluctuations, people next to diabetic patient needs to understand that the individual has DM in order to provide timely care (27).
Subjects used to inject insulin on a certain part of body and did not consider circular injection to different parts of body and avoiding recurrent injections to the same region. Recurrent injection to a specific region may gradually harm the tissue and tissue changes may result in decreased insulin absorption and the lack of disease control (26). In this regard, DM experts and trainers should provide these patients and their parents with training on adequate insulin injection techniques.
Subjects regularly controlled their blood glucose at specific intervals when afflicted by other diseases and had average management of DM. DM management requires adequate planning and the diabetic patients need to consider self-monitoring of DM as their irrevocable routines. This is particularly important when diabetic patients are afflicted with other diseases such as cold, infections, diarrhea, etc, when they need to increase the number of times they control their blood glucose and variation in insulin doses (28). There is scarcity of research on this issue in Iran; thus, it is necessary to provide parents with training on how to take care of diabetic children who are afflicted with other diseases.
Vosoghi Karkazloo et al. reported that diabetic patients had weak self-care performance while patients with DM-1, particularly young patients, had better self-care competence. Patients with higher levels of education had better self-care performance. Insufficient knowledge of self-care procedures was one of the main reasons for weak self-care performance. The results showed that self-care behaviors played a significant role in preventing early and late complications of DM and increased longevity of patients. The researchers contended that nurses were to identify self-care needs of diabetic patients. They suggested that patients should be provided with training and education in order to improve their self-care performance (29).
The results revealed a significant difference in the mean scores of exercise training and self-monitoring of blood glucose between male and female subjects; females had weaker self-care performance across these two subscales in comparison with male subjects.
Kelishadi et al. studied the amount of exercise training in adolescents in 1994 and 2001. They reported that girls significantly performed less exercise training than did boys. Moreover, senior high-school students significantly performed less regular exercise than did junior high school students (30). These findings are consistent with the present findings. Research on different age groups in different parts of the world has shown that women are less interested is sports than men are, which may relate to their personality traits. Physical activity and sports activity are also associated with physical characteristics, which may also account for differences between men and women. However, the effect of environmental factors such as parents’ behavior towards children should not be overlooked Indeed, gender differences in sports competence and suitability are closely associated with parents’ behavior where parents often encourage boys, rather than girls, to do physical exercise and sports (31). McCollum et al. studied gender differences and their effect on self-care performance in diabetic patients. They found that women had lower scores in measuring their health status and self-care performance comparing with men. They recommended that gender differences needed to be considered during treatment planning and even screening process (32). Research has shown a significant correlation between exercise training and decreased daily insulin intake for controlling blood glucose. However, children and adolescents with DM spent less time doing exercise training and showed lower physical fitness in comparison with their normal peers. In this regard, female adolescents with DM had the lowest amount of exercise training (24).
The present findings showed no significant difference between children and adolescents in self-care performance across different subscales (P = 0.17). In contrary, Vasli et al. studied children’s self-care needs and reported that 25% of juvenile diabetic patients had good self-care performance while the others showed average to weak performance (33). Wysocki et al. studied the self-management in diabetic adolescents and found that 38% of the subjects had weak self-care practice (10), which was not consistent with the present findings. The Research cited results have generally was opposed the present study.
It is necessary to provide juvenile diabetic patients with knowledge and information in the domains they show weak performance. It is necessary to identify the needs of and barriers to self-care in such patients to help to manage DM, to improve the self-care behavior and glycemic control of young patients with DM, and to prevent its complications in children and adolescents. Nurses must adopt an empowering manner of education and recognize and assess a child’s readiness to learn DM care and to take responsibility for it. The pattern of self-management may help nurses to provide more targeted assistance to youth with DM and to their parents.