
1. Background
Diabetes mellitus (DM) is an endocrine disease with abnormally elevated blood glucose due to insulin secretion and function deficiency (1). Abnormal carbohydrate, lipid, and protein metabolism in DM are related to decreased insulin action on target tissues (2). Type 2 diabetes mellitus (T2DM) is the most prevalent type of diabetes in adults and its prevalence is increasing in children and adolescents due to lifestyle alteration (3).
The interaction of genetic background with environmental factors could enhance the risk of T2DM. Environmental factors, including obesity, reduced physical activity, diet, stress, toxins, urbanization, and westernized lifestyle, are essential in T2DM development (4). Oxidative stress is the leading risk factor in the onset of T2DM and its progression (5). There is a relationship between obesity and T2DM so that obesity is a crucial risk factor for T2DM development (6) and contributes to approximately 55% of T2DM cases (7). Type 2 diabetes mellitus is multigenic with many combinations of gene variants among T2DM patients (8).
Obesity is a multifactorial and heterogeneous condition, which results from a complicated interaction between genetic and environmental factors (9). About 40 to 70% of the diversity in human obesity is caused by hereditary factors (10).
The transcription factor of nuclear factor-erythroid-2-related factor 2 (Nrf2) regulates the expression of antioxidant genes and reduces the inflammatory stress with consequent protection of cells against oxidative stress and toxicity (11).
The pathway involving Nrf2 and Kelch‑like ECH‑associated protein 1 (Keap1) have a vital role in metabolic homeostasis, anti-inflammatory, and antioxidant defense. Hence, there are some studies regarding the effect and mechanism of the Nrf2-Keap1 pathway in obesity and insulin resistance. Nuclear factor-erythroid-2-related factor 2 knockout or Keap1 knockdown approaches and administration of pharmacological activators of Nrf2 approaches have been examined in mice as an animal model (12). There was a lack of inducing cytoprotective genes under oxidative stress conditions in Nrf2 Knockout mice lacking constitutive expression of Nrf2 (13).
The function of Nrf2 in adipocyte differentiation, lipid metabolism, insulin resistance and dyslipidemia has been investigated, but there are still many unknowns. The Nrf2-null mice were resistant to the obesity induced by a high-fat diet and hepatic steatosis with suppression of adipogenesis (14). Treatment with the Nrf2 activator reduced high-fat diet-induced adipose expansion along with a reduction in the lipid accumulation in the liver. The expression of genes, which encodes the enzymes involved in the biosynthesis of fatty acids (15) demonstrates the activation of Nrf2, has a protective role against obesity.
A single nucleotide polymorphism (SNP) in the promoter region of Nrf2 G/T (rs6721961) indicated a relationship with oxidative stress-related diseases so that the rs6721961 SNP decreased the Nrf2 gene expression (16).
There are conflicting results regarding the relationship of Nrf2 gene variants with the risk of T2DM. Mexican men with the Nrf2 rs6721961 polymorphism were less likely to develop T2DM (17). However, the Nrf2 rs6721961 variants were not associated with the risk of T2DM among the Han Chinese population (18). In contrast, another study among the Chinese population reported a significant relationship between Nrf2 rs6721961 polymorphism and T2DM development (19). Another study showed that the Nrf2 variants could affect obesity development (20).
2. Objectives
This study aimed to evaluate any potential relationship between the gene variants of Nrf2 with the risk of T2DM and obesity in Kurdistan of Iraq.
3. Methods
3.1. Characteristics of Individuals
This case-control study was conducted in Sulaymaniyah, the second-largest city in the Kurdistan region of Iraq. The data were collected from adults, who visited the Sulaymaniyah Endocrine and Diabetic Center, Public Health Laboratory, and Sulaymaniyah Hospital from June to December 2021. Diabetic patients were diagnosed based on World Health Organization (WHO) guidelines. The fasting plasma glucose test should be above 126 mg/dL twice after overnight fasting, and the oral glucose tolerance test and measured plasma glucose concentration should be above 200 mg/dL twice 2 hours after a 75 g oral glucose load (21). A total of 250 individuals (122 males and 128 females) aged 45 to 65 years old visited the above centers in Sulaymaniyah and participated in the research. The participants were categorized into 4 groups; group 1 included 67 obese T2DM patients with body mass index (BMI) ≥ 30 kg/m2, group 2 consisted of 65 normal BMI patients with T2DM (BMI < 25 kg/m2), group 3 contained 62 obese non-diabetic subjects, and group 4 comprised of 56 normal BMI non-diabetic healthy individuals (BMI between 18.5 to 24.9 kg/m2). The healthy participants included healthy and obese people, normal BMI individuals accompanying patients, and the laboratory staff. Individuals who were consuming lipid-lowering drugs, those diagnosed with T1DM, pregnant women, and patients with renal dysfunction, malignancies, hyperthyroidism, hypothyroidism, and cardiovascular diseases were excluded from the study. A structured open-ended questionnaire was used to gather information about the patient’s age, history of hypertension, and disease duration. Anthropometric parameters, including weight, height, waist, hip, and wrist circumference, were measured. Body mass index was defined as the weight (kg)/height squared (m2). Obesity is a BMI level equal to or more than 30 kg/m2. Fasting blood glucose (FBS) was measured using the standard enzymatic method by an automated chemical analyzer (Cobas c311, Germany). The total antioxidant capacity (TAC) was measured by a colorimetric kit (Kiazist CO., Iran).
3.2. Genotyping
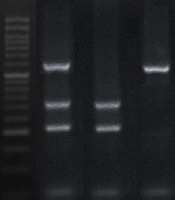
DNA was isolated from whole blood using the phenol-chloroform method and amplified by polymerase chain reaction (PCR) method. The restriction enzyme of NgoMIV digested the amplified DNA to identify the Nrf2 G/T (rs6721961) variants. Polymerase chain reaction consisted of 20 pM of the forward primer of 5’GAAAGGCGTTGGTGTAGGAG3’, and reverse primer of 5’GAATGGAGACACGTGGGAGT3’, 200 μM of dNTPs, 1.5 mM MgCl2, 1-unit Taq DNA polymerase enzyme in the PCR buffer and 300 - 500 ng of genomic DNA in the final volume of 25 μL. The PCR protocol for amplifying the Nrf2 gene consisted of 5 minutes at 94°C, 40 cycles of 30 seconds at 94°C, 30 seconds at 60.5°C, and 1 minute at 72°C. In the end, the temperature of 72°C was used for 10 minutes as the final extension. Around 10 μL of PCR products were electrophoresed on a 1.0% agarose gel. The PCR products were digested with NgoMIV restriction enzyme. The Nrf2 GG genotype produced 2 fragments of 215- and 63-bp, and the GT genotype produced 3 fragments of 278-, 215-, and 63-bp. The existence of the Nrf2 TT genotype resulted in a 278-bp fragment.
3.3. Statistical Analysis
The date were analyzed using SPSS software version 16. The differences in the frequencies of Nrf2 genotypes and alleles between groups were calculated by the χ2 test. The quantitative data were compared between groups using a two-tailed Student’s t-test and analysis of variance (ANOVA). The statistical significance was assumed at the P-value of < 0.05.
4. Results
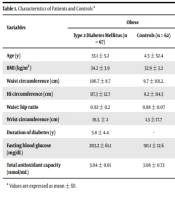
This study examined 67 obese patients with T2DM (BMI = 34.2 ± 3.9 kg/m2), 65 obese non-diabetic controls (BMI = 32.9 ± 3.2 kg/m2), 65 normal BMI T2DM patients (BMI = 23.3 ± 1.7 kg/m2), and 56 healthy individuals with normal BMI (BMI = 23.1 ± 2.1 kg/m2). The mean levels of waist, and wrist circumference in the obese T2DM group were significantly higher (106.7 ± 8.7 and 19.3 ± 2 cm, respectively) compared to the non-diabetic obese controls (101.2 ± 9.7, P = 0.003, and 17.7 ± 1.3 cm, P < 0.001, respectively). Although diabetic patients had a higher waist-hip ratio than their controls, differences were not statistically significant (Table 1). The mean levels of FBS in obese patients, obese controls, normal BMI patients, and normal BMI controls were 203.2 ± 61.1, 90.1 ± 12.6, 202,2 ± 79.1, and 85.5 ± 10.1 mg/dL, respectively (P < 0.001 comparing patients with their controls). The levels of TAC were not significantly different comparing patients with their controls (Table 1).
Table 1.
Characteristics of Patients and Controls a
| Variables | Obese | Normal Body Mass Index | ||||
|---|---|---|---|---|---|---|
| Type 2 Diabetes Mellitus (n = 67) | Controls (n = 62) | P-Value | Type 2 Diabetes Mellitus (n = 65) | Controls (n = 56) | P-Value | |
| Age (y) | 53.1 ± 5.2 | 52.4 ± 4.5 | 0.85 | 54.1 ± 5.9 | 53.6 ± 5.2 | 0.96 |
| BMI (kg/m2) | 34.2 ± 3.9 | 32.9 ± 3.2 | 0.045 | 23.3 ± 1.7 | 23.1 ± 2.1 | 0.98 |
| Waist circumference (cm) | 106.7 ± 8.7 | 101.2 ± 9.7 | 0.003 | 87.8 ± 9.0 | 86.3 ± 7.9 | 0.8 |
| Hi circumference (cm) | 117.3 ± 12.7 | 114.5 ± 8.2 | 0.28 | 97.7 ± 8.2 | 97.0 ± 15.5 | 0.97 |
| Waist: hip ratio | 0.92 ± 0.2 | 0.88 ± 0.07 | 0.27 | 0.9 ± 0.11 | 0.88 ± 0.05 | 0.93 |
| Wrist circumference (cm) | 19.3. ± 2 | 17.7 ± 1.3 | < 0.001 | 16.7 ± 1.4 | 16.4 ± 1.6 | 0.82 |
| Duration of diabetes (y) | 5.8 ± 4.4 | - | 4.9 ± 8.0 | - | ||
| Fasting blood glucose (mg/dL) | 203.2 ± 61.1 | 90.1 ± 12.6 | < 0.001 | 202.2 ± 79.1 | 85.5 ± 10.1 | < 0.001 |
| Total antioxidant capacity (nmol/mL) | 3.04 ± 0.61 | 3.06 ± 0.72 | 0.13 | 3.31 ± 0.78 | 3.2 ± 0.67 | 0.66 |
a Values are expressed as mean ± SD.
The distribution of Nrf2 genotypes was in Hardy-Weinberg equilibrium in obese patients (χ2 = 2.75, P > 0.1). In normal BMI patients and controls distribution of the Nrf2 genotypes were deviated from Hardy-Weinberg equilibrium (P < 0.05).
Table 2 shows the distribution of Nrf2 genotypes and alleles among obese and normal BMI diabetic patients and among obese and normal BMI controls. The frequency of Nrf2 genotypes was not significantly different in obese T2DM patients compared to non-diabetic obese controls. The frequency of Nrf2 TT genotype in obese diabetic patients was 9%, compared to 6.5% in obese controls (P = 0.48). However, the frequency of the TT genotype was significantly lower in normal BMI diabetic patients compared to normal BMI controls (6.2 versus 17.9%, P = 0.044). The T allele frequency was lower in normal BMI T2DM patients than in normal BMI controls (14.6 versus 27.7%, P = 0.012). The presence of the T allele reduced the risk of T2DM by 55% (OR = 0.45 (95% CI 0.23 - 0.83, P = 0.014)) (Table 2). The distribution of Nrf2 genotypes in all T2DM patients was not significantly different compared to all controls. In addition, the frequency of the Nrf2 T allele was not significantly different, comparing all patients with all controls (Table 2). The lower frequency of the T allele (16.9%) in obese individuals compared with normal BMI subjects (27.7%) reduced the risk of obesity by 47% (OR = 0.53, 95% CI 0.28 - 1, P = 0.049).
Table 2.
| Nuclear Erythroid-2-related Factor 2 | Obese | Normal Body Mass Index | ||||||||
|---|---|---|---|---|---|---|---|---|---|---|
| Type 2 Diabetes Mellitus (n = 67) | Controls (n = 62) | Total (n = 132) | Overall χ2 | P-Value | Type 2 Diabetes Mellitus (n = 65) | Controls (n = 56) | Total (n = 118) | Overall χ2 | P-Value | |
| Genotypes | 1.43 | 0.48 | 4.6 | 0.1 | ||||||
| GG | 42 (62.6) | 45 (72.5) | 92 (69.7) | 50 (76.9) | 35 (62.5) | 80 (67.8) | ||||
| GT | 19 (28.4) | 13 (21) | 30 (22.7) | 11 (16.9) | 11 (19.6) | 24 (20.3) | ||||
| TT | 6 (9) | 4 (6.5) | 10 (7.6) | 4 (6.2) c | 10 (17.9) | 14 (11.9) | ||||
| Alleles | ||||||||||
| G | 103 (76.9) | 103 (83.1) | 214 (81.1) | 111 (85.4) | 81 (72.3) | 184 (78) | ||||
| T | 31 (23.1) | 21 (16.9) | 50 (18.9) | 19 (14.6) d | 31 (27.7) | 52 (22) | ||||
a Values are expressed as No. (%).
b The overall χ2 comparing 3 genotypes between 4 groups (2 patient and 2 control groups) was 9.1, P = 0.16. The overall χ2 comparing all type 2 diabetes mellitus (T2DM) patients with all controls was 1.39, P = 0.49. Comparing GG with TT genotype between obese non-diabetic individuals and normal body mass index (BMI) non-diabetic subjects (χ2 = 3. 65, P = 0.056). The overall χ2 comparing both alleles between 4 groups (2 patient and 2 control groups) was 7.9, P = 0.049. The overall χ2 comparing both alleles between obese non-diabetic individuals and normal BMI non-diabetic subjects (χ2 = 3.95, P = 0.047, OR = 0.53 (95% CI 0.28 - 1, P = 0.049)). The overall χ2 comparing both alleles between all T2DM patients with all controls was 0.73, P = 0.39.
c Comparing GG with TT genotype between normal BMI T2DM and normal BMI controls (χ2 = 4.44, P = 0.035, OR = 0.53 (95% CI 0.28 - 0.83, P = 0.044)).
d Comparing both alleles between normal BMI T2DM and normal BMI controls (χ2 = 6.3, P = 0.012, OR= 0.45 (95% CI 0.23 - 0.83, P = 0.014)).
Table 3 indicates the distribution of Nrf2 genotypes and alleles among obese and normal BMI diabetic female patients as well as obese and normal BMI female controls. The frequency of the Nrf2 TT genotype was significantly lower in female’s normal BMI diabetic patients (0%) compared to healthy normal BMI controls (22.7%, P = 0.011). In addition, the frequency of the T allele was significantly lower in normal BMI of diabetic females than in normal BMI of controls (P = 0.015), which reduced the risk of T2DM among females by 74% (OR = 0.26 (95% CI 0.084 - 0.81, P = 0.02)) (Table 3). The distribution of Nrf2 genotypes and alleles in all females with T2DM was not significantly different from those in all female controls (Table 3).
Table 3.
| Nuclear Erythroid-2-related Factor 2 | Obese | Normal Body Mass Index | ||||||||
|---|---|---|---|---|---|---|---|---|---|---|
| Type 2 Diabetes Mellitus (n = 40) | Controls (n = 39) | Total (n = 68) | Overall χ2 | P-Value | Type 2 Diabetes Mellitus (n = 28) | Controls (n = 22) | Total (n = 61) | Overall χ2 | P-Value | |
| Genotypes | 0.78 | 0.67 | 7.4 | 0.025 | ||||||
| GG | 25 (62.5) | 28 (71.8) | 48 (70.6) | 23 (82.1) | 15 (68.2) | 43 (70.5) | ||||
| GT | 12 (30) | 9 (23.1) | 17 (25) | 5 (17.9) | 2 (9.1) | 11 (18) | ||||
| TT | 3 (7.5) | 2 (5.1) | 3 (4.4) | 0 (0) | 5 (22.7) | 7 (11.5) | ||||
| Alleles | ||||||||||
| G | 62 (77.5) | 65 (83.3) | 113 (83.1) | 51 (91.1) | 32 (72.7) | 97 (79.5) | ||||
| T | 18 (22.5) | 13 (16.7) | 23 (16.9) | 5 (8.9) | 12 (27.3) | 25 (20.5) | ||||
a Values are expressed as No. (%).
b The overall χ2 comparing 3 genotypes between 4 groups (2 patient and 2 control groups) was 12.9, P = 0.044. The overall χ2 comparing 3 genotypes between all type 2 diabetes mellitus (T2DM) patients with all controls was 2.79, P = 0.24. The overall χ2 comparing G and T alleles between 4 groups (2 patient and 2 control groups) was 6.64, P = 0.084. The overall χ2 comparing both alleles between all T2DM patients with all controls was 0.54, P = 0.46. Comparing GG with TT genotype between normal body mass index (BMI) T2DM and normal BMI controls χ2 = 6.5, P = 0.011. Comparing G and T alleles between normal BMI patients and normal BMI controls was χ2 = 5.9, P = 0.015, OR = 0.26 (95% CI 0.084 - 0.81, P = 0.02).
Table 4 illustrates the distribution of Nrf2 genotypes and alleles among obese and normal BMI diabetic male, as well as obese and normal BMI healthy male controls. The frequency of Nrf2 genotypes and alleles was not significantly different comparing male’s obese T2DM and normal BMI T2DM compared to their controls (Table 4). The prevalence of Nrf2 genotypes and alleles in all males with T2DM were not significantly different compared to those in all male controls (Table 4).
Table 4.
| Nuclear Erythroid-2-related Factor 2 | Obese | Normal Body Mass Index | ||||||||
|---|---|---|---|---|---|---|---|---|---|---|
| Type 2 Diabetes Mellitus (n = 27) | Controls (n = 23) | Total (n = 64) | Overall χ2 | P-Value | Type 2 Diabetes Mellitus (n = 37) | Controls (n = 34) | Total (n = 57) | Overall χ2 | P-Value | |
| Genotypes | 0.78 | 0.67 | 1.63 | 0.44 | ||||||
| GG | 17 (63) | 17 (73.9) | 7 (10.9) | 27 (73) | 20 (58.8) | 7 (12.3) | ||||
| GT | 7 (25.9) | 4 (17.4) | 13 (20.3) | 6 (16.2) | 9 (26.5) | 13 (22.8) | ||||
| TT | 3 (11.1) | 2 (8.7) | 44 (68.8) | 4 (10.8) | 5 (14.7) | 37 (64.9) | ||||
| Alleles | ||||||||||
| G | 41 (75.9) | 38 (82.6) | 27 (21.1) | 60 (81.1) | 49 (72.1) | 27 (23.7) | ||||
| T | 13 (24.1) | 8 (17.4) | 101 (78.9) | 14 (18.9) | 19 (27.9) | 87 (76.3) | ||||
a Values are expressed as No. (%).
b The overall χ2 comparing 3 genotypes between 4 groups (2 patient and 2 control groups) was 2.54, P = 0.86. The overall χ2 comparing 3 genotypes between all T2DM patients with all controls was 0.2, P = 0.9. The overall χ2 comparing 2 alleles between 4 groups (2 patient and 2 control groups) was 2.47, P = 0.48. The overall χ2 comparing both alleles between all T2DM patients with all controls was 0.23, P = 0.62.
The studied parameters levels were compared between various genotypes of Nrf2 in each group, and no significant difference was detected comparing parameters between different genotypes. The levels of BMI and FBS in various genotypes of Nrf2 are presented. The BMI levels in Nrf2 GG, GT, and TT genotypes were 34.2 ± 4.2, 33.9 ± 3.8, and 35.0 ± 2.4 kg/m2 (P = 0.81), respectively in obese diabetic patients, 23.2 ± 1.8, 23.7 ± 1.5, and 24.1 ± 1.3 kg/m2 (P = 0.45), respectively in normal BMI patients, 32.9 ± 3.5, 33.1 ± 2.5, and 31.7 ± 1.5 kg/m2 (P = 0.72), respectively in obese controls, and 22.9 ± 2.4, 23.7 ± 1.1, and 23.2 ± 1.9 kg/m2 (P = 0.54), respectively in normal BMI controls.
The FBS levels in obese diabetic patients were 199.6 ± 59.3, 206.6 ± 68.1, and 217.8 ± 58.5 mg/dL (P = 0.76), respectively in the presence of Nrf2 GG, GT, and TT genotypes, 199.7 ± 84, 221.3 ± 63.5, and 181 ± 52.3 mg/dL (P = 0.62), respectively in normal BMI patients, 87.9 ± 8.3, 96.4 ± 20.8, and 92 ± 9.1 mg/dL (P = 0.086), respectively in obese controls, and 86.3 ± 10.5, 83 ± 9.3, and 85.3 ± 9.9 mg/dL (P = 0.64), respectively in normal BMI controls.
TAC levels were significantly different between 3 genotypes of Nrf2 only among obese controls (P = 0.025). The levels in the presence of Nrf2 GG (n = 44), GT (n = 14), and TT (n = 4) genotypes were 3.14 ± 0.72, 3.72 ± 78 (P = 0.034), and 3.71 ± 0.86 (P = 0.31) nmol/mL, respectively in obese controls.
5. Discussion
Oxidative stress plays a role in the pathogenesis of DM and results from the enhanced level of reactive oxygen species and the absence of balance between the antioxidant and oxidant species levels due to gene expression alteration. The Nrf2 through the pathway of Nrf2-Keap1 significantly protects cells in oxidative stress condition (22).
In this study, the prevalence of Nrf2 variants was investigated among 2 groups of T2DM patients, normal BMI and obese, and 2 groups of healthy controls (normal BMI and obese) and found the presence of the T allele of Nrf2 reduced the risk of T2DM (55%) among normal BMI patients. In addition, the T allele of Nrf2 rs6721961 among female’s normal BMI diabetic patients decreased (74%) the risk of T2DM compared to healthy normal BMI females. Further, the presence of the T allele of Nrf2 rs6721961 reduced obesity risk. In obese controls, a significantly higher level of TAC was obtained in the presence of the Nrf2 GT genotype compared to the GG genotype.
Few studies have been conducted to identify the relation of Nrf2 gene variants with the risk of DM, but with conflicting results. In a study among Mexican (17), Nrf2 rs6721961 polymorphism was negatively related to T2DM, and the Nrf2 rs6721961 reduced the risk of T2DM in men. In this study, the A allele of Nrf2 could significantly protect Mexican men against DM (17). In a study among the Han Chinese population, the Nrf2 rs6721961 polymorphism was not related to the risk of T2DM (18). In contrast, in another research (19) among the Chinese population newly diagnosed with T2DM, a significant relationship of Nrf2 rs6721961 polymorphism was reported with oxidative stress, increasing insulin resistance and consequently developing T2DM. In this study, a significant higher frequency of the allele A was found in newly diagnosed T2DM patients compared to healthy controls and a relationship was detected between the Nrf2 rs6721961 and the risk of newly diagnosed T2DM (19). Nrf2 variants could affect the obesity development, prevalence, and progression of diabetes mellitus and its complications (20). Genetic background, different frequencies of the Nrf2 variants among various populations, and gene-environment interaction could explain controversy in the obtained results (17).
This study indicated that the BMI level, waist, and wrist circumference were significantly higher comparing obese T2DM with obese controls. The body mass index was a significant risk factor for predicting T2DM development. In addition, the BMI, waist circumference, waist-to-hip ratio, and waist-to-height ratio have been significantly higher among T2DM Indian patients than subjects without diabetes (23, 24). The waist circumference, as well as the waist: hip and waist: height ratios were the best indicators for T2DM detection and prediction among Indians (24).
5.1. Conclusions
Based on the results, the T allele of Nrf2 rs6721961 decreased the risk of T2DM among normal BMI T2DM patients from Kurdistan of Iraq. Further, the Nrf2 T allele among female’s normal BMI diabetic patients decreased the risk of T2DM compared to healthy normal BMI females. In addition, the T allele of Nrf2 rs6721961 reduced the risk of obesity. A significantly higher levels of waist, and wrist circumference was found in obese T2DM compared with obese controls. These results can be helpful in preventing and managing T2DM by improving the lifestyle.