
1. Background
Pregnancy is one of the riskiest and most difficult stages in a woman's life; in fact, there are stages in every woman's life that profoundly affect her life (1). These effects during pregnancy have been named pregnancy complaints (PC), such as nausea and vomiting, fatigue, back and groin pain, leg varicose veins, edema, increased vaginal discharge, constipation, hemorrhoids, dizziness, and weakness, increased saliva and stomach burning (2, 3). In a study conducted in 2017, average common complaints from pregnant women showed that around 67% of pregnant women have common pregnancy problems (2).
The significant effects of a risky pregnancy on the child's growth and physical and mental health have been demonstrated (4). Pregnancy complaints during pregnancy has a significant impact on the physical and mental health of the mother and the way she communicates with her child after childbirth (5). The interaction of PC has a significant impact on the quality of life of pregnant women and affects both maternal and child health (pregnancy monitoring, pregnancy outcomes, maternal postpartum health, and the psychomotor development of the infant) (6, 7). In addition, the impact of complaints during pregnancy on conjugal relationships can lead to the deepening of the couple's relationships or their separation (8). Pregnancy care, currently one of the most important indicators of prevention, includes examination and consultation on significant pregnancy issues, training and support for pregnant women and their families, and the preparation of a continuing clinical and laboratory screening program to confirm the low risk of pregnancy (9).
In Iran, the government supports prenatal care in primary health care centers, which is almost free and low cost (10). In addition, the assessment of women's mental and physical health information, especially the amount and factors associated with complaints during pregnancy caused by the adverse consequences of pregnancy, can be a step towards achieving the slogan (may the mother be healthy and the child be healthy) (6).
Pregnancy complaints causes include maternal stress and anxiety, maternal age, unwanted pregnancy, abortion history, spousal support, hormonal changes, hypertension, and reduced bowel movements due to the effect of targeted hormones, particularly progesterone. The most common complaint regarding unusual fatigue and the least amount of edema was also a relatively common problem in pregnant women between 20 and 24 weeks (11-14).
Given that pregnancy is one of the most important stages in a woman's life and plays a significant role in her health and her child (1), examining the health aspects of pregnant women with an emphasis on identifying complaints during pregnancy and the reasons for these complaints seems necessary.
2. Objectives
This study aimed to evaluate the frequency of PC and the effective socio-demographic factors in pregnant women referred to Neyshabur health centers. The results of this study can be used to identify the amount of PC and related factors and then design appropriate interventions to reduce these complaints, thereby improving the quality of life of pregnant women and the health of their children.
3. Methods
This cross-sectional study was performed on 417 pregnant women who were referred to Neyshabur health centers in 2021 to receive prenatal care.
3.1. Participants
Pregnant women referred to health centers in Neyshabur had inclusion criteria, including a health file, confirmed pregnancy, literacy, and not having a high-risk pregnancy. As well, the exclusion criteria from this study included written dissatisfaction with participation.
3.2. Tools
The data collection tool included two components: (1) demographic characteristics (maternal age, gestational age, number of pregnancies, sex of fetus, education level, husband's level of education, employment status, wealth index, history of abortion, unwanted pregnancy, and sleep quality); (2) PC questionnaire. In order to calculate the wealth index as a composite measure of a pregnant woman's cumulative standard of living, easy-to-collect data on asset ownership by pregnant women and an analysis of key components were used. The PC questionnaire consists of 20 questions about common problems, including painful breasts, frequent urination, fatigue, nausea, vomiting, increased salivation, increased genital secretions, stomach discomfort, pica, mood swings, drowsiness, body skin thickening, backache, flatulence, constipation, hemorrhoids, sleep disorders, edema of the lower limbs, varicose veins of the lower limbs and skin itching. The questionnaire was based on the four-point Likert scale ranging from not at all to severe, and between 1 and 4 was scored. The overall score on the questionnaire is between 20 and 80. The validity of the questionnaire in the study of Karimi et al. using content and formal validity and qualitative method by ten experts related to the research subject was reviewed. The reliability of the questionnaire was also confirmed by Cronbach's alpha method (α = 0.84) (1).
3.3. Procedure
After the researchers were in the health centers, data was collected from pregnant women who were referred to the health centers for prenatal care and considered the criteria for entering and leaving the study.
3.4. Ethical Consideration
After the proposal has been approved by the student research committee and the code of ethics has been obtained by the ethics committee of the Neyshabur University of Medical Sciences, permits to gather information have been issued to health centers by the Department of Health. After explaining the objectives of the study, the focus was on maintaining the confidentiality of the information received and obtaining informed written consent for the collection of information through the self-reported method.
3.5. Statistical Analysis
Once the data was gathered, the information was cleaned. Descriptive statistics (mean, standard deviation, absolute and relative frequency distribution table) and multiple linear regression were used to analyze the data. The software used for the data analysis was SPSS software version 22, and the significance level was considered 0.05.
4. Results
Table 1 shows the characteristics of the overall sample. The mean age of pregnant women was 28.36 ± 5.96 years old. Also, the median pregnant women's age was 28.00, with an interquartile range of 10 years. Most gestational age of pregnant women (44.60%) was more than 27 weeks. The education level of pregnant women (43.65%) was Diploma. Also, half of the participants (50.84%) had bad sleep quality.
Table 1.
Demographic Characteristics of Pregnant Women, n = 417
| Variables and Category | No. (%) |
|---|---|
| Maternal age (y) | |
| < 18 | 7 (1.68) |
| 18 - 25 | 140 (33.57) |
| 26 - 35 | 211 (50.60) |
| > 35 | 59 (14.15) |
| Gestational age (week) | |
| < 9 | 38 (9.11) |
| 9 - 18 | 81 (19.42) |
| 18 - 27 | 112 (26.86) |
| > 27 | 186 (44.60) |
| Number of pregnancies | |
| < 3 | (63.07) 263 |
| 3 - 5 | (35.25) 147 |
| > 5 | (1.68) 7 |
| Sex of fetus | |
| Male | 169 (53.31) |
| Female | 148 (46.69) |
| Abortion | |
| Yes | 124 (29.74) |
| No | 293 (70.26) |
| Education level | |
| > Diploma | 132 (31.65) |
| Diploma | 182 (43.65) |
| ≥ Bachelor's degree | 103 (24.70) |
| Husband’s education level | |
| > Diploma | 128 (30.69) |
| Diploma | 195 (46.76) |
| ≥ Bachelor's degree | 94 (22.54) |
| Employment status | |
| Employed | 36 (8.63) |
| Housewife | 381 (91.37) |
| Unwanted pregnancy | |
| Yes | 102 (24.46) |
| No | 315 (75.54) |
| Wealth index | |
| Poorest | 83 (19.90) |
| Poor | 84 (20.14) |
| Mediate | 83 (19.90) |
| Rich | 84 (20.14) |
| Richest | 83 (19.90) |
| Sleep quality | |
| Good | 205 (49.16) |
| Bad | 212 (50.84) |
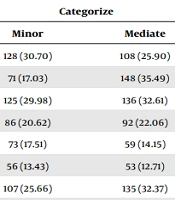
The frequency distribution of PC is highlighted in Table 2. The mean PC score was 37.76 ± 8. After summing up the minor, severe, and moderate values and percentages of each PC, the most common PC are fatigue (73.38%) and frequent urination (72.42%).
Table 2.
Frequency Distribution of PC, n = 417
| Number | PC | Categorize | |||
|---|---|---|---|---|---|
| Not at All | Minor | Mediate | Severe | ||
| 1 | Painful breasts | 146 (35.01) | 128 (30.70) | 108 (25.90) | 35 (8.39) |
| 2 | Frequent urination | 115 (27.58) | 71 (17.03) | 148 (35.49) | 83 (19.90) |
| 3 | Fatigue | 111 (26.62) | 125 (29.98) | 136 (32.61) | 45 (10.79) |
| 4 | Nausea | 118 (28.30) | 86 (20.62) | 92 (22.06) | 121 (29.02) |
| 5 | Vomit | 213 (51.08) | 73 (17.51) | 59 (14.15) | 72 (17.26) |
| 6 | Increased salivation | 267 (64.03) | 56 (13.43) | 53 (12.71) | 41 (9.83) |
| 7 | Increased genital secretions | 126 (30.22) | 107 (25.66) | 135 (32.37) | 49 (11.75) |
| 8 | Stomach discomfort | 184 (44.12) | 83 (19.90) | 75 (17.99) | 75 (17.99) |
| 9 | Pica | 154 (36.93) | 91 (21.82) | 106 (25.42) | 66 (15.83) |
| 10 | Mood swings | 179 (42.93) | 87 (20.86) | 104 (24.94) | 47 (11.27) |
| 11 | Drowsiness | 186 (44.60) | 102 (24.46) | 85 (20.38) | 44 (10.55) |
| 12 | Body skin thickening | 254 (60.91) | 68 (16.31) | 73 (17.51) | 22 (5.27) |
| 13 | Backache | 143 (34.29) | 110 (26.38) | 101 (24.22) | 63 (15.11) |
| 14 | Flatulence | 235 (56.35) | 70 (16.79) | 63 (15.11) | 49 (11.75) |
| 15 | Constipation | 252 (60.43) | 66 (15.83) | 54 (12.95) | 45 (10.79) |
| 16 | Hemorrhoids | 397 (95.20) | 12 (2.88) | 6 (1.44) | 2 (0.48) |
| 17 | Sleep disorders | 279 (66.91) | 57 (13.67) | 48 (11.51) | 33 (7.91) |
| 18 | Edema of the lower limbs | 325 (77.94) | 47 (11.27) | 34 (8.15) | 11 (2.64) |
| 19 | Varicose veins of the lower limbs | 381 (91.37) | 25 (5.99) | 9 (2.16) | 2 (0.48) |
| 20 | Skin itching | 263 (63.07) | 78 (18.71) | 59 (14.15) | 17 (4.08) |
Covariates included all variables with a P < 0.25 in the univariate analysis and maternal age, education level, unwanted pregnancy, and sleep quality. The results indicate that, after adjusting for confounding variables, maternal age (P < 0.05) and sleep quality (P < 0.001) had a significant relationship with PC. On this basis, as maternal age increases, the mean score for PC increases by 0.94. In addition, the average score of pregnancy-related complaints for those with a good quality of sleep was 6.32 lower than for those with a bad quality of sleep (Table 3).
| Variables | Univariate B (95% CI) | Full Model B (95% CI) |
|---|---|---|
| Maternal age | 1.28 (0.43, 2.12) ** | 0.94 (0.15, 1.73) * |
| Number of pregnancy | -0.02 (-1.66, 1.62) | |
| Abortion history | 0.84 (-1.02, 2.71) | |
| Education level | 0.67 (-0.47, 1.81) | 0.79 (-0.27, 1.84) |
| Husband education level | 0.67 (-0.51, 1.84) | |
| Job | -1.13 (-4.17, 1.90) | |
| Unwilling pregnancy | 2.02 (0.05, 4.00) * | 1.56 (-0.28, 3.40) |
| Wealth index | -0.10 (-0.71, 0.50) | |
| Sex | 0.72 (-1.25, 2.69) | |
| Sleep quality | -6.54 (-8.13, -4.96) *** | -6.32 (-7.90, -4.74) *** |
Abbreviation: CI, confidence interval.
a Full model: Multiple linear regression was conducted after adjusting variables which were P < 0.25 in the univariate regression (adjusting for maternal age, education level, unwilling pregnancy, and sleep quality).
b Significance level: *** P < 0.001, ** P < 0.01, * P < 0.05.
5. Discussion
This study aimed to assess the frequency of PC and the effective socio-demographic factors in pregnant women referred to Neyshabur health centers. This study showed that the mean PC score was 37.76.
In a study by Karimi et al. (1), the results showed that the mean of PC was 38, which aligned with the present study's result. It seems that the use of the same tool to measure the frequency of complaints during pregnancy and the way to access the samples under study is one of the reasons for the alignment of the results of these two studies. The present study showed that most pregnant women (73.38%) suffered from fatigue and frequent urination (72.42%). This was in agreement with findings reported by Karimi et al.'s in 2017 and Masoudi et al. in 2018 studies (1, 14).
Thus, our findings can be considered evidence that fatigue should be considered a universal problem when designing pregnancy care, and health policymakers should be serious about it. Inconsistent with the results of the present study, findings reported by Shafti and Zakeri Hamidi in 2017 (15), Azevedo et al. in 2015 (16), and Kebede et al. in 2021 (17), half of the pregnant women suffered from nausea, vomiting, hypertensive disorders, headache, and high fever, respectively.
In light of the inconsistency between the present study and the above studies, it is reasonable to assume that complaints will vary at different stages of pregnancy, also depending on when the researcher collects data.
The other result of the present study was the relationship between PC and maternal age. This was in agreement with findings reported by Tanaka et al. in 2022 (18), Londero et al. in 2019 (19), and Lin et al. in 2020 (20). Therefore, our finding can be considered as an additional document that maternal age should be considered a universal issue and health policymakers should be training and awareness of mothers regarding the complications and risks of pregnancy at old ages. One of the other results of the present study was the relationship between PC and sleep quality. This was in agreement with findings reported by Gunal and Demirturk in 2022 (21), Effati-Daryani et al. in 2021 (22), Qiu et al. in 2012 (23), and Ertmann et al. in 2020 (24). Therefore, our finding can be considered as an additional document that sleep quality should be considered a universal issue, and education and counseling regarding sleep quality are recommended for pregnant women by healthcare workers.
5.1. Limitations
The current study was conducted with several limitations. First, regarding the difficult and serious conditions of pregnant women and their inability to answer questions, their attendants completed a number of questionnaires (relies). Secondly, given the nature of the study design, the association of PC with its factors is unreliable.
5.2. Conclusions
The present study assessed the frequency of pregnancy complaints and the effective socio-demographic factors in pregnant women referred to Neyshabur health centers. We found that PC was moderate in pregnant women. Maternal age and bad sleep quality factors increase the possibility of the occurrence of a pregnancy-related complaint. So, it is recommended that healthcare providers develop and implement educational interventions to improve sleep quality and pregnancy awareness at older ages.