
1. Background
Micturition in women results from the relaxation of the pelvic floor, followed by propulsive forces generated by the contraction of the detrusor muscle and/or straining of the anterior abdominal wall muscles (1). Disruption of pelvic neurovascular bundles and alteration of the anatomical relationship between organs during radical hysterectomy result in sensory loss, storage and voiding dysfunction, and urinary incontinence, negatively affecting micturition in 70 - 85% of cases (2, 3). This knowledge is crucial before deciding on the best surgical approach (4, 5). In contrast, the disruption of pelvic nerves is highly unlikely in benign non-radical hysterectomy, as the parametrium and uterosacral ligament are not approached (6). This is also reiterated in studies conducted by Shalal and Vervest et al. (7, 8).
With this knowledge in mind, radical hysterectomies have been improved upon by nerve-sparing procedures, showing a significant variation in the incidence of lower urinary tract symptoms (LUTS) compared to conventional radical hysterectomies, as evidenced by urodynamic studies (9). Although the urodynamic alterations after these procedures are known, very few previous studies have considered the bother caused by these LUTS, and the data is conflicting. Furthermore, most studies have used invasive and expensive tests like urodynamic studies for evaluation and follow-up, further adding to morbidity.
The lack of data regarding urological morbidity after radical hysterectomy in Indian patients prompted us to conduct this study. We used uroflowmetry, a non-invasive, inexpensive, easy-to-conduct, and interpret screening test that allows the patient to void as she regularly does at home. It is recommended as the basic test for evaluating LUTS and urinary incontinence by the ICS standard assessment guidelines (1, 10). We also used symptom scores to shed light on the urological morbidity of the patient. Considering the variable literature, the results of our study will help determine whether simple and nerve-sparing radical hysterectomy is functionally safe. Additionally, it will help assess if symptom scores and uroflowmetry can be used for follow-up and evaluation in such patients, especially in countries where patients cannot afford expensive tests.
2. Objectives
The present study primarily aimed to compare the uroflowmetry parameters and symptoms score (ICIQ-FLUTS) in patients before and after undergoing open abdominal hysterectomy and secondarily to compare the results in the present study with those in the literature worldwide.
3. Methods
The study is a prospective cohort study conducted from February 1, 2023, to July 1, 2024, at a tertiary care center in Belagavi, Karnataka, India, involving patients admitted to the Departments of Surgical Oncology and Obstetrics and Gynecology for undergoing open abdominal hysterectomy.
Inclusion criteria included patients undergoing open abdominal hysterectomy. Exclusion criteria were: (1) Uncontrolled diabetes mellitus; (2) history of excisional pelvic surgery, prior pelvic irradiation, and endometriosis; (3) known spinal cord deformities; (4) lower urinary tract symptoms secondary to bladder calculus, detrusor sphincter dyssynergia, infectious or inflammatory conditions of the lower urinary tract, urethral stricture, urethral tumor or sclerosis, history of any prior LUTS.
All patients fulfilling the above criteria were familiarized with the symptom score forms and the procedure of uroflowmetry. Those willing to participate in the study were included after providing written and informed consent. Demographic data such as age, disease, type of surgery, time required, and the need for blood transfusion were collected. The time required for surgery and the number of pints of blood transfused were considered predictors of the complexity of surgery, which might be a confounding factor for LUTS outcomes.
Uroflowmetry and post-void residual (UFM + PVR) and symptom scores were collected 1 day prior to surgery and on postoperative day 10, 1 month, 3 months, and 6 months to assess changes in peak flow rate, average flow rate, voided volume, post-void volume, and symptom scores. Surgeries were performed by multiple surgeons from the departments of gynecology and surgical oncology, thus eliminating the confounder of results being evaluated after being operated on by a single surgeon.
The sample size was calculated using the formula: N = Zpq/E2 [1.96 × 0.02 × 0.98/(0.5)2]
Where Z is the reliability coefficient at a 95% confidence interval (1.96), P is the number of open abdominal hysterectomies performed as a percentage of the total surgeries performed in the institute (2%), Q is calculated as (1-p), and E is the range of the confidence interval (5%).
A master chart was prepared using an Excel spreadsheet and analyzed with SPSS version 22.0. The comparison of continuous variable means was calculated using one-way ANOVA. Intergroup and intragroup comparisons were made using one-way ANOVA and post hoc LSD analysis, respectively. Differences were considered significant when the P-value was below 0.05. The study followed the STROBE prospective cohort reporting guidelines (11).
4. Results
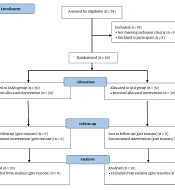
Out of the total 39 open abdominal hysterectomies performed during the study period, 3 patients had uncontrolled diabetes mellitus, 1 had a previous history of Pott’s spine and LUTS, 1 had endometriosis, 2 had active urinary tract infections, and 2 refused to enroll in the study due to the inability to follow up at the specified intervals. Hence, 30 patients were included in the study, and all completed follow-up (Figure 1).

Figure 1.
Flowchart depicting collection of samples
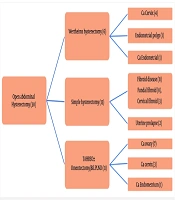
In our study, the mean age was 51.90 ± 11.98 years, and the mean time for surgery was 1 hour 39 minutes ± 33 minutes. The mean blood transfusion was 0.2 ± 0.48 pints, with the minimum being no need for transfusion and the maximum being 2 pints. Six (20%), 13 (43.3%), and 11 (36.7%) patients underwent Wertheim’s hysterectomy (for cervical cancer, endometrial polyp, and endometrial cancer), simple hysterectomy (for prolapsed uterus and fibroids), and TAHBSO ± omentectomy/bilateral pelvic lymph node dissection (PLND) (for cervical cancer, ovarian cancer, and endometrial cancer), respectively (Figure 2).

Figure 2.
Distribution of patients according to the types of surgeries undergone and the corresponding pathologies
4.1. Patients Undergoing Wertheim’s Hysterectomy
There was no significant difference in the mean peak flow rate, as the mean before surgery was 21.47 mL/sec, and the values at the first and last postoperative follow-ups were 20.95 mL/sec and 21.05 mL/sec, respectively. Similar observations were noted for average flow rates (AFR). The mean voided volume at the end of follow-up (254 mL) almost approached that before surgery (264 mL). This finding was again observed when the post-void residual volumes (PVR) were studied (Table 1). The differences between the values observed pre-surgery and post-surgery were not statistically significant, as the P-values were above 0.05.
Table 1.
Means of the Different Variables and the Difference Between Them Among Pre and Post Op Patients who Underwent Wertheim’s Hysterectomy a
| Variables | Pre Op | Day 10 | 1 Month | 3 Month | 6 Month | P-Value |
|---|---|---|---|---|---|---|
| PFR | 21.47 ± 3.68 | 20.95 ± 5.48 | 23.00 ± 4.19 | 21.08 ± 5.53 | 21.05 ± 3.73 | 0.932 |
| AFR | 9.90 ± 1.66 | 8.68 ± 4.27 | 11.10 ± 2.13 | 10.55 ± 2.82 | 11.30 ± 2.40 | 0.504 |
| VV | 263.67 ± 102.83 | 220.00 ± 96.56 | 294.67 ± 162.92 | 310.00 ± 98.96 | 253.67 ± 126.08 | 0.722 |
| PVR | 17.33 ± 10.56 | 21.83 ± 8.80 | 20.33 ± 9.29 | 24.33 ± 8.26 | 21.17 ± 7.14 | 0.744 |
| ICIQ | 0.50 ± 0.84 | 0.17 ± 0.41 | 0.83 ± 1.33 | 0.33 ± 0.82 | 0.17 ± 0.41 | 0.617 |
Abbreviations: PFR, peak flow rate; AFR, average flow rate; VV, voided volume; PVR, post void residual; ICIQ, International Consultation on Incontinence Questionnaire; TAHBSO, total abdominal hysterectomy and bilateral salpingo-oophorectomy.
a Surgery = Wertheims hysterectomy.
4.2. Patients Undergoing Simple Hysterectomy
There was no significant difference in the mean peak flow rate, as the mean before surgery was 22.03 mL/sec, and the values at the first and last postoperative follow-ups were 20.74 mL/sec and 21.25 mL/sec, respectively. Similar observations were noted for AFR. The mean voided volume at the end of follow-up (294 mL) almost approached that before surgery (290 mL). This finding was again observed when the PVR were studied (Table 2). The differences between the values observed pre-surgery and post-surgery were not statistically significant, as the P-values were above 0.05.
Table 2.
Means of the Different Variables and the Difference Between Them Among Pre and Post Op Patients who Underwent Simple Hysterectomy a
| Variables | Pre Op | Day 10 | 1 Month | 3 Month | 6 Month | P-Value |
|---|---|---|---|---|---|---|
| PFR | 22.03 ± 7.19 | 20.74 ± 5.44 | 21.75 ± 6.20 | 21.93 ± 6.74 | 21.25 ± 6.64 | 0.986 |
| AFR | 10.76 ± 4.00 | 9.91 ± 4.72 | 11.02 ± 3.66 | 11.68 ± 5.26 | 10.78 ± 3.15 | 0.888 |
| VV | 289.92 ± 168.9 | 320.38 ± 127.99 | 319.00 ± 132.24 | 279.17 ± 124.15 | 294.09 ± 129.5 | 0.925 |
| PVR | 16.38 ± 3.82 | 18.17 ± 5.26 | 21.77 ± 11.68 | 18.42 ± 5.02 | 18.36 ± 4.46 | 0.377 |
| ICIQ | 1.08 ± 0.95 | 1.62 ± 1.56 | 0.69 ± 0.75 | 0.62 ± 0.96 | 0.54 ± 0.88 | 0.067 |
Abbreviations: PFR, peak flow rate; AFR, average flow rate; VV, voided volume; PVR, post void residual; ICIQ, International Consultation on Incontinence Questionnaire; TAHBSO, total abdominal hysterectomy and bilateral salpingo-oophorectomy.
a Surgery = simple hysterectomy.
4.3. Patients Undergoing Total Abdominal Hysterectomy and Bilateral Salpingo-Oophorectomy + Bilateral Pelvic Lymph Node Dissection ± Omentectomy
There was no significant difference in the mean peak flow rate, as the mean before surgery was 20.20 mL/sec, and the values at the first and last postoperative follow-ups were 19.24 mL/sec and 20.14 mL/sec, respectively. Similar observations were noted for AFR. The mean voided volume at the end of follow-up (264 mL) almost approached that before surgery (280 mL). This finding was again observed when the PVR were studied (Table 3). The differences between the values observed pre-surgery and post-surgery were not statistically significant, as the P-values were above 0.05.
Table 3.
Means of the Different Variables and the Difference Between Them Among Pre and Post Op Patients who Underwent Total Abdominal Hysterectomy and Bilateral Salpingo-Oophorectomy + Omenectomy/Bilateral Pelvic Lymph Node Dissection a
| Variables | Pre Op | Day 10 | 1 Month | 3 Month | 6 Month | P-Value |
|---|---|---|---|---|---|---|
| PFR | 20.20 ± 3.06 | 19.24 ± 2.48 | 19.92 ± 2.34 | 18.98 ± 3.64 | 20.14 ± 1.90 | 0.785 |
| AFR | 9.91 ± 3.01 | 10.00 ± 2.31 | 9.96 ± 1.33 | 9.99 ± 1.33 | 10.85 ± 2.24 | 0.842 |
| VV | 279.91 ± 80.51 | 293.82 ± 112.92 | 282.73 ± 85.73 | 284.55 ± 82.47 | 264.30 ± 60.48 | 0.958 |
| PVR | 20.82 ± 12.00 | 24.73 ± 11.21 | 22.18 ± 9.83 | 22.09 ± 10.22 | 23.10 ± 11.43 | 0.942 |
| ICIQ | 0.00 ± 0.00 | 0.45 ± 0.82 | 0.00 ± 0.00 | 0.20 ± 0.63 | 0.00 ± 0.00 | 0.125 |
Abbreviations: PFR, peak flow rate; AFR, average flow rate; VV, voided volume; PVR, post void residual; ICIQ, International Consultation on Incontinence Questionnaire; TAHBSO, total abdominal hysterectomy and bilateral salpingo-oophorectomy.
a Surgery = Total abdominal hysterectomy and bilateral salpingo-oophorectomy + omenectomy/bilateral pelvic lymph node dissection.
When all the patients undergoing open abdominal hysterectomy were studied, irrespective of the type of surgery undergone, the preoperative peak flow rates (PFR), AFR, voided volumes (VV), PVR, and symptom scores (ICIQ-FLUTS) were considered individually with postoperative values at postoperative days 10, 30, 90, and 180. There was no statistically significant difference observed, considering a 95% confidence interval and a P-value of 0.05 (Table 4).
Table 4.
Post-hoc Analysis of Uroflowmetry Parameters and Symptoms Scoring at Various Time Periods
| Post- Operative Follow Up | PFR | AFR | VV | PVR | ICIQ-FLUTS | |||||
|---|---|---|---|---|---|---|---|---|---|---|
| Mean Difference w.r.t Pre-operative Values | P-Value | Mean Difference w.r.t Pre-operative Values | P-Value | Mean Difference w.r.t Pre-operative Values | P-Value | Mean Difference w.r.t Pre-operative Values | P-Value | Mean Difference w.r.t Pre-operative Values | P-Value | |
| POD 10 | 1.01667 | 0.425 | 0.58000 | 0.490 | -9.56667 | 0.749 | -3.10667 | 0.178 | -0.31379 | 0.193 |
| 1 month | -0.08333 | 0.948 | -0.37333 | 0.657 | -19.8333 | 0.507 | -3.43333 | 0.137 | 0.10345 | 0.670 |
| 3 months | 0.60874 | 0.636 | -0.53023 | 0.531 | -6.58621 | 0.827 | -2.83448 | 0.223 | 0.17241 | 0.477 |
| 6 months | 0.45037 | 0.731 | -0.64556 | 0.455 | 6.92593 | 0.821 | -2.54074 | 0.283 | 0.31034 | 0.202 |
Abbreviations: PFR, peak flow rate; AFR, average flow rate; VV, voided volume; PVR, post void residual; ICIQ, International Consultation on Incontinence Questionnaire; TAHBSO, total abdominal hysterectomy and bilateral salpingo-oophorectomy.
5. Discussion
In our study titled "Comparison of Lower Urinary Tract Function Before and After Undergoing Open Abdominal Hysterectomy: A Prospective Cohort Study", we found no significant difference in the uroflowmetry outcomes and the symptoms score when the findings were compared as per the study protocol. The Wertheim’s hysterectomy and TAHBSO + bilateral PLND performed at our center anatomically correspond to type III of the Piver-rutledge nerve sparing radical hysterectomy classification (12-15). Considering this anatomic definition, our study did not show any statistically significant difference in uroflowmetry parameters (PFR, AFR, VV, PVR) and symptoms scoring when pre-surgery and post-surgery outcomes were measured.
Considering that urodynamic studies are invasive, costly, and time-consuming, we decided to utilize uroflowmetry as a surrogate to urodynamic study, where detrusor overactivity can be reflected by decreased VV and low post-void residual volume (corresponding to low maximum cystometric capacity) (9), and detrusor underactivity can be reflected by maximum flow rate, average flow rate, post-void residual volume, and high VV. The insignificant difference in the VV and post-void residual volume in our study is in accordance with studies conducted by Vervest et al. (8, 9), Aoun et al. (16), and Ito et al. (17), where maximum cystometric capacity remained the same.
In the study conducted by Roh et al. (18), the PFR returned to baseline at 3-month follow-up, unlike in the conventional radical hysterectomy group where baseline values were not achieved even at the end of the study. This is also supported by a meta-analysis by Wu et al. (19) and a Cochrane review conducted by Keitpeerakool et al. (20). Our study also did not show any significant difference in the post-void residual volume. Similarly, in the study by Roh et al. (18), insignificant PVR was achieved at POD 11, and it reached pre-treatment levels at 3 months in the nerve-sparing group. These findings are in stark contrast when compared with the conventional radical hysterectomy group, where such results were seen at POD 18, and pre-treatment levels could not be achieved even at 1 year. Similar findings were also seen when symptoms score was taken into consideration in the above-mentioned study (18).
Pelvic dissection in simple hysterectomy is minimal, and thus very little urological morbidity is expected in these patients. This was well observed in our study, and our observations are also backed up by various other studies (21, 22). Our study is unique as: (1) It is one of the very few prospective studies conducted on the topic, thus helping to tackle the problem of recall bias; (2) it is the first study to use only uroflowmetry for evaluation of the voiding phase, whereas previously this has been assessed by urodynamic studies only, making it cost-effective; (3) it is the first study to use ICIQ for symptoms score as it also evaluates post-void dribble and incontinence in patients, unlike IPSS, which has been used earlier in other studies; (4) surgeries were performed by gynecologists and surgical oncologists, thus eliminating single surgeon bias.
5.1. Conclusions
Nerve-sparing radical hysterectomy can be utilized as a standard procedure for the treatment of gynecological cancers, provided oncological safety can be achieved. Simple hysterectomy is associated with minimal urological morbidity. Also, symptoms score and uroflowmetry can be reliably used as an alternative to urodynamic study to screen patients for post-hysterectomy urological morbidities. However, considering world literature, there are still a few conflicting reports, and hence regular follow-up is advisable for these patients so that early intervention (if needed) can prevent further deterioration of symptoms and reduce urological morbidity.
5.2. Limitations
The limitations of the study included: 1) Small sample size and only Indian patients included; thus results cannot be generalized; 2) urodynamic study is the best investigation to ascertain the alterations in the functions of the urinary bladder but could not be included in our study due to its invasive nature and the need for multiple follow-ups.