
1. Background
Crescentic glomerulonephritis (GN) represents the most critical subtype of GN, distinguished by the morphological development of multiple cellular layers within the Bowman's capsule. These formations, known as glomerular crescents, generally affect over half of the glomeruli (1). The integrity of the glomerular basement membrane (GBM) is compromised in crescentic GN, facilitating the infiltration of inflammatory cytokines, leukocytes, blood proteins, and circulating cells into Bowman's capsule through the blood vessels (2). Crescents can be either circumferential or non-circumferential, with the occurrence of the first type in more than 80% of glomeruli being associated with a poor prognosis (3).
Crescentic GN due to unknown causes (primary or idiopathic) is categorized based on immunopathological findings into anti-GBM, immune-complex-mediated, and pauci-immune crescentic GN (3). The anti-GBM type, which contributes to about 10 - 15% of all cases of crescentic GN, shows the presence of IgG and circulating antibodies along the GBM (4). In the second type, immune complexes are deposited in a granular pattern. This accounts for about 25–30% of cases in children. If the deposition is minimal or absent, the condition is known as pauci-immune crescentic GN. This form of GN accounts for about 65 - 70% of all instances and is mostly prevalent among adults or older people. Most cases of the pauci-immune type show the presence of cytoplasmic (C-) or perinuclear (P-) anti-neutrophil cytoplasmic autoantibodies (ANCAs) that primarily target myeloperoxidase (MPO) and proteinase-3 (PR3) (5). However, a small percentage (5% to 10%) of patients lack ANCA and demonstrate different clinical characteristics, increased glomerular lesions, and worsened renal outcomes compared to ANCA-positive ones (6).
The involvement of the complement system in ANCA-negative pauci-immune type continues to be a matter of interest recently (7, 8). The lack of immune deposits in renal biopsies led to the initial belief that complement had little involvement in ANCA-associated GN. Nonetheless, later studies in mouse models of ANCA-associated vasculitis (AAV) established the mitigation of the disease process when the complement cascade was blocked by C5 or the C5a receptor (9). Additionally, complement activation in vivo was suggested by the presence of circulating complement factors in patients with AAV. Moreover, in the MPO-ANCA mouse model, glomerular disease was not prevented by knocking out a critical activating factor of the lectin pathway (factor C4), but it was prevented by knocking out the factor B component of the alternative complement pathway (10). According to these results, the alternative pathway is the main mechanism through which complement system activation occurs. Hilhorst et al. pointed out that most renal biopsies from these patients showed positive staining for C3d, C4d, and C5b-9, even though the biopsies did not show any immune complex deposits (11). While a substantial amount of research work has been conducted on ANCA-positive cases, research on ANCA-negative cases of pauci-immune crescentic GN is comparatively rare. Specifically, there is a lack of studies addressing the activation of the alternative complement system among patients with ANCA-negative GN. Neutrophils can effectively defend the host in neutrophil-mediated diseases by activating the alternative complement pathway and releasing C5 fragments (12).
Neutrophils are considered significant effector cells in ANCA-negative pauci-immune crescentic GN, akin to those in ANCA-positive crescentic GN. However, unlike in ANCA-positive patients where neutrophils are activated by ANCA, other autoantibodies or immune mechanisms mediated by cells are responsible for neutrophil activation in patients lacking ANCA. Consequently, activated neutrophils are thought to activate the alternative complement pathway in these patients, but further research is needed to draw definitive conclusions. In addition to this gap, there is a notable lack of large-scale case series in this area, although individual case reports are available (13). Moreover, the management of patients with ANCA-negative pauci-immune crescentic GN has not been the subject of any prospective and controlled studies. Given these gaps in the literature, the present prospective single-center study was designed to characterize the clinical profile, treatment response, and prognostic implications of idiopathic ANCA-negative pauci-immune crescentic GN and to evaluate the possible involvement of the alternative complement pathway.
2. Objectives
To study the clinical profile, presentation, treatment, and prognostic implications of idiopathic pauci-immune ANCA-negative crescentic GN. Additionally, to investigate the possible role of the alternative complement pathway within the same spectrum.
3. Methods
The present study is a prospective observational type conducted at the Department of Nephrology of Dhanalakshmi Srinivasan Medical College and Hospital, Perambalur district, Tamil Nadu, India, over a period of 3 years (from 2021 to 2023). The study involved adult patients (aged 18 years or older) diagnosed with crescentic GN. A total of 21 adult patients presenting with rapidly declining renal function, whose biopsy revealed pauci-immune crescentic GN and who tested negative for C-ANCA, P-ANCA, and anti-GBM antibodies, were enrolled in the study for prospective analysis. During the initial assessment, all participants underwent testing for ANCA and anti-GBM. C-ANCA, P-ANCA, and anti-GBM were analyzed twice from two separate laboratories, with a minimum interval of seven days between tests. Patients were included in the study only if both tests yielded negative results. These markers were also evaluated every three months during the course of their treatment and follow-up period to ensure that they belonged to the ANCA-negative category. Patients with renal biopsy indicating more than 10% crescents were eligible for inclusion. Exclusion criteria comprised patients under 18 years old, those with crescentic GN due to secondary causes, and individuals who later tested positive for immune markers during the study period. Nearly 37 patients who tested positive for either C-ANCA, P-ANCA, anti-GBM, anti-nuclear antibody (ANA), etc., at various time intervals during the study were excluded irrespective of whether they underwent renal biopsy or not. They were managed in their respective lines as per the guidelines. Some of them had serum c5b-9 and factor B levels measured too, but were summarily excluded as they didn’t conform to the essential criterion of ANCA negativity.
Serum C3 was measured using the immunoturbidimetry method. The assay was based on the reaction between C3 and its antibody. The insoluble complex, in the case of a positive reaction, produced turbidity, which was read with spectrophotometry. The normal reference range for serum C3 was 90 - 180 mg/dL. As additional evidence to substantiate the involvement of the alternative complement pathway, we also estimated the terminal complement components C5b-9 as well as serum complement factor B. Both were measured using the Sandwich ELISA method. The reference range for C5b-9 was < 250 ng/mL and for factor B, it was 120-330 µg/mL. Nearly 11 patients who were enrolled in our study had their terminal complement components measured, while nearly 19 out of 37 patients who were later excluded from the study for turning out to be ANCA positive also had them measured. Due to financial constraints, these tests could not be done for all 21 enrolled patients, and hence these tests had to be excluded from the study to maintain uniformity.
C-ANCA and P-ANCA were measured by the indirect ELISA method. A mixture of purified antigens, namely proteinase 3 and myeloperoxidase, was coated onto microwells. The specific antibodies, if found in the patients’ serum, bound to the surface of the coated antigens. The added enzyme conjugate reacted with the immobile antigen-antibody complexes, which finally imparted a yellow color, the intensity of which was proportionate to the concentration of the complexes. It was read photometrically at 450 nm in an ELISA reader. The normal range was 0.00 - 0.22 units/mL. Anti-GBM was measured using the indirect fluorescent antibody test.
The standard intensive immunosuppressive therapy employed in our patients consisted of a single fixed dose of Rituximab 200 mg along with three exchanges of plasma. Rituximab was administered after the cycles of plasma exchange and with prior premedication. The amount of plasma removed per exchange was 35 mL/kg for men and 30 mL/kg for women. Of these 21 patients, two patients had only fibrous crescents and were excluded from our standardized intensive immunotherapy mentioned above. Out of the remaining 19, four patients were not willing to undergo either treatment, including Rituximab and plasma exchange, due to financial constraints. Twelve patients received both treatments, one received only plasma exchanges, while the last two received only Rituximab.
Complete remission is defined as normalization of serum creatinine, normal serum C3 levels, and 24-hour urine protein excretion of < 300 mg per day. A repeat renal biopsy couldn’t be done to demonstrate histopathological remission. "No remission" is defined as the failure of serum creatinine to decrease by > 50% from the baseline towards the end of the treatment for those not on dialysis, dialysis dependency, and failure of 24-hour urine protein to decrease by more than 50% towards the end of the treatment. Anyone who showed a tendency towards remission but didn’t meet the above criteria was declared to have attained partial remission.
A comprehensive clinical, biochemical, and histological assessment was conducted for all the patients involved. Clinical data encompassed parameters such as age, gender, constitutional symptoms (fever, arthralgia, myalgia, and respiratory issues), administered therapeutic interventions (plasma exchange therapy and/or rituximab), duration of follow-up, and clinical outcomes such as remission status (complete or partial remission), mortality, progression to CKD, dependency on hemodialysis, and necessity for transplantation. Complete remission was referred to as achieving a proteinuria level of 0.5 gram/day or less and a return of renal function to normal. Biochemical evaluations of patients were also conducted, comprising serum creatinine and proteinuria levels at the time of presentation. Additionally, serological tests for ANA, anti-double stranded DNA (dsDNA), antistreptolysin O (ASO) titer, and serum complement levels (C3) were documented. Furthermore, all patients underwent renal biopsy, which was assessed based on histological characteristics such as the percentage, morphology (circumferential and non-circumferential), and types of crescents (cellular and fibro-cellular/fibrous) formed within the glomeruli. The study received approval from the ethics committee of the college. All patients provided written informed consent prior to their participation.
The patients were followed up with a thorough history and clinical examination, alternate day renal function tests, routine biochemical evaluation, weekly serum C3, and 24-hour urine protein excretion every week until discharge, death, or the clinical endpoints (namely no remission, partial remission, complete remission).
3.1. Statistical Method
The data were entered into an MS Office Excel sheet and analyzed using SPSS version 16. Continuous data with a normal distribution were expressed as mean with standard deviation. Categorical data were expressed as frequency with percentage. The Fisher-Freeman-Holtan exact test was used to compare the frequency between groups. The Kruskal-Wallis test was used to compare the mean ranks of creatinine and proteinuria between the three groups (yes, no, and partial remission). Multivariate logistic regression was performed to determine the factors that influence remission in the study. A P-value of < 0.05 was considered statistically significant.
4. Results
4.1. Baseline Characteristics
The study included 21 patients with idiopathic ANCA-negative renal-limited pauci-immune GN. The majority were aged 41 - 60 years (52.4%), male (61.9%), and presented with crescents in 25 - 50% of glomeruli (42.9%). Constitutional symptoms were present in 23.8% of patients, and alternative complement pathway involvement was noted in 38.1%. Twelve patients received combined Rituximab and plasma exchange as the “standard immunosuppressive therapy,” while 2 received only Rituximab and one received only plasma exchange. Four patients with cellular crescents were not willing to undergo either plasma exchange or Rituximab. Two patients with pure fibrous crescents were excluded from the standard immunosuppressive therapy. Remission status varied, with 38.1% achieving complete remission, 14.3% partial remission, and 47.6% no remission. Over half (52.4%) progressed to CKD within three months, 28.6% became hemodialysis-dependent, and 19% died during follow-up. Table 1 shows the baseline characteristics of our patients. Table 1 describes the baseline characteristics.
Table 1.
Description of Baseline and Clinical Characteristics of Idiopathic Anti-neutrophil Cytoplasmic Autoantibodies-Negative Renal-Limited Pauci-immune Glomerulonephritis Patients (N = 21)
| Baseline and Clinical Characteristics | Values |
|---|---|
| Age category (y) | |
| ≤ 20 | 1 (4.8) |
| 21 - 40 | 7 (33.3) |
| 41 - 60 | 11 (52.4) |
| > 60 | 2 (9.5) |
| Gender category | |
| Female | 8 (38.1) |
| Male | 13 (61.9) |
| Crescent (%) | |
| < 25 | 5 (23.8) |
| 25 - 50 | 9 (42.9) |
| > 50 | 7 (33.3) |
| Constitutional symptoms | |
| Present | 5 (23.8) |
| Absent | 16 (76.2) |
| Involvement of alternative complement pathway | |
| Present | 8 (38.1) |
| Absent | 13 (61.9) |
| Crescent type | |
| Cellular | 12 (57.1) |
| Fibrous | 2 (9.5) |
| Cellular + Fibrous | 7 (33.3) |
| Crescent morphology | |
| Circumferential | 8 (38.1) |
| Non circumferential | 13 (61.9) |
| Plasma exchange | |
| Yes | 13 (61.9) |
| No | 8 (38.1) |
| Rituximab | |
| Yes | 14 (66.7) |
| No | 7 (33.3) |
| Remission status | |
| Complete | 8 (38.1) |
| Partial | 3 (14.3) |
| Nil | 10 (47.6) |
| Progression to CKD in 3 months | |
| Yes | 11 (52.4) |
| No | 10 (47.6) |
| Hemodialysis dependent | |
| Yes | 6 (28.6) |
| No | 15 (71.4) |
| Mortality | |
| Yes | 4 (19) |
| No | 17 (81) |
| Transplantation | |
| Not applicable | 4 (19) |
| Yes | 2 (9.5) |
| No | 13 (61.9) |
| Getting worked up | 1 (4.8) |
| Counseled for pre-emptive transplantation | 1 (4.8) |
4.2. Clinical and Histological Comparisons
A significant clinical difference was observed with respect to the crescent type, morphology, and percentage. Cellular, non-circumferential crescents of < 25% fared significantly better clinically, with rates of spontaneous remission being higher in them than in those with crescents of > 25% and circumferential crescents. However, we didn’t find a statistically significant association between the remission status and crescent percentage (P = 0.778), crescent type (P = 0.676), or morphology (P = 0.501). Similarly, alternative complement involvement (P = 0.341) and constitutional symptoms (P = 0.649) did not influence remission. Patients who achieved an 80% complete remission didn’t progress to CKD during the follow-up (P = 0.015). Table 2 depicts the clinical and statistical correlation of the histological types against the outcomes. Table 2 shows the crescent morphology and its relation to the remission rate, response to therapy, and prognosis.
Table 2.
| Clinical and Histological Characteristics | Remission Status | FE Value | P-Value c | ||
|---|---|---|---|---|---|
| No | Partial | Complete | |||
| Crescent (%) | 2.552 | 0.778 | |||
| < 25 (n = 5) | 1 (20) | 1 (20) | 3 (60) | ||
| 25 - 50 (n = 9) | 4 (57.1) | 1 (14.3) | 2 (28.6) | ||
| > 50 (n = 7) | 5 (55.6) | 1 (11.1) | 3 (33.3) | ||
| Crescent type | 3.173 | 0.676 | |||
| Cellular (n = 12) | 4 (33.3) | 2 (16.7) | 6 (50) | ||
| Cellular + Fibrous (n = 7) | 4 (57.1) | 1 (14.3) | 2 (28.6) | ||
| Fibrous (n = 2) | 2 (100) | 0 (0) | 0 (0) | ||
| Crescent morphology | 1.668 | 0.501 | |||
| Circumferential (n = 8) | 4 (50) | 2 (25) | 2 (25) | ||
| Non-circumferential (n = 13) | 6 (46.2) | 1 (7.7) | 6 (46.2) | ||
| Alternative complement involvement | 2.115 | 0.341 | |||
| No (n = 13) | 5 (38.5) | 3 (23.1) | 5 (38.5) | ||
| Yes (n = 8) | 5 (62.5) | 0 (0) | 3 (37.5) | ||
| Constitutional symptoms | 1.213 | 0.649 | |||
| No (n = 16) | 7 (43.8) | 2 (12.5) | 7 (43.8) | ||
| Yes (n = 5) | 3 (60) | 1 (20) | 1 (20) | ||
a Values are expressed as No. (%).
b Fisher-Freeman-Holtan exact test was used to compare the frequency between the groups.
c Not significant.
Figure 1 shows a circumferential cellular crescent in one of the patients, stained with Masson-Trichrome, while Figure 2 depicts a fibro-cellular crescent.
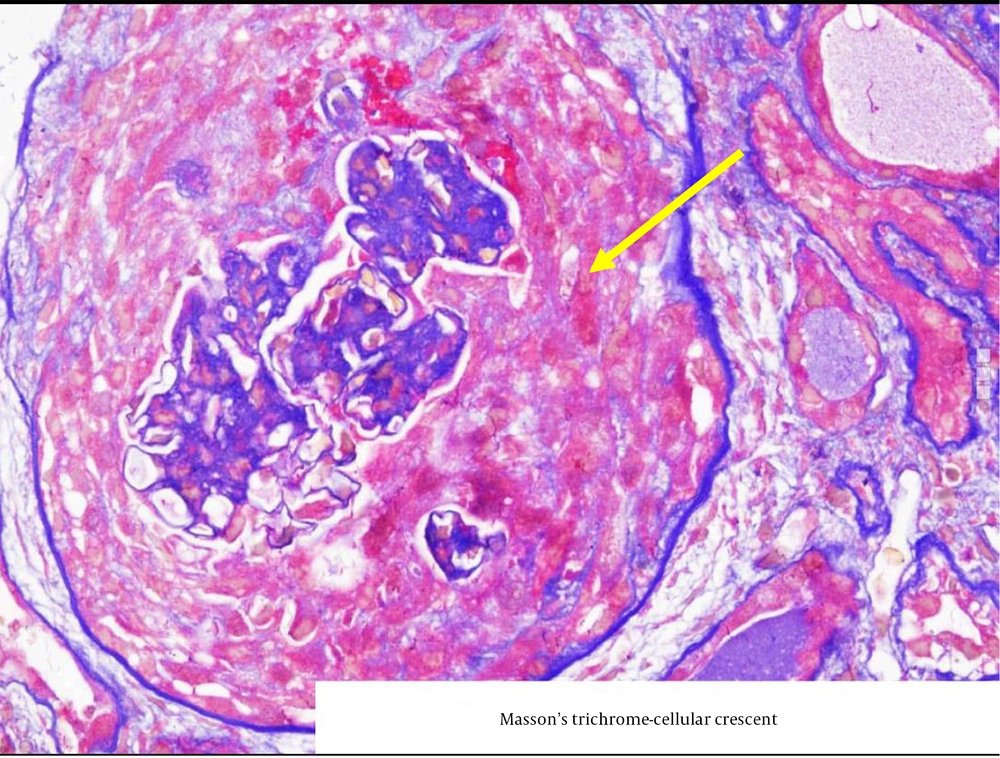
Figure 1.
Masson-trichrome stain showing a circumferential cellular crescent (the yellow arrow shows a circumferential crescent).
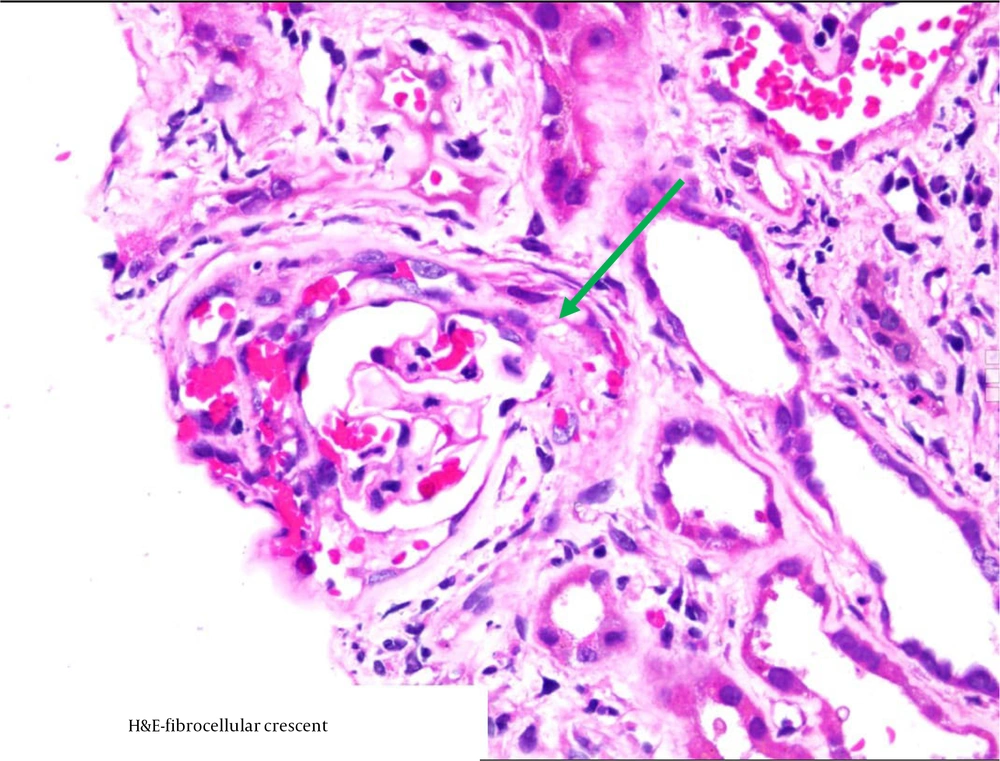
Figure 2.
The green arrow pointing at a fibro-cellular crescent in a patient (the stain is haematoxylin-eosin).
4.3. Alternative Complement Pathway Involvement in Our Patients and Its Prognostic Implications
There was a demonstrable involvement of the alternative complement pathway in 8 patients, evidenced by low serum C3 and C3 deposition in renal biopsy. We found a slight tendency towards partial remission and progression towards CKD in those with no involvement of the alternative pathway, but a thorough statistical analysis could not attach significance to the alternative pathway involvement and remission/overall prognosis. Table 3 depicts the above observations.
Table 3.
| Outcome Characteristics | Alternative Complement Pathway Involvement | FE Value | P-Value | |
|---|---|---|---|---|
| No | Yes | |||
| Remission status | 2.115 | 0.341 c | ||
| No (n = 10) | 5 (50) | 5 (50) | ||
| Partial (n = 3) | 3 (100) | 0 (0) | ||
| Complete (n = 8) | 5 (62.5) | 3 (37.5) | ||
| CKD progression in 3 months | 0.029 | 0.999 c | ||
| No (n = 10) | 6 (60) | 4 (40) | ||
| Yes (n = 11) | 7 (63.6) | 4 (36.4) | ||
| HD dependent | 7.289 | 0.014 d | ||
| No (n = 15) | 12 (80) | 3 (20) | ||
| Yes (n = 6) | 1 (16.7) | 5 (83.3) | ||
| Mortality | 0.359 | 0.999 c | ||
| No (n = 17) | 10 (58.8) | 7 (41.2) | ||
| Yes (n = 4) | 3 (75) | 1 (25) | ||
| Transplantation | 1.371 | 0.125 | ||
| Yes (n = 2) | 0 (0) | 2 (100) | ||
| No (n = 14) | 10 (71.4) | 4 (28.6) | ||
a Values are expressed as No. (%).
b Fisher-Freeman-Holtan exact test was used to compare the frequency between the groups.
c Not significant.
d Indicates P < 0.05 and considered statistically significant.
Figure 3 shows immunological staining of C3 in a patient in the study.
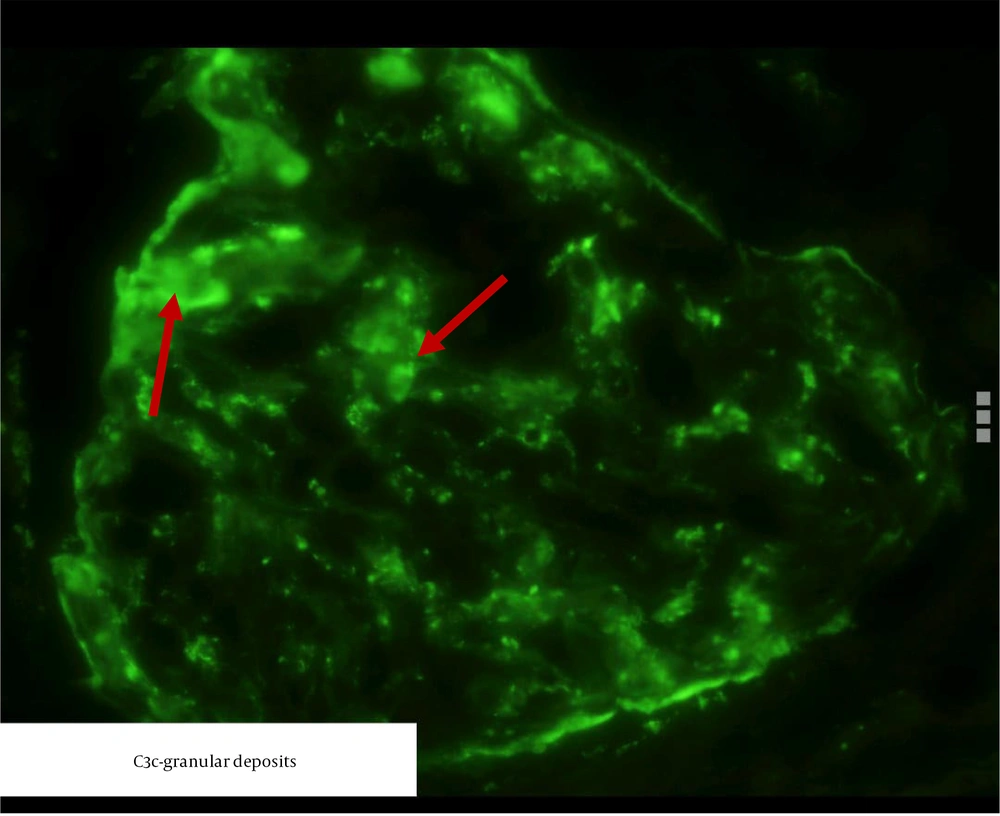
Figure 3.
Immunofluorescence showing C3 deposition (marked in red arrows).
4.4. Treatment and Outcome Comparisons
We observed a clinically visible and demonstrable higher remission rate among our patients with the combined therapy compared to those who received monotherapy. Table 4 portrays the treatment types and the outcome characteristics. Patients who were given both Rituximab and plasma exchanges achieved a higher and significant clinical remission than those receiving either one as monotherapy (7/12 = 58.3% vs. 1/3 = 33%). Statistically, this difference wasn’t significant, probably due to the small sample size.
Table 4.
| Outcome Characteristics | Type Of Therapy | FE Value | P-Value d | |
|---|---|---|---|---|
| Mono (N = 3) | Combined (N = 12) | |||
| Remission status | 0.976 | 0.999 | ||
| complete (n = 5) | 1 (20) | 4 (80) | ||
| Partial (n = 3) | 0 (0) | 3 (100) | ||
| No (n = 7) | 2 (28.6) | 5 (71.4) | ||
| CKD progression in 3 months | 0.069 | 0.999 | ||
| Yes (n = 9) | 2 (22.1) | 7 (77.8) | ||
| No (n = 6) | 1 (16.7) | 5 (83.3) | ||
| HD dependent | 1.364 | 0.516 | ||
| Yes (n = 4) | 0 (0) | 4 (100) | ||
| No (n = 11) | 3 (27.1) | 8 (72.7) | ||
| Mortality | 0.577 | 0.999 | ||
| Yes (n = 2) | 0 (0) | 2 (100) | ||
| No (n = 13) | 3 (23.1) | 10 (76.9) | ||
a Values are expressed as No. (%).
b Fisher-Freeman-Holtan exact test was used to compare the frequency between the groups.
c The two exclusive fibrous cases were excluded and four patients with cellular crescents were not willing for the therapy accounting for total of 15. Of this 12 received both plasma exchange and rituximab and 3 received either one.
d Not significant.
4.5. Factors Influencing Remission
The logistic regression model showed a good fit (pseudo-R2: 74.9 - 99.9%), but none of the examined factors — including crescent characteristics, therapy type, complement involvement, or baseline creatinine/proteinuria — significantly influenced remission (all P = 0.999). Despite the model’s predictive accuracy (100%), individual factors lacked statistical significance, possibly due to the small sample size. Table 5 tabulates the features.
Table 5.
Multivariate Logistic Regression to Predict the Factors that Influence Remission in Idiopathic Anti-neutrophil Cytoplasmic Autoantibodies-Negative Renal-Limited Pauci-immune Glomerulonephritis Patients
| Parameters | B | SE | Wald | df | P-Value | Adjusted Odds Ratio Exp (B) |
|---|---|---|---|---|---|---|
| Intercept | 118.1 | 71289 | < 0.001 | 1 | 0.999 | - |
| Baseline creatinine | -32.19 | 8286 | < 0.001 | 1 | 0.999 | - |
| Baseline proteinuria | -1.09 | 2607 | < 0.001 | 1 | 0.999 | - |
| Female gender | 76.6 | 23594 | < 0.001 | 1 | 0.999 | - |
| Crescent (< 25%) | 28.4 | 0.000 | < 0.001 | 1 | 0.999 | - |
| Crescent (25 - 50%) | 43.6 | 15920 | < 0.001 | 1 | 0.999 | - |
| Crescent (> 50%) | Reference | - | ||||
| Cellular crescent | 60.5 | 42238 | < 0.001 | 1 | 0.999 | - |
| Cellular + fibrosis crescent | 57.2 | 45927 | < 0.001 | 1 | 0.999 | - |
| Presence of constitutional symptoms | 88.4 | 24345 | < 0.001 | 1 | 0.999 | - |
| Presence of alternative completment involvement | -26.03 | 14997 | < 0.001 | 1 | 0.999 | - |
| Circumferential crescent | 85.2 | 23285 | < 0.001 | 1 | 0.999 | - |
| Plasma exchange | -131.4 | 31812 | < 0.001 | 1 | 0.999 | - |
| Rituximab therapy | 8.01 | 28551 | < 0.001 | 1 | 0.999 | - |
Binary logistic regression was performed by incorporating the independent factors (% of crescent, type and morphology of crescent, type of therapy, presence of constitutional symptoms, and alternative complement involvement), and covariates (baseline creatinine and baseline proteinuria values) that can predict/influence remission in idiopathic ANCA-negative renal-limited pauci-immune GN patients. Moreover, the model fitness was assessed using the chi-square test (χ2 = 29.065, df = 12, P = 0.004), indicating that a significant relationship exists between the dependent variable (remission) and the independent factors. Goodness of fit of the model was determined using Pearson (χ2 < 0.001, df = 8, P = 0.999) and deviance (χ2 < 0.001, df = 8, P = 0.999) methods, indicating that the model was a good fit. The predicting percentage of our logistic regression model was noted as 100% (classification table - 100%).
The degree of variation in the remission occurrence by the independent factors was assessed using Cox & Snell pseudo-R square (0.749), Nagelkerke pseudo-R square (0.999), and McFadden pseudo-R square (0.999). This indicates that the model accounts for 74.93% to 99.9% of the variance of the dependent factors by independent factors. Based on the Wald’s value and significance level noted for each factor, none of the factors influenced the remission occurrence in this study. Also, baseline creatinine and proteinuria did not influence the outcome.
Comparison of serum creatinine level at presentation with respect to remission status observed in idiopathic ANCA-negative renal-limited pauci-immune GN patients. Table 6 discusses the relation between baseline serum creatinine/proteinuria and the remission status. Baseline proteinuria and serum creatinine were compared to see the remission status. Data were expressed as median with interquartile range. The Kruskal-Wallis test with Dunn post hoc test was used to compare the mean rank between the three groups. Both factors were not found to be predictive of the remission status.
Table 6.
The Relation Between Baseline Serum Creatinine/Proteinuria and the Remission Status a
| Parameters | Remission Status | Mean Rank | Kruskal Wallis Statistic | P-Value b | ||
|---|---|---|---|---|---|---|
| No (N = 10) | Partial (N = 3) | Yes (N = 8) | ||||
| Serum creatinine (mg/dL) | 6.36 (4.7 - 8.9) | 5.9 (5.3 - 6.4) | 5.3 (3.8 - 6.5) | 12.9 vs 11.3 vs 8.4 | 2.364 | 0.321 |
| Proteinuria (g/d) | 3.5 (3.1 - 6.5) | 4.8 (4.6 - 4.9) | 4.7 (2.2 - 7.5) | 10.6 vs 12 vs 11.13 | 0.123 | 0.946 |
a Values are expressed as median (IQR).
b Not significant.
5. Discussion
The ANCA-negative pauci-immune GN is a rare subgroup within the vasculitides and is recognized as a distinct disease entity from its ANCA-positive counterpart. Currently, patients with ANCA-negative vasculitis have mostly been excluded from clinical research, thus posing difficulties in managing the affected patients due to limited information. Shah et al. identified 74 adult American patients between 1995 and 2009 with the diagnosis of pauci-immune GN, of which 23% were ANCA-negative (14). Similarly, in a cohort study by Floyd et al., 22% of them were ANCA-negative (15). In a 10-year retrospective analysis, Hedger et al. found the incidence of ANCA-negative pauci-immune crescentic GN to be approximately 10 - 30% (16). While the proportion of ANCA-negative patients in these studies was similar, it was lower than that reported by Chen et al. (6). The present study, which was not comparative, included 21 adult patients with crescentic GN who were ANCA-negative.
The present study dealt with an Asian patient population with a mean age of 43.67 ± 12.3 years. This age was comparable to that of the patients studied in the Asian cohort by Chen et al. but younger than the American cohort, where the median age was 60 years (14). These age differences may be attributed to environmental or genetic factors. Regarding gender, the current study found that males were predominantly affected in this spectrum, aligning with previous findings (6, 14).
In terms of clinical outcomes, more than half of the participants included in the present study achieved remission. Notably, a higher percentage of patients who received plasma exchange and rituximab therapy achieved complete or partial remission. Shah et al. observed remission among 94% of ANCA-negative American patients (14). Chen et al. found that 72% of patients who were treated with corticosteroids along with intravenous cyclophosphamide achieved either complete or partial remission (6). These findings underscore the importance of early aggressive intervention therapy in managing this condition. Therefore, prompt administration of appropriate treatment after diagnosis is essential to ensure effective management.
In the present study, more than half of our patients progressed to CKD within three months. Two of those who progressed to CKD underwent renal transplantation. Floyd et al. showed an increased risk of end-stage kidney disease in ANCA-negative patients compared to those with seropositive disease (15). According to Shah et al., 41% of the ANCA-negative patients developed end-stage renal disease, and two of them had renal transplants. Similar to the present study, none of the patients experienced relapse following transplantation (14). One death occurred in the ANCA-negative group within the first year of diagnosis.
Several studies reported a lower rate of extrarenal manifestations with more severe and chronic glomerular lesions at presentation in their respective cohorts (6, 10, 17). However, Hedger et al. did not find any significant differences between ANCA-negative and ANCA-positive patients concerning glomerular morphology lesions (16).
In the current study, 9 out of 21 patients presented with chronic lesions, while 2 patients initially presenting with predominantly acute lesions progressed to the chronic stage despite intensive treatment. Most patients exhibited no constitutional symptoms at diagnosis, as found in the study by Floyd et al. (15). Moreover, Eisenberger et al. noted significant neutrophil infiltration in the glomerular lesions of individuals with ANCA-negative disease (17). The present study also observed extensive neutrophil infiltration in more than 50% of the sampled glomeruli, predominantly presenting with cellular crescents. This finding supports the role of activated neutrophils in ANCA-negative crescentic GN, as reported in ANCA-associated disease.
The pathophysiology of ANCA-negative crescentic GN is not precisely known and remains a topic of debate. Some authors, like Peschel et al., have proposed that these patients may possess different autoantibodies other than circulating ANCA, such as anti–LAMP-2 and anti-tissue plasminogen activator, which could potentially cause disease (18). However, this explanation requires further investigation to validate. Others, like Rowaiye et al., have suggested that ANCA-negative patients have circulating autoantibodies capable of activating monocytes and neutrophils (19). The inability to detect these autoantibodies might be due to the lower detection limits of current assays or the masking of their detection by epitopes.
To date, no major studies have been undertaken that directly link the involvement of the alternative complement pathway in the development of ANCA-negative crescentic GN. The present study noted a reduction in serum C3 levels alongside widespread positivity of C3c in the glomerular capillary loops and the mesangium, indicating no classical complement pathway involvement. Further research is required to investigate the role of other complement pathways in ANCA-negative crescentic GN, which could potentially lead to the development of new therapeutic medications.
5.1. Conclusions
The ANCA-negative crescentic GN is a rare yet significant cause of acute renal failure in adult patients, accounting for 5 - 10% of crescentic GN. The alternative complement pathway could have a major role in the pathogenesis of ANCA-negative crescentic GN, thus opening a new horizon for anti-complement antibodies in the treatment of the same in the near future. In our present study, we thoroughly elucidated the clinical, demographic, and prognostic implications of this distinctive group of crescentic GN in detail. In addition, we demonstrated the possible involvement of the alternative complement pathway in the very same cohort.
5.2. Limitations
The limitations of this study include a small sample size and a lack of comparative study between the above spectrum and ANCA-positive and other forms of crescentic GN. Hence, further large-scale studies are required to deepen the understanding of the pathogenesis of this glomerular disease. This will aid in better management of affected individuals and help lower the mortality rate worldwide.