


1. Background
2. Objectives
3. Materials and Methods
3.1. Drugs
3.2. Animals
3.3. Experimental Protocol
3.4. Measurements
3.5. Histopathological Procedures
3.6. Statistical Analysis
4. Results
4.1. Effect of Mg on CP-Induced Nephrotoxicity
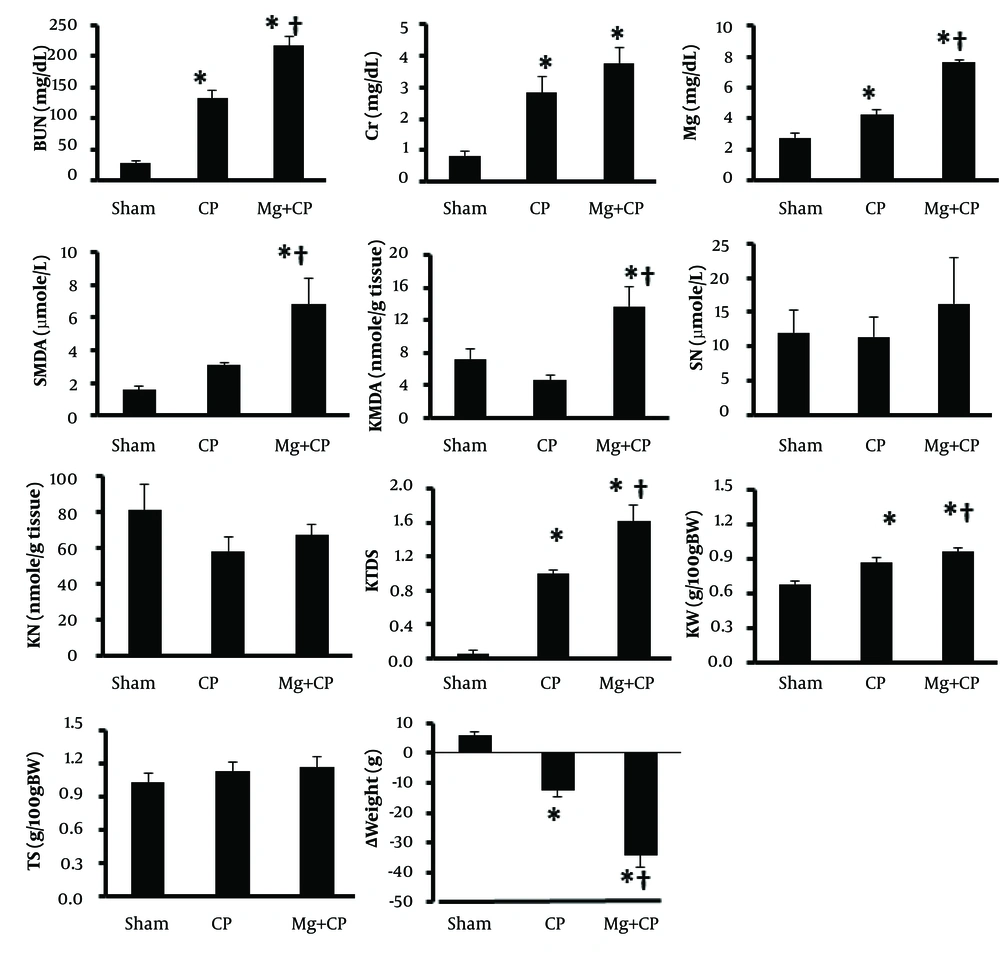
The data is reported as mean ± SEM. * and † indicate significant difference from the Sham and CP groups, respectively (P < 0.05). BUN: blood urea nitrogen, Cr: creatinine, SMDA: serum malondialdehyde, Mg: magnesium, SN: serum nitrite, KMDA: kidney MDA, KN: kidney nitrite, KTDS: kidney tissue damage score, KW: kidney weight per 100 g body weight, TS: testis weight per 100 g body weight, ∆Weight: body weight change, D: diabetic rats, D + CP: diabetic rats treated with cisplatin (CP), D + Mg: diabetic rats treated with magnesium (Mg), and D + Mg + CP: diabetic rats treated with the combination of Mg and CP.
4.2. Effect of Mg and STZ-Induced Diabetes on CP-Induced Nephrotoxicity
| Group | BUNa (mg/dL) | Cra (mg/dL) | SMDAa (µmole/L) | KMDAa (nmole/g tissue) | Mga (mg/dL) | SNa (µmole/L) | KNa (nmole/g tissue) | KTDSa | KWa (g/100gBW) | TSa (g/100gBW) | ∆Weighta (g) |
|---|---|---|---|---|---|---|---|---|---|---|---|
| D b | 49.6 ± 4.3 | 0.87 ± 0.11 | 7.4 ± 1.4 | 4.7 ± 0.8 | 4.4 ± 0.5 | 16.4 ± 5.3 | 70.4 ± 9.8 | 0.2 ± 0.1 | 1.00 ± 0.03 | 1.10 ± 0.05 | -8.1 ± 1.78 |
| D + CP c | 50.5 ± 8.5 | 0.93 ± 0.17 | 6.3 ± 1.6 | 5.6 ± 1.4 | 3.6 ± 0.5 | 10.7 ± 2.4 | 79.4 ± 11.4 | 0.3 ± 0.2 | 1.04 ± 0.05 | 1.17 ± 0.12 | -18.1 ± 3.15h,i |
| D + Mg d | 42.4 ± 3.1 | 1.01 ± 0.18 | 7.2 ± 2.1 | 5.5 ± 1.4 | 3.2 ± 0.4 | 17.2 ± 7.3 | 42.4 ± 3.1g,h | 0.2 ± 0.2 | 0.96 ± 0.03 | 1.22 ± 0.11 | -1.0 ± 4.81 |
| D + Mg + CP e | 99.3 ± 11.1f | 1.20 ± 0.42 | 5.4 ± 1.4 | 6.0 ± 1.5 | 4.8 ± 0.8 | 23.1 ± 7.7 | 51.4 ± 8.3h | 0.7 ± 0.2f | 0.98 ± 0.04 | 1.07 ± 0.09 | -19.6 ± 2.14h,i |
aAbbreviations: BUN; blood urea nitrogen, Cr; creatinine, KMDA; kidney MDA, KN; kidney nitrite, KTDS; kidney tissue damage score, KW; kidney weight, Mg; magnesium, SN; serum nitrite, SMDA; serum malondialdehyde, TS; testis weight, ΔWeight; body weight change
bD; diabetic rats
cD + CP: diabetic rats treated with Cisplatin (CP)
dD + Mg: diabetic rats treated with magnesium (Mg)
eD + Mg + CP: diabetic rats treated with the combination of Mg and CP
fIndicates significant difference from others groups (P < 0.05).
gIndicate significant difference from D + CP group
hIndicate significant difference from D group
iIndicate significant difference from D + Mg group (P < 0.05)
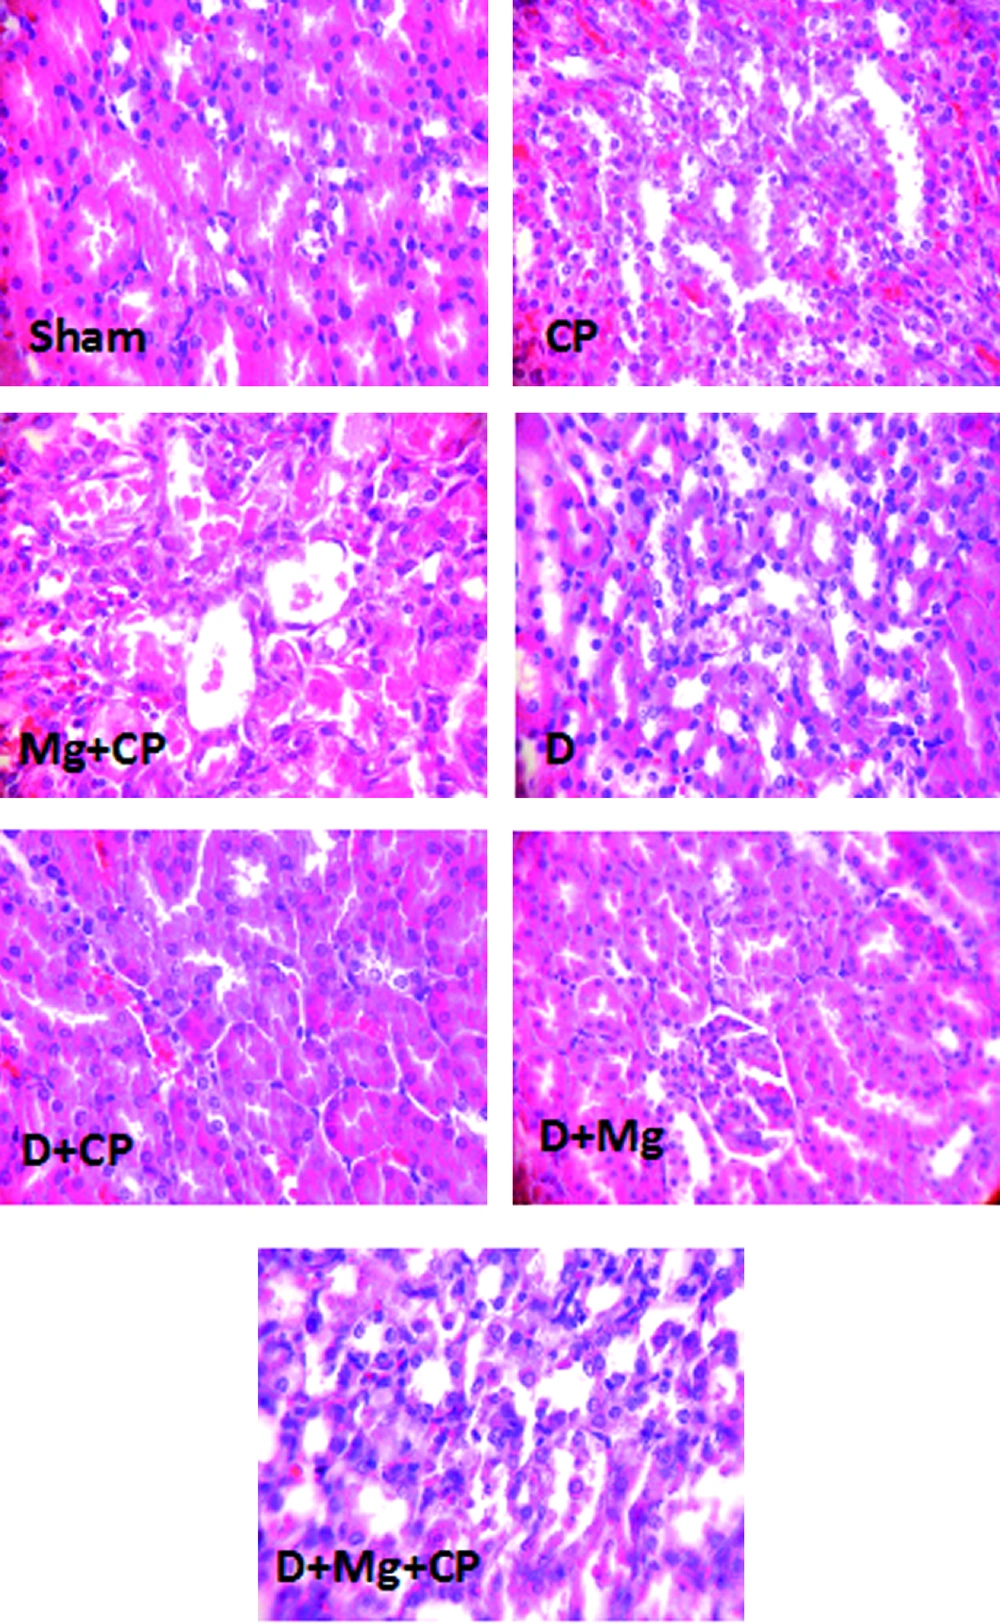
The Images of Kidney Tissues (Magnification x 100) in Sham, Cisplatin (CP) Alone Treated, Magnesium Plus CP (Mg + CP) Treated, Diabetic rats (D), Diabetic rats Treated With CP (D + CP), Diabetic Rats Treated With Mg (D + Mg), and Diabetic Rats Treated With the Combination of Mg and CP (D + Mg + CP). More Kidney Tissue Damage Was Observed in Mg + CP and D + Mg + CP Groups, While no Damage Was Detected in the Sham and D Groups.
