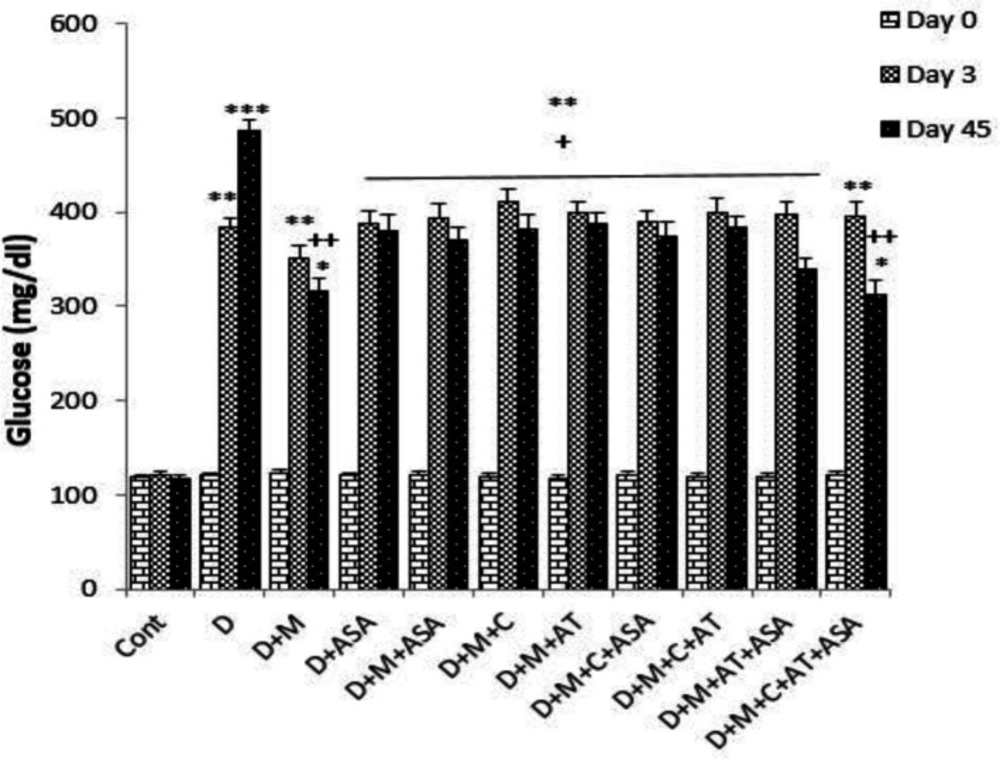
Fasting blood glucose
Fasting serum glucose levels on days 3 and 45 in the non-treated diabetic group (
i.e., group D) and in groups that received different combinations of metformin, aspirin, atorvastatin, and captopril, were significantly higher than that of the control group (
p < 0.001 for the non-treated diabetic group on day 45,
p < 0.01 for the non-treated diabetic group on day 3 and also for groups that received different combinations of drugs on days 3 and 45,
p < 0.05 for D + M and D + M + C + AT + ASA groups on day 45). On day 45, fasting serum glucose levels in all drug-treated groups were significantly lower than that of the diabetic group (
p < 0.01 for D + M + C + AT + ASA and D + M groups and
p < 0.05 for other drug-treated groups, as compared to the diabetic group). There was no significant difference in serum glucose levels between the groups that received different combinations of these four drugs (
Figure 1).
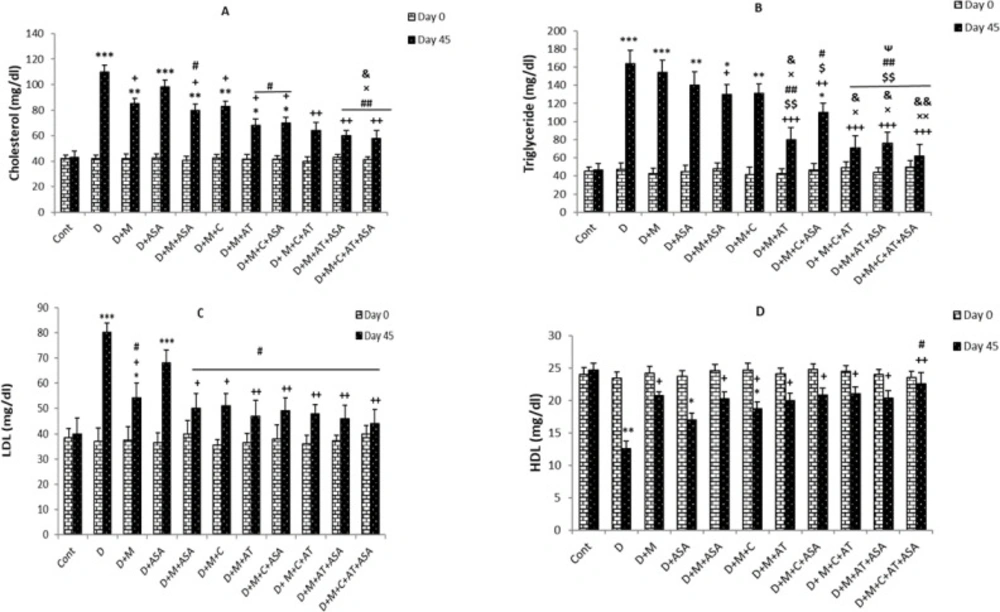
Serum lipid profile
On day 45, serum cholesterol levels in the non-treated diabetic group were significantly higher than the control group (
p < 0.001). All drug-treated groups, except the aspirin-only-treated group, showed significant decreases in serum cholesterol levels compared to the non-treated diabetic group (
p < 0.05 for groups that received one or two drugs but
p < 0.01 for groups that received combinations of three or four drugs). Also, cholesterol levels in groups that received combinations of three or four drugs (
i.e., D + M + C + ASA, D + M + C + AT, D + M + AT + ASA, and D + M + C + AT + ASA groups) showed significant decreases compared to groups that received one or two drugs (
p < 0.05 and
p < 0.01 compared to ASA group,
p < 0.05 compared to D + M + ASA group and
p < 0.05 compared to D + M + C group). Among the three groups that received combinations of two drugs, significant decreases in serum cholesterol levels were only observed in the D + M + ASA and D + M + AT groups, compared to the D + ASA group (
Figure 2A).
The results showed significant increases in serum triglyceride levels in the non-treated diabetic group compared to the control group on day 45 (
p < 0.001); however, serum triglyceride levels in groups that received combinations of three or four drugs were significantly lower than those of non-treated diabetic group (
p < 0.01 to
p < 0.001). Among the three groups treated with combinations of two drugs, only the D+M+AT group showed significant decreases in serum triglyceride levels compared to the non-treated diabetic group (
p < 0.001). Also, triglyceride levels in groups that received combinations of three or four drugs (
i.e., D + M + C + ASA, D + M + C + AT, D + M + AT + ASA, and D + M + C + AT + ASA groups) and D + M + AT group were significantly reduced as compared to groups treated with one medication or combinations of two drugs (
p < 0.05 and
p < 0.01 compared to D + M, D + ASA, D + M + ASA and D + M + C groups) In D + M + C + AT, D + M + AT + ASA, and D + M + C + AT + ASA groups, there were significant decreases in serum triglyceride levels compared to the D + M + C + ASA group (
Figure 2B).
On day 45, serum LDL- cholesterol levels were significantly higher in non-treated diabetic (
p < 0.001) and D+M groups (
p < 0.05) compared to the control group. All drug-treated groups, except the aspirin-only-treated group, showed significant decreases in serum LDL- cholesterol levels compared to the non-treated diabetic group (
p < 0.05 for groups that received one or two drugs and
p < 0.01 for groups that received combinations of three or four drugs and D + M + AT group compared to the diabetic group). Also, LDL- cholesterol levels in all groups treated with different combinations of drugs were significantly lower compared to the ASA-only-treated group (
p < 0.05) (
Figure 2C).
Serum HDL- cholesterol levels on day 45, were significantly lower in non-treated diabetic (
p < 0.01), D + ASA (
p < 0.05) and D + M + C groups (
p < 0.05) compared to the control group. All drug-treated groups, except the aspirin-only-treated group, showed significant increases in serum HDL- cholesterol levels compared to the non-treated diabetic group (
p < 0.01 for the group that received a combination of four drugs and
p < 0.05 for other drug-treated groups compared to the non-treated diabetic group). Also, HDL- cholesterol levels showed significant increases in the group who received a combination of four drugs (D + M + C + AT + ASA group) compared to the ASA-only-treated group (
p < 0.05) (
Figure 2D).
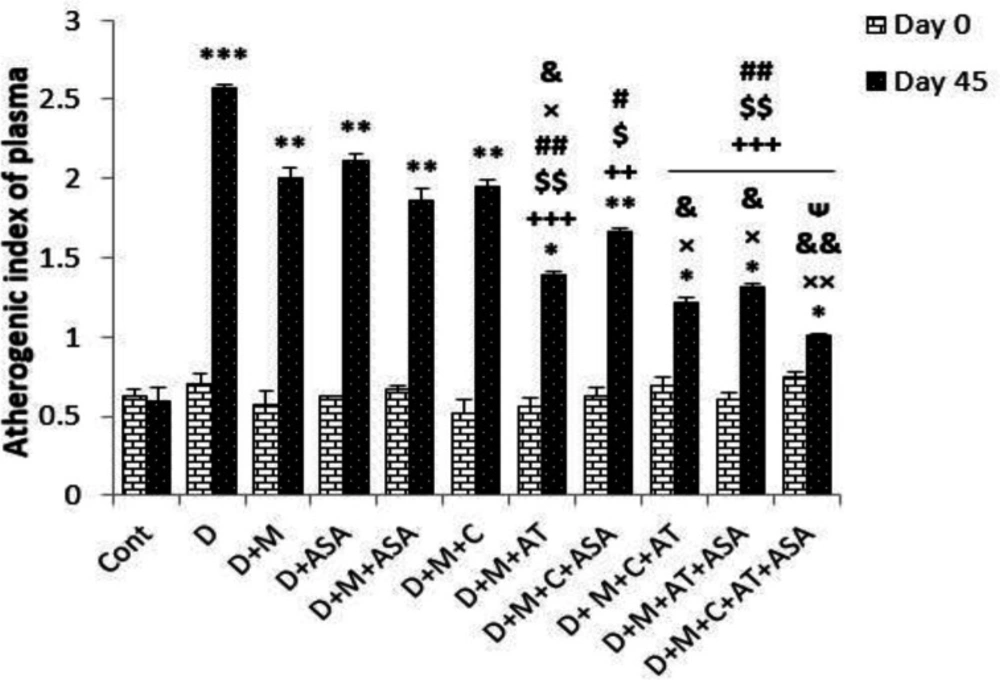
Atherogenic index of plasma
Atherogenic index of plasma (AIP) in the non-treated diabetic group and in all groups that received different combinations of metformin, aspirin, atorvastatin, and captopril, was significantly higher than that of the control group (
p < 0.001 for the non-treated diabetic group,
p < 0.01 for all groups that received combinations of two or one drugs and D + M + C + ASA group,
p < 0.05 for groups that received combinations of three or four drugs and D + M + AT group) compared to the control group on day 45 (
p < 0.001); however, groups that received combinations of three or four drugs showed significantly lower AIP compared to non-treated diabetic group (
p < 0.01 to
p < 0.001). Among groups that received combinations of two drugs, only the D + M + AT group had significantly reduced AIP compared to the non-treated diabetic group. Also, groups that received combinations of three or four drugs (
i.e., D + M + C + ASA, D + M + C + AT, D + M + AT +ASA, and D + M + C + AT + ASA groups) and D + M + AT group had significantly decreased AIP compared to groups that received one or combinations of two drugs (
Figure 3).
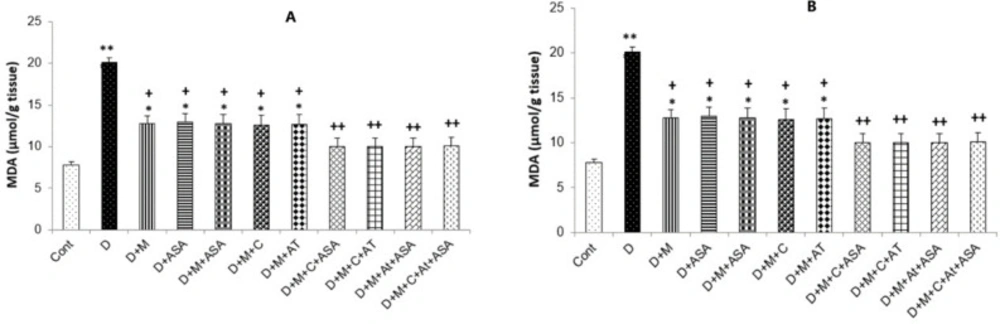
Malondialdehyde levels
Malondialdehyde (MDA) levels in the heart and kidney tissues were collected from the non-treated diabetic group (
p < 0.001 and
p < 0.01, respectively) and in groups that received one or combinations of two drugs (
p < 0.05), were significantly higher than those of the control group. All drug-treated groups showed significantly lower MDA levels compared to the non-treated diabetic group (
p < 0.05 for groups that received one or combinations of two drugs and
p < 0.01 for groups that received combinations of three or four drugs) (
Figure 4A and 4B).
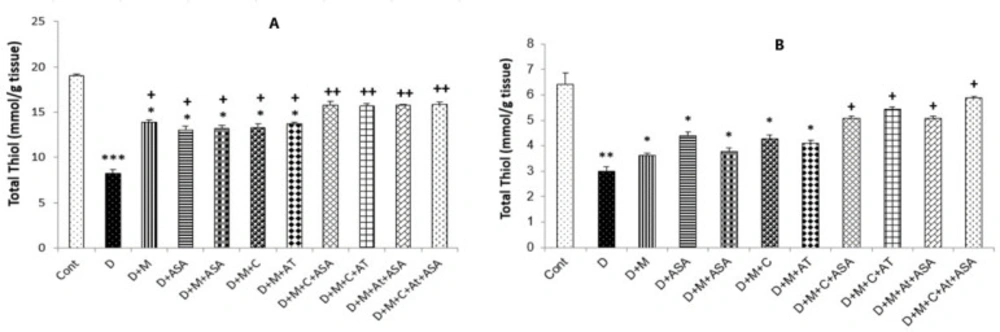
Total thiol concentrations
Total thiol concentrations in the heart and kidney tissues collected from the non-treated diabetic group (
p < 0.001 and
p < 0.01, respectively) and in groups that received one or combinations of two drugs (
p < 0.05) were significantly lower than those of the control group. Total thiol concentrations in the heart tissue of all drug-treated groups were significantly higher compared to the non-treated diabetic group (
p < 0.05 for groups that received one or combinations of two drugs and
p < 0.01 for groups that received combinations of three or four drugs). In the kidney tissue, only in groups that received combinations of three or four drugs, significantly lower levels of total thiol were observed as compared to the non-treated diabetic group (
p < 0.05) (
Figures 5A and 5B).
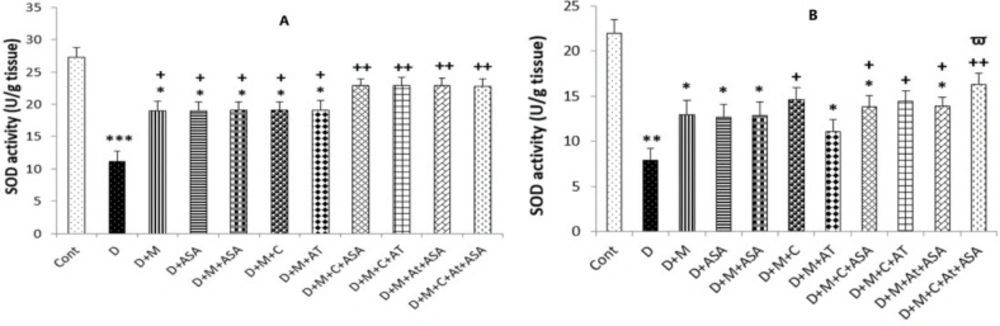
SOD and CAT activities
The SOD and CAT activities in the heart and kidney tissues of the non-treated diabetic group were significantly lower compared to the control group (p < 0.001 and p < 0.01, respectively). The heart tissues collected from all drug-treated groups had incredibly high levels of SOD activity compared to the non-treated diabetic group (p < 0.05 for groups that received one drug or combinations of two medications and p < 0.01 for groups that received combinations of three or four medications as compared to the diabetic group). In the kidney tissue obtained from groups that received combinations of three or four drugs and the D + M + C group, SOD activity was significantly increased compared to the non-treated diabetic group (p < 0.05 for D + M + C + AT + ASA group and p < 0.05 for other groups as compared to the diabetic group).
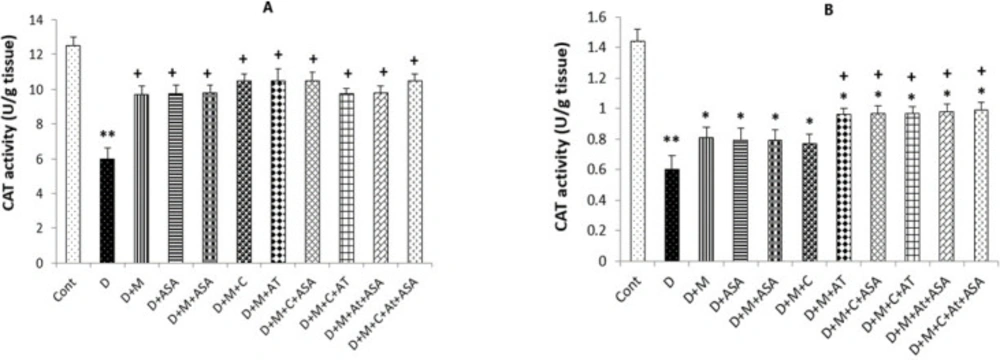
Also, significantly higher CAT activity was determined in the heart tissue collected from all drug-treated groups compared to the non-treated diabetic group (
p < 0.05); however, only kidney tissues collected from groups that received combinations of three or four medications presented significant increases in CAT activity compared to the diabetic group (
p < 0.05) (
Figures 6A, 6B,
7A and 7B).