


1. Background
Anemia is one of the most common complications of end-stage renal disease (ESRD). About 90% of patients have anemia (1), which is associated with increased cardiovascular and all-cause mortality and diminished quality of life and exercise tolerance (2). With advent of erythropoiesis-stimulating agents (ESAs), there has been a significant improvement in the side effects of anemia and the need for blood transfusion. However, a substantial number of ESRD patients have reduced response to ESAs. ESA hyporesponsiveness is defined as failure to reach the recommended target hemoglobin despite high doses of ESA or requiring high doses to maintain the target hemoglobin. ESA hyporesponsiveness has a negative impact on dialysis patients’ survival (3). On the other hand, increasing doses of ESAs are needed among patients with resistance that had been proven to be dangerous and associated with higher mortality rate (4).
The various factors have been associated with ESA hyporesponsiveness in different studies, such as: iron deficiency, secondary hyperparathyroidism, inadequate dialysis, inflammation, malnutrition, drugs such as angiotensin converting enzyme inhibitors (ACEi), angiotensin receptor blockers (ARBs), and neutralizing antibodies to ESAs (5-7).
Thus, far different definitions and indices have been proposed for ESA hyporesponsiveness. The Kidney disease outcomes quality initiative (KDOQI) Guidelines describe ESA hyporesponsiveness as a continued need for greater than 300 IU/kg per week EPO subcutaneously. As hemoglobin response is not included in this definition, various studies assessed ESA hyporesponsiveness by using the ESA hyporesponsiveness index (EHRI). EHRI is calculated by dividing weekly ESA dose per kilogram of body weight (IU/Kg/W) by hemoglobin level (g/dL). EHRI is an easily calculated index, which has direct relation with mortality in dialysis patients (8, 9).
We conducted this study to determine the risk factors of ESA hyporesponsiveness among hemodialysis patients in Tehran, Iran.
2. Methods
2.1. Patients and Data Collection
In a multicenter cross-sectional study, from January 2015 to May 2015, point-prevalent hemodialysis patients from 22 dialysis centers in Tehran, Iran, were enrolled to evaluate erythropoietin resistance and the associated factors.
Patients older than 18 years old undergoing hemodialysis for atleast 3 months before the study were enrolled. Those with history of hematologic disorders such as thalassemia, sickle cell disease, MDS, and hematologic and solid organ active malignancies were excluded.
The study was approved by the ethics committee of chronic Kidney disease research center (CKDRC), Shahid Beheshti University of Medical Sciences. Informed consents were obtained.
Demographic data, cause of ESRD, time on dialysis, and dose of ESAs (Unit/week), type and dose (mg/week) of iron preparation and other medications (ACEi, ARBs, statins) during the period of the study were recorded.
Three consecutive monthly laboratory records of patients were collected by trained nurses and data were entered to specifically designed software. We used mean hemoglobin level and erythropoietin dose during the 3-month period of evaluation.
We also calculated erythropoietin hyporesponsiveness index (EHRI) to adjust the weekly dose of erythropoietin for hemoglobin level. EHRI was calculated by dividing weekly ESA dose per kilogram of body weight (IU/Kg/W) by hemoglobin level (g/dL).
Factors associated with erythropoietin resistance were evaluated; data on mineral bone disease (corrected serum calcium, phosphorus, intact PTH), iron status (serum iron, total iron binding capacity (TIBC), Ferritin), dialysis adequacy (Pre and post blood urea nitrogen, spKt/V), malnutrition (body mass index (BMI), serum albumin, total cholesterol) and inflammation (C-reactive protein (CRP)) were recorded.
Based on EHRI, we divided patients into four quartiles, and those within the upper quartile were demarcated as erythropoietin hyporesponsiveness and were compared with others in order to identify the impact of different factors on ESA response.
2.2. Statistical Analysis
Data were presented as mean ± standard deviation for quantitative variables and summarized as frequencies and percentages for categorical variables. Quantitative and qualitative variables were analyzed by t-test and chi square, respectively. Multivariate logistic regression was also performed. For the statistic analysis, SPSS software (version 21) was used. P values less than 0.05 were considered significant.
3. Results
3.1. The Baseline Demographic Characteristics
Out of 1302 patients in 22 hemodialysis centers in Tehran province, 1224 met the criteria and agreed to participate in the study. The baseline characteristics and demographic data of patients are shown in Table 1.
Table 1. The Baseline Characteristics and Demographic Data
| Parameters | N = 1224 |
|---|---|
| Age, mean (SD), y | 57.5 (11.38) |
| Male gender, % | 59.6 |
| Post dialysis weight, Kg, mean (SD) | 66.9 (39.6) |
| BMI, Kg/m2, mean (SD) | 23.9 (3.8) |
| Diabetes, % | 36.6 |
| Dialysis vintage, month mean (SD) | 42.31 (43.22) |
| Kt/V, mean (SD) | 1.21 (0.24) |
| Hemoglobin, g/dL, mean (SD) | 10.79 (1.5) |
| ESA dose, IU/Kg/W, mean, (SD) | 131.86 (101.22) |
| EHRI, IU/Kg/W/g/dL, mean (SD) | 12.87 (11.38) |
| ESA dose > 300 IU/Kg/W, % | 5.2 |
| Albumin, g/dL, mean (SD) | 3.95 (0.5) |
| iPTH, pg/mL, mean (SD) | 250.38 (235.34) |
| Ferritin, ng/mL, mean (SD) | 365.6 (288.2) |
| Calcium, mg/dL, mean (SD) | 8.7 (0.7) |
| Phosphorus, mg/dL, mean (SD) | 5.2 (1.1) |
| Positive CRP, % | 32.7 |
| ACEi and/or ARB use, % | 19.8 |
| Statin use, % | 15.8 |
Abbreviations: ACEi, Angiotensin Converting Enzyme Inhibitor; ARB, Angiotensin II Receptor Blocker; BMI, Body Mass Index; CRP, C-Reactive Protein; EHRI, ESA Hyporesponsive Index; ESA, Erythropoiesis-Stimulating Agents; iPTH, Intact Parathormone.
The mean age of patients was 57.5 ± 14.9 years, and 59.6% of them were male. Dialysis vintage was 42.31 ± 43.22 months. Cause of ESRD was diabetes in 36.6% of the cases. Mean Kt/V was 1.2 ± 0.24.
On the aspect of anemia status, mean hemoglobin level was 10.79 ± 1.5 g/dL with 28.6% of patients having hemoglobin level below 10 g/dL despite receiving ESA dose of 10712.64 ± 7136.94 IU/W.
The type of ESAs provided to patients was as follows: PDpoietin (erythropoietin alpha) in 92.09%, CinnaPoietin (erythropoietin beta) in 4.74%, and Exipoetin (erythropoietin alpha) in 3.17% of patients. All the centers used the subcutaneous route of administration, which was under supervision of the staff.
Mean EHRI was 12.87 ± 11.38 IU/Kg/W per g/dL in this cohort. Patients with a hemoglobin level less than 10 g/dL had EHRI of 19.5 ± 15.63 IU/Kg/W per g/dL.
Patients were divided into 4 groups according to EHRI quartiles. (Q1: ≤ 5.96, Q2: 5.97 - 10.47, Q3: 10.48 - 16.48, Q4: ≥ 16.49). Patients in the 4th quartile were labeled as hyporesponsive patients (N = 306 (25%) patients). About 48% of patients with hemoglobin less than 10 g/dL were categorized in the fourth quartile (Figure 1).
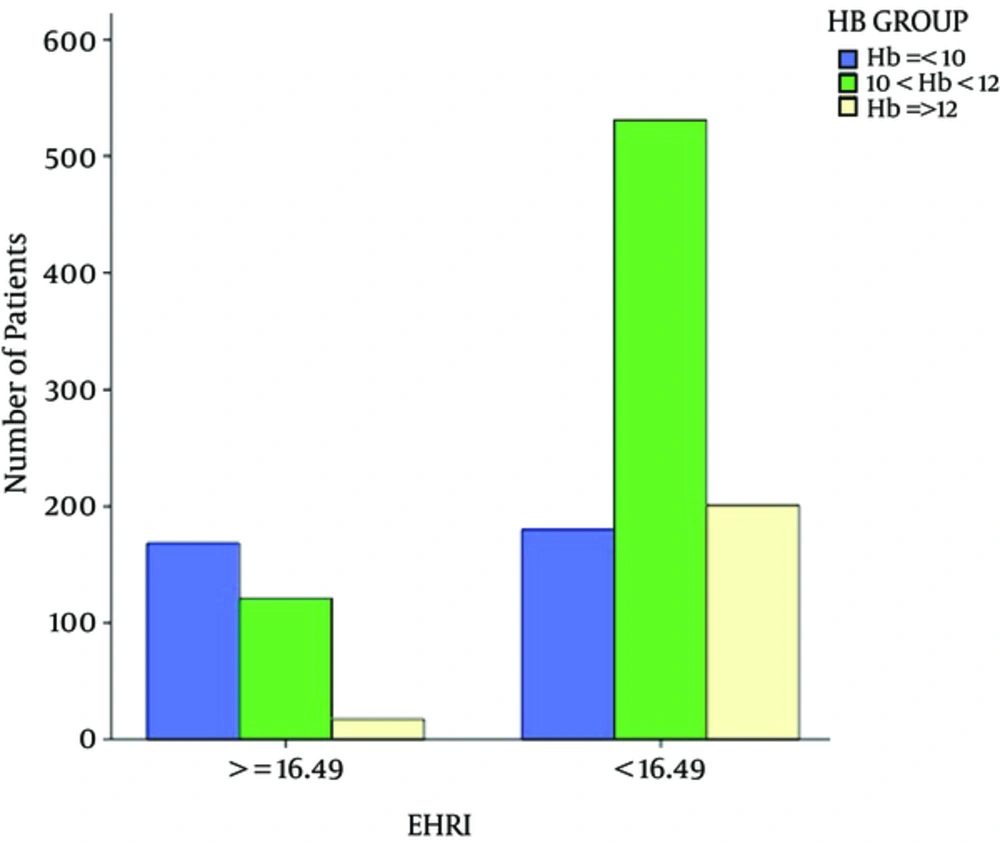
Figure 1.
Frequency of Hyporesponsiveness (EHRI 16.49) Among Different Hemoglobin Groups
ESA resistance was found in 5.2% of patients when the KDOQI definition was used.
In order to identify factors associated with decreased erythropoietin response among hemodialysis population, we compared patients who were in 4th quartile (EHRI ≥ 16.49) with those who had lower EHRI. Table 2 demonstrates the findings.
Table 2. Clinical and Laboratory Parameters of Responsive (EHRI < 16.49) and Hyporesponsive Patients (EHRI ≥ 16.49)
| Parameters | EHRI < 16.49 (N = 918) | EHRI ≥ 16.49 (N = 306) | P Value |
|---|---|---|---|
| Age , mean (SD), y | 57.4 (14.7) | 58 (15.8) | 0.5 |
| Male gender, % | 59 | 61.1 | 0.54 |
| Dialysis vintage, mean (SD). mo | 42.6 (44.3) | 41.5 (39.9) | 0.7 |
| History of Diabetes, % | 37.2 | 34.6 | 0.45 |
| BMI, mean (SD), Kg/m2 | 24.4 (3.7) | 22.5 (3.6) | < 0.001 |
| Kt/V > 1.4, % | 20.8 | 25.9 | 0.26 |
| Kt/V, mean (SD) | 1.2 (0.2) | 1.24 (0.3) | 0.025 |
| Hemoglobin, mean (SD), g/dL | 11.1 (1.4) | 9.8 (1.4) | < 0.001 |
| ESA, mean (SD), IU/W | 6061 (3305) | 14944 (6533) | < 0.001 |
| Venofer dose, mean (SD), mg/W | 140.8 (207) | 202 (233) | < 0.001 |
| Ferritin, mean (SD), ng/dL | 368.5 (296.3) | 356.7 (262.2) | 0.54 |
| CRP, mean (SD) | 7.3(12.5) | 6.2 (0.5) | 0.11 |
| Albumin, mean (SD), g/dL | 4 (0.5) | 3.9 (0.5) | 0.027 |
| iPTH, mean (SD), pg/mL | 251.4 (238.4) | 247.5 (226.2) | 0.8 |
| Serum calcium, mean (SD), mg/dL | 8.7 (0.74) | 8.7 (7.2) | 0.11 |
| Serum phosphorus, mean (SD), mg/dL | 5.2 (1.15) | 5 (1.1) | 0.007 |
| ACEi and/or ARB use, % | 18.2 | 24.5 | 0.02 |
| Statin use, % | 15.7 | 16 | 0.92 |
Abbreviations: ACEi, Angiotensin Converting Enzyme Inhibitor; ARB, Angiotensin II Receptor Blocker; BMI, Body Mass Index; CRP, C-Reactive Protein; EHRI, ESA Hyporesponsive Index; ESA, Erythropoiesis-Stimulating Agents; iPTH, Intact Parathormone.
There were no significant differences in age, gender, and dialysis vintage between these two groups. Those who had proper response to ESAs had higher BMI (24.4 ± 3.7 vs. 22.5 ± 3.6 Kg/m2, P < 0.001) and serum albumin level (4 ± 0.5 vs. 3.9 ± 0.5, P < 0.05). There was no significant difference in the brand or the type of ESA between the groups.
In the view of dialysis adequacy, there was no significant difference in percentage of patients who had reached the target Kt/V of 1.4 between the two groups (20.8% vs. 23.9%, P = 0.12), but mean of Kt/V was higher in hyporesponsive patients (1.24 ± 0.3 vs. 1.2 ± 0.2 in responsive group, P < 0.05).
Although both groups had similar serum ferritin level (368.9 ± 296.3 vs. 356.7 ± 262.2 ng/mL), patients with higher EHRI received greater doses of Venofer (202 ± 233 vs. 140.8 ± 207, P < 0.001).
The incidence of inflammation (as evaluated by CRP), statin use (as an anti-inflammatory agent) and secondary hyperparathyroidism (iPTH > 300 pg/mL) was not significantly different between the groups (P > 0.05).
Higher portion of patients in the hyporesponsiveness group were using ACEi and/or ARBs compared to the group with more proper response (P < 0.05).
A logistic regression model consisting of Venofer dose (P = 0.0001), Kt/V (P = 0.02), phosphorus (P = 0.003), and anemia (P = 0.0001) showed 77.6% accuracy in classification for EHRI as the dependent variable (R2 = 0.20, B = 1.10 (se = 0.07), P = 0.0001). There was a negative relationship between resistance and Kt/V. Also, the association of Venofer dose with the resistance was negative. Phosphate level was directly associated with the presence of resistance. Other variables such as age, gender, diabetes, CRP, statin, and albumin were not independent determinants for EHRI. Treatment with ACE/ARB was a marginally significant factor for EPO resistance (P = 0.06) (Table 3).
Table 3. Multiple Logistic Regression Analysis results
| Variables | OR (95%CI) | Wald | df | P |
|---|---|---|---|---|
| Venofer dose | 0.999 | 15.349 | 1 | 0.0001 |
| Kt/V | 0.511 | 5.198 | 1 | 0.023 |
| Phosphorus | 1.214 | 8.553 | 1 | 0.003 |
4. Discussion
The results of our study are summarized as follows. Mean hemoglobin level was 10.79 ± 1.5 g/dL although about 29% of the studied cohort had hemoglobin level below the recommended target of 10 g/dL (10) despite prescription of ESAs. Thus, we evaluated ESA hyporesponsiveness using EHRI. About 48% of patients with hemoglobin less than 10 g/dL were in the fourth quartile.
Different studies have addressed the risk factors of ESA hyporesponsiveness although the results are contradictory. The most mentioned risk factors were: absolute or functional iron deficiency, blood loss, inflammation, inadequate dialysis, diabetes, hyperparathyroidism, ACE inhibitors, and ARBs (5-7, 11).
In comparison of patients with EHRI ≥ 16.49 and those with proper response, there were no age or gender or dialysis vintage differences.
We found lower BMI and serum albumin as risk factors of hyporesponsiveness. This finding might point out the worse nutritional condition among hyporesponsive patients. Low BMI had also been reported as the cause of erythropoietin resistance by Schneider et al. among diabetic dialysis patients (12). Low serum albumin can affect EHRI among dialysis patients in RISCAVID study as well (3). Hypoalbuminemia could be the result of malnutrition or inflammation among our patients.
In order to evaluate the effect of inflammation on ESA response, we used CRP level as a marker of inflammation, which was not significantly different between the groups, as was the case in RISCAVID study (3).
Serum PTH level was not significantly different between the study groups (251.4 ± 238.4 vs. 247.5 ± 226.2, P > 0.05). Since bone marrow fibrosis due to hyperparathyroidism is known as the cause of ESA resistance, better control of phosphate level and hyperparathyroidism among both groups omitted the predictive property of iPTH.
While most of the previous studies mentioned iron deficiency as a risk factor of ESA resistance (13), iron status was the same in the groups although patients with ESA resistance were treated with higher doses of Iron supplement compared to those with ESA responsiveness (202 ± 233 vs. 140.8 ± 207, respectively, P < 0.05). With respect to dialysis adequacy, both group had similar mean Kt/V (1.2 ± 0.2 vs. 1.24 ± 0.3, P > 0.05), but surprisingly, greater percentage of patients with EHRI > 16.49 had Kt/V above 1.4. Our findings were not in the same line with previous findings in this regard (11, 14).
Interestingly, treatment with ACEi/ARBs was significantly more common among patients with higher EHRI (24.5% vs. 18.2%, P < 0.01). Inhibition of renin angiotensin system inhibits erythropoiesis by decreasing angiotensin II availability, which is a growth factor for erythrocytes (12). Also, ACE inhibition can lead to elevated level of negative regulator of erythropoiesis of acetyl-seryl-aspartyl-lysyl-proline (AcSDKP) (11).
However, after multivariate logistic regression analysis, Venofer dose, Kt/V, and serum phosphorus remained significantly different among the groups, and treatment with ACEi/ARBs was only marginally significant. There was a negative relationship between resistance and Kt/V. Also, the association of Venofer dose and the resistance was negative. Phosphate level was directly associated with the presence of resistance. The results pointed out the facts that inadequate dialysis, poorly controlled serum phosphate level, and insufficient doses of intravenous iron supplements were the main causes of resistance to ESAs, and treatment with ACEi/ARBs might have a role in this situation.
Our study had limitations. The cross-sectional design of the study made it difficult to drive a solid cause and effect relationship. A prospectively designed study would help define a model for prediction of response to ESAs. A clinical trial on discontinuation of ACEi/ARB among hyporesponsive patients is needed. The strength of our study was its large sample size.
In conclusion, apart from the most validated parameters responsible for ESA hyporesponsiveness (e.g. Iron deficiency, dialysis inadequacy, poorly controlled serum phosphate), treatment with ACEi/ARB could be a potential risk factor, and their discontinuation as a therapeutic strategy to overcome ESA resistance must be kept in mind.


