


1. Background
Restless legs syndrome (RLS) is a sensory-motor neurologic disorder characterized by an uncomfortable sensation in legs along with obligatory leg movement to relief the complication (1).
Apart from the idiopathic form, secondary RLS is associated with iron deficiency, pregnancy, the Parkinson disease, and renal failure (2).
The prevalence of RLS is 5% to 10% in general population; however, the prevalence of RLS in patients with end-stage renal disease (ESRD) is estimated about 30% (ranging from 7% to 45%). Several factors influence the severity of RLS such as hypertension, female gender, weight, dialysis shift, age, and diabetes in patients undergoing hemodialysis (1). The effects of dialysis modality and adequacy on the severity of RLS are controversial.
RLS adversely affects sleep quality. More then 90% of patients with RLS have sleep disorders (3). On the other hand, epidemiologic data suggest higher prevalence of depression among patients with RLS (4-8). There is a strong relationship between insomnia and depression, as insomnia is a symptom of depression and also a risk factor to deteriorate depression (9). There are reports on the correlation between RLS and mental health, depression, decreased quality of life, and increased mortality among patient underwent transplantation or undergoing hemodialysis (1, 10-14). RLS is one of the most powerful causes of insomnia in chronic kidney diseases, however, sleep disorder cause depression (11, 15, 16). Data about the relationship between RLS, insomnia and depression are sparse and contradictory (17).
2. Objectives
The current study aimed at assessing the prevalence of RLS and the associated factors in patients undergoing hemodialysis as well as the correlation between RLS, insomnia, and depression; the study also hypothesized that RLS correlation with depression was independent of insomnia.
3. Methods
It was a cross sectional study on patients undergoing hemodialysis in 6 hemodialysis centers in Tehran, Iran. The study was approved by the ethical committee of chronic kidney disease research center (CKDRC).
From March to June 2015, a total of 325 hemodialysis patients aged 18 years and above who underwent hemodialysis for more than 3 months were enrolled. All participants in this study signed the informed written consent.
Patients with dementia, severe comorbidities (heart, lung, and liver diseases), and the ones who were not willing to participate were excluded.
Sociodemographic data (age, gender, body mass index (BMI), level of education, cause of ESRD, duration of dialysis, and dialysis shift), and drug use history (especially antidepressant, antianxiety, benzodiazepines, and dopaminergic agents) were recorded.
Latest laboratory data of the patients were recorded from their medical file including hemoglobin, serum iron, total iron binding capacity (TIBC), ferritin, calcium, phosphate, parathormone (iPTH), serum albumin, C-reactive protein (CRP), and uric acid. Dialysis adequacy was evaluated by single-pool Kt/V (spKt/V).
Previously trained physicians interviewed the patients and completed the following questionnaires: international restless legs syndrome study group (IRLSSG) and IRLSSG severity scale, Pittsburgh sleep quality index (PSQI), hospital anxiety and depression scale (HADS), and Charlson comorbidity index.
3.1. Assessment of RLS
RLS was assessed using IRLSSG questionnaire (18). The questionnaire was completed by a trained physician based on a face-to-face interview with patients. The severity of RLS was evaluated by 10 questions designed based on 6-option Likert scale from 0 to 5. Accordingly, severity of RLS was defined as followed: mild (0 to 10), moderate (11 to 20), severe (21 to 30), and very severe (31 to 40) (19).
3.2. Assessment of Depression
Depression was assessed by HADS as validated by Montazeri, et al., (20) among Iranian population. Depression was graded as normal (≤ 7), mild to moderate (8 to 10), and severe (≥ 11).
3.3. Assessment of Sleep Quality
The PSQI was used to assess insomnia in patients undergoing dialysis. PSQI was validated in Iranian population by Nazifi et al. (21). Sleep quality was defined poor in the scores more than 5. The score ≤ 5 was accepted as good sleep quality.
3.4. Statistical Analysis
Results were presented as mean ± standard deviation (SD) for the quantitative variables and summarized as frequencies and percentages for categorical variables. Quantitative and qualitative variables were measured by t and Chi-square tests, respectively. Logistic regression analysis was applied to evaluate the effect of RLS on sleep disorder and depression. For the statistic analysis, the SPSS software version 21 was used. P values less than 0.05 were considered significant.
4. Results
Among the 325 patients in 6 hemodialysis centers in Tehran, 235 were eligible and willing to participate. The mean age of the patients was 57 ± 16 years; 56.6% male. The mean duration on dialysis was 49.8 ± 65.7 months, with diabetes as the major cause of renal failure (42%).
Demographic and laboratory values of patients are shown in Table 1.
Table 1. Demographic and Paraclinical Data of the Study Subjects
| Characteristics | |
|---|---|
| Age, years (mean ± SD) | 57.3 ± 15.9 |
| Male (%) | 56.6 |
| BMI, kg/m2 (mean ± SD) | 25.4 ± 5.2 |
| Cause of ESRD (%) | |
| Diabetes | 42.9 |
| Hypertension | 26.2 |
| Glomerulonephritis | 9 |
| ADPKD | 6.4 |
| Obstructive uropathy | 5.2 |
| Unknown | 10.3 |
| Dialysis vintage, month (mean ± SD) | 49.8 ± 65.7 |
| Kt/v > 1.2 (%) | 79.9 |
| Hemoglobin, g/dL (mean ± SD) | 10.8 ± 1.8 |
| Calcium, mg/dL (mean ± SD) | 8.6 ± 0.8 |
| Phosphorus, mg/dL (mean ± SD) | 5.1 ± 1.4 |
| iPTH, pg/mL (mean ± SD) | 243 ± 321 |
| Albumin, g/dL (mean ± SD) | 4.08 ± 0.58 |
| Systolic blood pressure, mmHg (mean ± SD) | 125 ± 21 |
Abbreviations: ADPKD: autosomal dominant polycystic kidney disease; BMI: body mass index; ESRD: end-stage renal disease; iPTH: parathormone; SD: standard deviation.
4.1. Restless Leg Syndrome
According to IRSSG questionnaire, 23.4% (n = 55) of the patients had RLS, and among them 16.7% had a family history of the RLS. The demographic and laboratory characteristics of the 2 groups are listed in Table 2. Comparing the data of patients with and without RLS indicated a significant difference only in the family history of the disorder between the groups (P value < 0.001).
Table 2. Demographic and Paralinical Findings
| With RLS | Without RLS | P Value | |
|---|---|---|---|
| Age, years (mean ± SD) | 57.5 ± 15.5 | 57.3 ± 16.1 | 0.91 |
| Male (%) | 47.3 | 59.4 | 0.122 |
| Level of education | |||
| Illiterate | 28.3 | 20 | |
| Primary school | 28.3 | 41.1 | 0.187 |
| High school diploma | 26.4 | 23.3 | |
| Higher education | 17 | 15.6 | |
| BMI, kg/m2 (mean ± SD) | 25.9 ± 5.5 | 25.2 ± 5.1 | 0.443 |
| Family history of RLS (%) | 16.7 | 2.2 | 0.000 |
| Cause of ESRD (%) | |||
| Diabetes | 54.5 | 39.3 | |
| Hypertension | 18.2 | 28.6 | |
| ADPKD | 0 | 8.4 | 0.079 |
| Glomerulonephritis | 12.7 | 7.9 | |
| Obstructive uropathy | 5.5 | 5.1 | |
| Unknown | 9.1 | 10.7 | |
| Dialysis vintage, month (mean ± SD) | 54.6 ±76.3 | 48.3 ± 62.3 | 0.58 |
| Kt/v > 1.2 (%) | 83.3 | 78.8 | 0.561 |
| Dialysis shift (%) | |||
| Morning | 56.4 | 41.9 | 0.169 |
| Noon | 32.7 | 44.1 | |
| Night | 10.9 | 14 | |
| Charlson score (mean ± SD) | 5.52 ± 2.35 | 5.01 ± 2.15 | 0.151 |
| Hemoglobin, g/dL (mean ± SD) | 10.6 ± 1.8 | 10.9 ± 1.8 | 0.424 |
| Transferrin saturation, %, (mean) | 80 | 49 | 0.296 |
| Calcium, mg/dL (mean ± SD) | 8.5 ± 0.8 | 8.6 ± 0.8 | 0.252 |
| Phosphorus, mg/dL (mean ± SD) | 5.1 ± 1.4 | 5 ± 1.4 | 0.725 |
| iPTH, pg/mL (mean ± SD) | 242 ±413 | 243± 288 | 0.987 |
| Vitamin D (mean ± SD) | 30.4±29.7 | 37.3± 26.4 | 0.204 |
| Albumin, g/dL (mean ± SD) | 4.06±0.75 | 4.09 ± 0.53 | 0.74 |
| Uric Acid, mg/dL (mean ± SD) | 6.9 ± 5.2 | 6.5± 4.6 | 0.703 |
| Systolic blood pressure, mmHg (mean ± SD) | 127 ± 22 | 124 ± 21 | 0.318 |
Abbreviations: ADPKD: autosomal dominant polycystic kidney disease; BMI: body mass index; ESRD: end-stage renal disease; iPTH: parathormone; SD: standard deviation
There were no significant differences between the groups regarding age, gender, cause of ESRD, duration of hemodialysis, dialysis adequacy, comorbidities based on Charlson index, and hypnotic-sedative drug consumption.
Laboratory findings of anemia, hyperparathyroidism, iron status, and serum albumin level were not significantly different between the groups.
Assessment of severity of RLS based on a 10-question IRSSG questionnaire indicated the following results: 10.9% of patients had mild RLS, 45.5% moderate RLS, 29.1% severe RLS and 14.5% of the patients experienced the symptoms very severely.
4.2. RLS and Depression
Among the studied patients undergoing hemodialysis, the average of HADS-score was 8.8 ± 7.7, and the prevalence of depression (HADS > 7) was 47.2% (n = 111).
Depression was more prevalent among the patients with RLS than the ones without RLS (63.3% vs. 42.2%, P value = 0.005). The severity of depression based on average HADS score was also significantly higher among the patients with RLS (12.8 ± 9 vs. 7.6 ± 6.8, P value < 0.001).
The prevalence of RLS was 31.5% and 16.1%, respectively, among the patients with and without depression (P value = 0.005). The more severe the depression, the higher the prevalence of RLS symptoms (Figure 1); 20 % and 35% of the patients with mild to moderate (HADS score 8 to 10) and severe (HADS score ≥ 11) depression showed RLS symptoms, respectively (P value = 0.005).
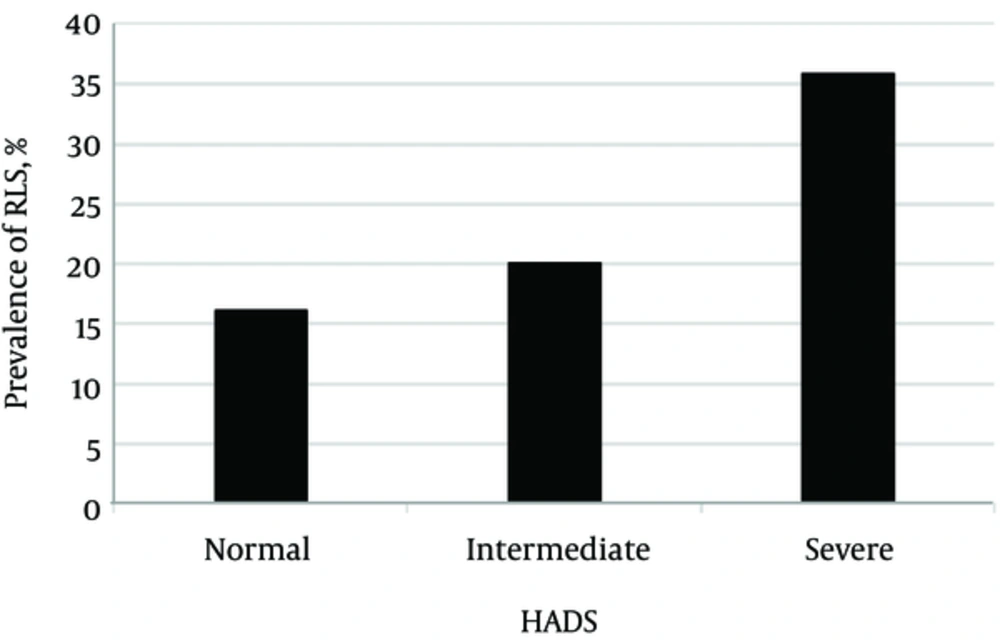
Figure 1.
Prevalence of RLS at Different Levels of Depression Based on HADS Score
4.3. RLS and Insomnia
Among the cohort of patients undergoing hemodialysis, the mean PSQI-score was 6.7 ± 4.3, and the prevalence of insomnia (defined as PSQI > 5) was 53.6% (n = 126).
Although in patients with RLS the mean PSQI-score was higher than the ones without RLS (8.2 ± 4.9 vs. 6.2 ± 4, P value = 0.009), the prevalence of insomnia was not higher in patients with RLS (63.6% vs. 50.6%; P value = 0.09). However, patients with more severe RLS symptoms had higher prevalence of insomnia (Figure 2); 50% of the patient with mild RLS vs. 100% of the ones with very severe RLS symptoms had insomnia (P value = 0.01).
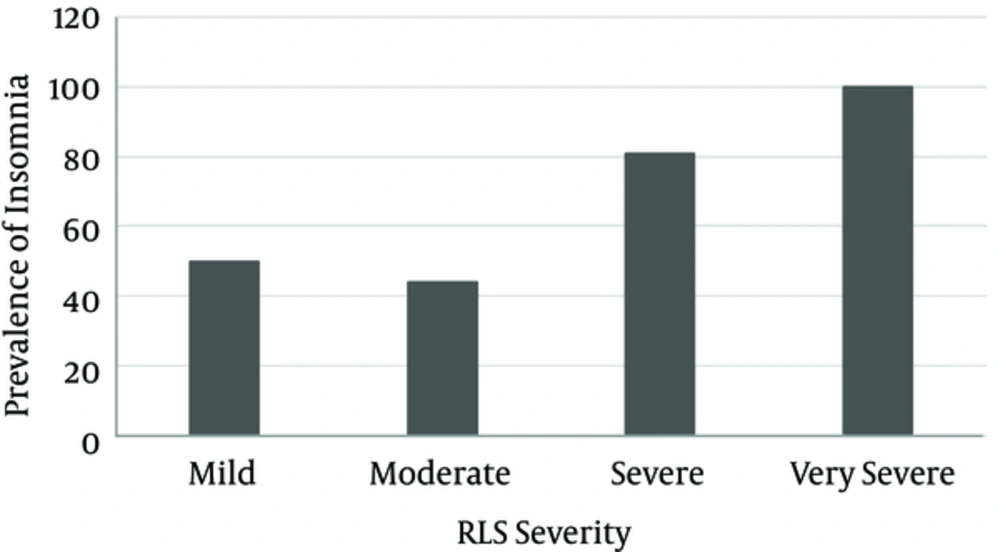
Figure 2.
Prevalence of Insomnia at Different Levels of RLS
4.4. Depression and Insomnia
Insomnia was more prevalent among the patients with depression than the ones without depression (63.9% vs. 44.3%, P value = 0.003). On the other hand, the prevalence of depression was higher among the patients with insomnia than the ones without insomnia (56.3% vs. 36.6%, P value = 0.003).
Patients with depression had significantly higher scores on the PSQI than the ones without depression (8.1 ± 4.4 vs. 5.5 ± 6.3, P value < 0.001); furthermore, the mean HADS-score amongst the patients with insomnia was 11 ± 8.1, whereas it was 6.3 ± 6.3 in the patients without insomnia (P value < 0.001).
There was a strong correlation between the results of PSQI and HADS.
4.5. Multivariate Analyses
Multivariate logistic regression analysis demonstrated that RLS symptoms were only associated with severe depression (odds ratio (OR) = 2.9; confidence interval (CI) = 1.5 - 5.6; P value = 0.002). Sleep disturbance was not associated with RLS symptoms.
5. Discussion
In the current study, the prevalence of RLS among patients undergoing hemodialysis was 23.4%. Based on a systematic review on 30 articles in Iran by Ghanei-Gheshlagh et al., the overall prevalence of RLS in Iran was about 30% (95% CI: 24% - 36%) and its prevalence was 45% (95% CI: 33% - 57%) among patients with renal failure (22). Moreover, in a recent study in Iran, the prevalence of RLS in 136 patients undergoing hemodialysis was 37.4% (23).
There was no association between age, gender, cause of ESRD, duration of hemodialysis, dialysis adequacy, and comorbid diseases, and the prevalence of RLS in the current study. However, family history of RLS was significantly associated with its prevalence similar to the case in the study by Pizza et al. (24).
The current study found no association between diabetes and RLS, unlike the study by Lin et al. (2); the reason for this discrepancy is not clear. There was no association between the abnormalities in paraclinical parameters such as anemia, hyperparathyroidism, iron status, serum albumin, and dialysis adequacy and RLS. These findings demonstrated the fact that even under the light of paramedical parameters; the RLS is a problem that should be addressed separately.
About 44% of the study patients had severe and very severe RLS symptoms. RLS has major adverse impacts such as sleep disorder, depression, anxiety, sexual dysfunction, decreased quality of life, and cardiovascular mortality (25-28). Sleep disorders are prevalent among the patients undergoing hemodialysis (29), and about 54% of the current study patients had insomnia. On the other hand, depression was common and its relationship with RLS was independent of insomnia. Therefore, treatment and management of RLS might improve patients’ quality of life and decrease the prevalence of depression.
The current study had some limitations. First, it was a cross sectional study, therefore the cause and effect relationship between the findings of RLS, depression, and insomnia could not be verified. Second, the emotion-oriented coping with stress and other factors that might cause depression were not assessed.
5.1. Conclusion
RLS is prevalent among patients undergoing hemodialysis and could lead to depression even in the absence of insomnia. Thus, it seems that appropriate diagnosis and management of RLS would make a difference in the quality of life of patients undergoing dialysis. A well-designed clinical trail would help to find an effective treatment for RLS.
