
1. Background
Childhood malnutrition is a major public health problem in low- and middle-income countries (1, 2). To evaluate malnutrition, several anthropometric indices have been developed (3). Among these indices, underweight has been emphasized, as both acute and chronic food deprivation can lead to underweight (3). According to the World Health Organization (WHO) criteria, a child is defined as underweight if his/her present weight is below the appropriate weight for his/her age or if his/her weight is below the third percentile of weight on the age curve (3-5).
Malnutrition can cause substantial increases in mortality and morbidity of diseases (1, 6). It can also affect children’s physical and intellectual growth and lead to future educational problems and economic productivity challenges (1, 7). Food and nutrition insecurity is considered as a predisposing factor for malnutrition in children (8). People have food and nutrition security when they have physical, social, and economic access to sufficient food with good quality at all times (2, 7, 8). Moreover, an environment of adequate sanitation and sufficient access to health services needed for a healthy and active life are essential for a secure lifestyle (9).
Previous studies have evaluated the association between food and nutrition insecurity and malnutrition in children (10, 11). In this regard, an American study found that 0–3-year-old children living in food-insecure households had a 90% greater odds of having fair/poor health, besides a 31% greater odds of hospitalization as compared to children living in food-secure households (10). Also, other studies have shown a dose-response relationship between the child's health status and the severity of food insecurity (11, 12). Other studies have confirmed associations between malnutrition in children and some factors, such as family size and number of children under five years in the family (13, 14); maternal age (14) and education (14, 15); paternal occupation (14, 15); household income (15, 16); parental knowledge about child feeding (14); methods of starting complementary feeding (13); access to health services (12); sanitation and safe drinking water (17); and lack of exposure to mass media (14).
Although previous studies have evaluated the effects of some factors related to nutrition and food insecurity on children’s malnutrition, to the best of our knowledge, no study has yet evaluated all of these factors in Iranian children. Since cultural and behavioral factors can be effective in children’s malnutrition and its risk factors (18, 19), the results of studies conducted in other countries might not be consistent with our observations in Iran. Because of the high prevalence of childhood malnutrition in Iran (3, 20), interventions are necessary for improving child feeding. To establish such interventions, authorities need some information about the problems and risk factors.
2. Objectives
In this study, we aimed to evaluate the relationship of malnutrition in children with food and nutrition insecurity in Fars Province, Iran, in 2016.
3. Methods
This case-control study was conducted in healthcare centers, located in urban and rural areas of Fars Province in May 2015. A total of 543 healthcare centers were considered in this study, including 188 urban and 355 rural centers. The target population consisted of 6–60-month-old Iranian children supervised by the center. On the other hand, children with physical handicaps, mental retardation, phenylketonuria, Down’s syndrome, diabetes mellitus, hypo- and hyperthyroidism, and cretinism, as well as those whose mothers did not consent to participate in the study, were excluded.
According to the healthcare protocol of Iran, all Iranian children under 60 months should receive primary healthcare in healthcare centers. In these centers, trained healthcare workers (HCWs) measure weight using a measuring board (0.1 kg accuracy; Seca, Germany) in children < 2 years and a digital weighing scale (0.1 kg accuracy; Seca, Germany) for older ones wearing light clothes and no shoes. Based on these measurements, the HCWs plotted the children’s weight-for-age curve (21).
The sample size of the study was determined based on the census sampling of all children who met the inclusion criteria in each health center. We evaluated the curve for all children registered in the centers and selected those whose weight-for-age curve was below the third percentile in the final measurement (malnourished or case group) (3). Also, for each child enrolled in the case group, we selected a child with the same sex and age (± 1 month) from the same center for the control group. The children in the control group did not have any growth retardation during their follow-up. If we could not find a control child to match a selected malnourished child in terms of the abovementioned criteria, he/she was excluded from the study.
Moreover, the child’s food and nutrition insecurity was evaluated using the 18-item household food security questionnaire by the United States Department of Agriculture (USDA) (22), which is a valid and reliable tool in Iran (23, 24). It consists of the following sections: 1- demographic information (21 questions); 2- feeding status, including breastfeeding, supplementary nutrition, and use of vitamins and minerals (5 questions); 3- household sanitary status (3 questions); 4- food security status (18 questions); and 5- maternal knowledge (24 questions) and practice (20 questions) about the child’s nutrition and growth.
The first and second sections of this researcher-made questionnaire were selected from a checklist designed by the Iranian Ministry of Health and Medical Education for a national survey, that is, the Anthropometric and Nutrition Indicators Survey (ANIS) (3, 16, 25-27). The third section of the questionnaire was designed according to the WHO sanitation safety plans (16). Also, to design the fourth section, which evaluated the household food security, we used the validated Persian version (28, 29) of the USDA questionnaire (16). This questionnaire is categorized into two sections: for all families (10 questions) and for families with children under 18 years (8 questions). The options include “always”, “often”, “sometimes”, “hardly ever”, and “never” and are scored as either one (“always”, “often”, and “sometimes”) or zero (“hardly ever” and “never”). The food security status of each family was determined by summing and classifying the scores of the questions, as shown in Table 1 (16, 30).
Table 1.
Classification of Food Security Status of Families Based on the USDA Questionnaire Scores
| Food Security Status | Family’s Score of USDA Questionnaire | |
|---|---|---|
| Families with Children Under 18 Years (Total Score = 18) | Families without Children Under 18 Years (Total Score = 10) | |
| Food security | 0 - 2 | 0 - 2 |
| Food insecurity | ||
| Mild food insecurity (food insecurity without hunger) | 3 - 7 | 3 - 5 |
| Moderate food insecurity (food insecurity with moderate hunger) | 8 - 12 | 6 - 8 |
| Severe food insecure (food insecurity with severe hunger) | 13 - 18 | 9 - 10 |
Abbreviation: USDA, the united states department of agriculture.
The fifth section of the questionnaire was designed after evaluating the questions used in previous studies (25-27). Also, content validity was approved by two faculty members affiliated to the Nutrition and Food Sciences School of Shiraz University of Medical Sciences. Moreover, the internal reliability of this section was evaluated after conducting a pilot study on 100 children and by measuring Cronbach’s alpha coefficients (α = 0.742 for maternal knowledge and α = 0.708 for maternal practice). To score this section, we assigned scores of 1 and 0 to correct and incorrect answers, respectively. The mean of the scores was considered as the maternal knowledge and practice score.
After inviting the selected children and their mothers to the centers and obtaining informed consent, trained HCWs completed the questionnaires by interviewing the mothers. Also, they calculated the mother's body mass index (BMI) after measuring their weight and height by a digital weighing scale (0.1 kg accuracy; Seca, Germany) and an adult stadiometer (0.1 cm accuracy; Seca, Germany), respectively. The Research Ethics Committee of Shiraz University of Medical Sciences approved the study protocol (ethical code: #7737).
We compared food and nutrition insecurity between malnourished and well-nourished children, using Chi-square and independent sample t-test in SPSS version 21. Also, a logistic regression model with the enter method was used to control for the effects of confounding factors on malnutrition in children. Finally, all independent variables with significant associations with malnutrition in the univariate analysis were entered into the model. The significance level was set at P < 0.05 in all statistical tests.
4. Results
Of 1100 malnourished children who met the inclusion criteria, 1000 (90.90%) participated in this study. The participants’ mean age was 28.50 ± 14.96 months, and about 59.35% of them were female (Tables 2 and 3).
Table 2.
Comparison of Children’s Demographic Characteristics (Quantitative Variables) Between Malnourished and Well-Nourished Children a
| Children’s Demographic Characteristics | Total (N = 2000) | Malnourished Children (N = 1000) | Well-Nourished Children (N = 1000) | P-Value b |
|---|---|---|---|---|
| Child’s age (months) | 28.50 ± 14.96 | 28.46 ± 15.01 | 28.54 ± 14.92 | 0.204 |
| Maternal BMI (kg/m2) | 24.82 ± 4.86 | 24.14 ± 6.24 | 25.61 ± 4.72 | < 0.001 |
| Child’s birth weight (kg) | 2.93 ± 0.57 | 2.68 ± 0.57 | 3.17 ± 0.46 | < 0.001 |
| Child’s birth order | 1.82 ± 1.05 | 1.84 ± 1.07 | 1.84 ± 1.03 | 0.709 |
| Family size | 4.02 ± 1.09 | 4.07 ± 1.14 | 3.97 ± 1.03 | 0.109 |
| Number of rooms in the house | 2.22 ± 1.04 | 2.19 ± 1.08 | 2.24 ± 0.99 | 0.016 |
Abbreviations: BMI, body mass index; SD, standard deviation.
aValues are expressed as mean ± SD.
b Independent sample t-test.
Table 3.
Comparison of Children’s Demographic Characteristics (Qualitative Variables) Between Malnourished and Well-Nourished Children a
| Children’s Demographic Characteristics | Total (N = 2000) | Malnourished Children (N = 1000) | Well-Nourished Children (N = 1000) | P-Value b |
|---|---|---|---|---|
| Sex | 0.964 | |||
| Male | 813 (40.65) | 405 (40.50) | 408 (40.80) | |
| Female | 1187 (59.35) | 595 (59.50) | 592 (59.20) | |
| Head of household | 0.208 | |||
| Father | 1959 (97.95) | 974 (97.40) | 985 (98.50) | |
| Mother | 29 (1.45) | 17 (1.70) | 12 (1.20) | |
| Others | 12 (0.60) | 9 (0.90) | 3 (0.30) | |
| Residence area | 0.926 | |||
| Rural | 1255 (62.75) | 629 (62.90) | 626 (62.60) | |
| Urban | 745 (37.25) | 371 (37.10) | 374 (37.40) | |
| Ethnicity | 0.600 | |||
| Fars | 1603 (80.15) | 803 (80.30) | 800 (80.0) | |
| Qashqai | 119 (5.95) | 62 (6.20) | 57 (5.70) | |
| Lor | 70 (3.50) | 34 (3.40) | 36 (3.60) | |
| Arab | 74 (3.70) | 30 (3.00) | 44 (4.40) | |
| Others | 134 (6.70) | 71 (7.10) | 63 (6.30) | |
| Maternal education (y) | < 0.001 | |||
| 0 - 5 | 596 (29.80) | 339 (33.90) | 257 (25.70) | |
| 6 - 8 | 379 (18.95) | 204 (20.40) | 175 (17.50) | |
| 9 - 12 | 809 (40.45) | 369 (36.90) | 440 (44.00) | |
| > 12 | 216 (10.80) | 88 (8.80) | 128 (12.80) | |
| Paternal education (y) | < 0.001 | |||
| 0 - 5 | 481 (24.05) | 273 (27.30) | 208 (20.80) | |
| 6 - 8 | 600 (30.00) | 305 (30.50) | 295 (29.50) | |
| 9 - 12 | 705 (35.25) | 339 (33.90) | 366 (36.60) | |
| > 12 | 214 (10.70) | 83 (8.30) | 131 (13.10) | |
| Maternal occupation | 0.070 | |||
| Housewife | 1883 (94.15) | 953 (95.30) | 930 (93.00) | |
| Employee | 117 (5.85) | 47 (4.70) | 70 (7.00) | |
| Paternal occupation | < 0.001 | |||
| Unemployed | 107 (5.35) | 63 (6.30) | 44 (4.40) | |
| Rancher/farmer | 321 (16.05) | 161 (16.10) | 160 (16.00) | |
| Full-time worker | 177 (8.85) | 95 (9.50) | 82 (8.20) | |
| Part-time worker | 487 (24.35) | 285 (28.50) | 202 (20.20) | |
| Employee | 184 (9.20) | 72 (7.20) | 112 (11.20) | |
| Self-employed | 724 (36.20) | 324 (32.40) | 400 (40.00) | |
| Smoking status | 0.050 | |||
| Mother | 11 (0.55) | 5 (0.50) | 6 (0.60) | |
| Father | 501 (25.05) | 275 (27.50) | 226 (22.60) | |
| Both parents | 35 (1.75) | 21 (2.10) | 14 (1.40) | |
| None | 1453 (72.65) | 699 (69.90) | 754 (75.40) | |
| Homeownership status | 0.021 | |||
| Owner | 1590 (79.50) | 771 (77.10) | 819 (81.90) | |
| Rental | 396 (19.80) | 222 (22.20) | 174 (17.40) | |
| Government property | 14 (0.70) | 7 (0.70) | 7 (0.70) |
aValues are expressed as No. (%).
bChi-square test.
4.1. Association Between Malnutrition in Children and Demographic Characteristics
Malnutrition in children was significantly associated with their birth weight (P < 0.001), maternal BMI (P < 0.001), number of rooms in the house (P = 0.016), both parents’ educational level (P < 0.001 for both), father’s occupation (P < 0.001), and homeownership status (P = 0.021) (Tables 2 and 3).
4.2. Association of Malnutrition in Children and Their Feeding Status
Although fewer malnourished children had exclusive breastfeeding (P < 0.001), we did not find any significant association between the duration of breastfeeding and malnutrition (P = 0.784). However, more malnourished children had started complementary feeding before six months of age as compared to well-nourished children (P = 0.001) (Table 4).
4.3. Association Between Malnutrition in Children and Sanitary Status of Household
Malnutrition in children was significantly associated with having sanitary latrines and bathrooms (P < 0.001 for both) and keeping pets at home (P = 0.003) (Table 4).
Table 4.
Comparison of Children’s Feeding Status and Household Sanitary Status Between Malnourished and Well-Nourished Children a
| Children’s Characteristics | Total (N = 2000) | Malnourished Children (N = 1000) | Well-Nourished Children (N = 1000) | P-Value b |
|---|---|---|---|---|
| Children’s Feeding Status | ||||
| Exclusive breastfeeding | < 0.001 | |||
| Yes | 1503 (75.15) | 701 (70.10) | 802 (80.20) | |
| No | 497 (24.85) | 299 (29.90) | 198 (19.80) | |
| Duration of breastfeeding: | 0.784 | |||
| Never | 7 (0.35) | 5 (0.50) | 2 (0.20) | |
| 1 day to 6 months | 124 (6.20) | 68 (6.80) | 56 (5.60) | |
| 7 - 12 months | 119 (5.95) | 57 (5.70) | 62 (6.20) | |
| 13 - 18 months | 462 (23.10) | 230 (23.00) | 232 (23.20) | |
| 19 - 24 months | 668 (33.40) | 328 (32.80) | 340 (34.00) | |
| Breastfed at present | 620 (31.00) | 312 (31.20) | 308 (30.80) | |
| Age of complementary feeding onset | 0.001 | |||
| < 6 months | 347 (17.35) | 194 (19.40) | 153 (15.30) | |
| 6 months | 1332 (66.60) | 658 (65.80) | 674 (67.40) | |
| 7 - 12 months | 311 (15.55) | 144 (14.40) | 167 (16.70) | |
| > 12 months | 10 (0.50) | 4 (0.40) | 6 (0.60) | |
| Use of iron supplements | 0.798 | |||
| Yes | 1495 (74.75) | 757 (75.70) | 738 (73.80) | |
| No | 505 (25.25) | 243 (24.30) | 262 (26.20) | |
| Use of vitamin A&D supplements or multivitamins | 0.216 | |||
| Yes | 1601 (80.05) | 789 (78.90) | 812 (81.20) | |
| No | 399 (19.95) | 211 (21.10) | 188 (18.80) | |
| Sanitary Status of Children’s Household | ||||
| Having a sanitary latrine | < 0.001 | |||
| Yes | 1604 (80.20) | 751 (75.10) | 853 (85.30) | |
| No | 396 (19.80) | 249 (24.90) | 147 (14.70) | |
| Having a bathroom | < 0.001 | |||
| Yes | 1727 (86.35) | 830 (83.00) | 897 (89.70) | |
| No | 273 (13.65) | 170 (17.00) | 103 (10.30) | |
| Keeping animal at home | 0.003 | |||
| Yes (indoor) | 308 (15.40) | 181 (18.10) | 127 (12.70) | |
| Yes (outdoor) | 273 (13.65) | 133 (13.30) | 140 (14.00) | |
| No | 1419 (70.95) | 686 (68.60) | 733 (73.30) | |
aValues are expressed as No. (%).
bChi-square test
4.4. Association of Malnutrition in Children and Family’s Food Security Status
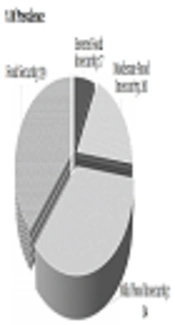
Of 2000 studied children, 943 (47.15%) lived in food-insecure households (578 malnourished children [57.80%] vs. 365 well-nourished children [36.50%]). There was a significant association between malnutrition in children and their security status (P < 0.001). Also, a higher percentage of malnourished children lived in families with food insecurity (Figure 1).
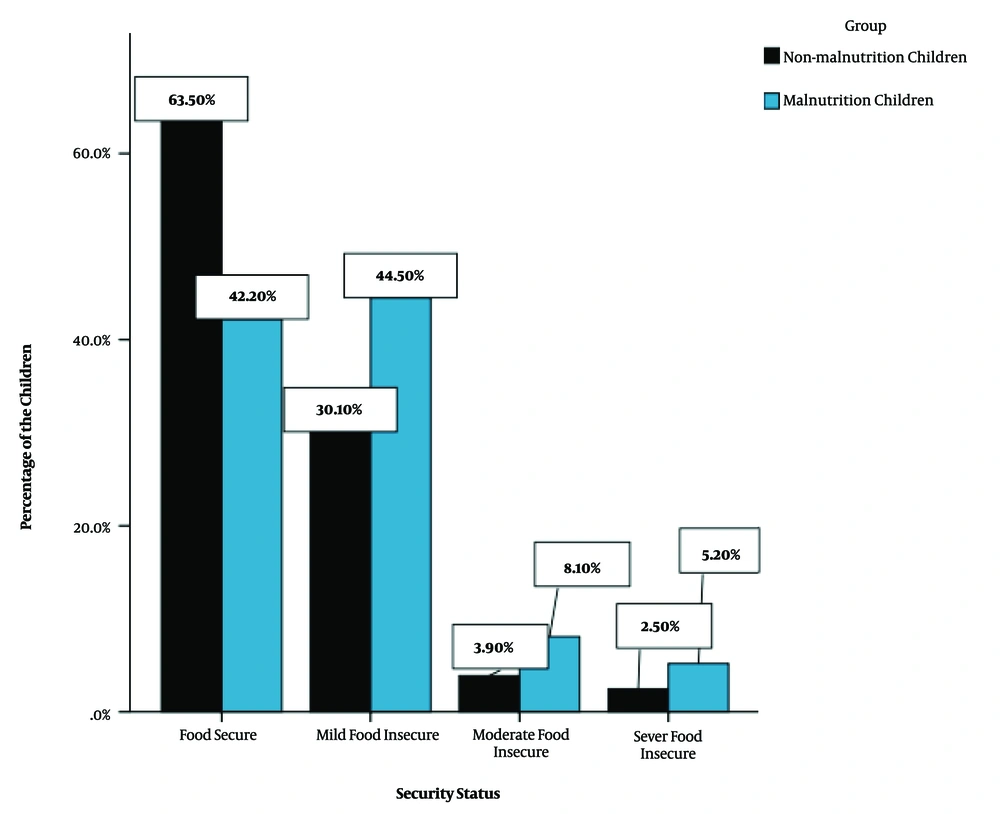
Figure 1.
Comparison of malnourished and well-nourished children living in food-secure and food-insecure households (n = 2000).
4.5. Association of Malnutrition in Children with Maternal Practice and Knowledge About Child Feeding
The mean score of maternal knowledge and practice in the malnourished group was significantly lower than that of the well-nourished group (knowledge: 0.65 ± 0.21 vs. 0.69 ± 0.22, P < 0.001; practice: 0.82 ± 0.11 vs. 0.88 ± 0.09, P < 0.001).
4.6. Logistic Regression Analysis
The odds of malnutrition in children decreased by increasing their birth weight (OR = 0.15) and maternal BMI (OR = 0.96). Furthermore, an increase in maternal knowledge (OR = 0.22) and practice (OR = 0.21) decreased the odds of malnutrition in children. Also, the probability of malnutrition in children with full-time working fathers was half the risk of malnutrition in those with unemployed fathers. Moreover, the risk of malnutrition in children without sanitary latrines in their household was twice as high as those with sanitary latrines. Finally, the probability of malnutrition in children living in food-insecure households was 1.85 times higher than those living in food-secure households (Table 5).
Table 5.
The Logistic Regression Model with Malnutrition in Children as the Dependent Variable (N = 2000)
| Variables | OR | 95% CI | P-Value |
|---|---|---|---|
| Maternal BMI | 0.96 | 0.93 - 0.98 | 0.001 |
| Child’s birth weight | 0.15 | 0.11 - 0.20 | < 0.001 |
| Number of rooms in the child’s house | 1.08 | 0.96 - 1.23 | 0.171 |
| Maternal education (Ref: 0 - 5 years) | 0.990 | ||
| 6 - 8 years | 0.98 | 0.68 - 1.40 | 0.912 |
| 9 - 12 years | 0.98 | 0.74 - 1.31 | 0.921 |
| > 12 years | 1.03 | 0.80 - 1.33 | 0.798 |
| Paternal education (Ref: 0 - 5 years) | 0.162 | ||
| 6 - 8 years | 0.89 | 0.59 - 1.34 | 0.601 |
| 9 - 12 years | 0.79 | 0.59 - 1.07 | 0.145 |
| > 12 years | 0.80 | 0.63 - 1.01 | 0.064 |
| Paternal occupation (Ref: unemployed) | 0.032 | ||
| Rancher/farmer | 1.11 | 0.72 - 1.70 | 0.621 |
| Full-time worker | 0.56 | 0.38 - 0.83 | 0.004 |
| Part-time worker | 0.98 | 0.66 - 1.46 | 0.932 |
| Employee | 1.05 | 0.71 - 1.56 | 0.791 |
| Self-employed | 0.90 | 0.61 - 1.33 | 0.602 |
| Home ownership status (Ref: owner) | 0.322 | ||
| Rental property | 1.76 | 0.57 - 5.43 | 0.321 |
| Government property | 1.19 | 0.60 - 2.36 | 0.613 |
| Exclusive breastfeeding (yes) | 1.01 | 0.75 - 1.36 | 0.945 |
| Onset of complementary feeding (Ref: < 6 months) | 0.747 | ||
| 6 months | 0.55 | 0.16 - 1.91 | 0.354 |
| 7 - 12 months | 0.70 | 0.27 - 1.79 | 0.453 |
| > 12 months | 0.79 | 0.49 - 1.28 | 0.345 |
| Having a sanitary latrine (Ref: yes) | 1.98 | 1.29 - 3.04 | 0.002 |
| Having a bathroom (Ref: no) | 0.67 | 0.42 - 1.07 | 0.091 |
| Keeping animal at home (Ref: no) | 0.382 | ||
| Yes (outdoor) | 1.19 | 0.89 - 1.58 | 0.223 |
| Yes (indoor) | 0.97 | 0.70 - 1.34 | 0.854 |
| Maternal knowledge about child feeding | 0.22 | 0.11 - 0.44 | < 0.001 |
| Mother’s practice of child feeding | 0.21 | 0.05 - 0.86 | 0.034 |
| Living in a food-insecure household (Ref: no) | 1.85 | 1.41 - 2.43 | < 0.001 |
5. Discussion
This case-control study evaluated the relationship between malnutrition in children and food and nutrition insecurity in Fars Province, Iran. We found a significant association between malnutrition in children and many aspects of food and nutrition insecurity.
5.1. Association Between Malnutrition in Children and Demographic Characteristics
We found a significant association between malnutrition in children and paternal occupation as a suitable indicator of the family’s socioeconomic status. Other studies showed other indicators of a family’s socioeconomic status, such as urbanization (1, 31), family size (1), household income (25, 32), parental educational level (1, 25, 33, 34), and ethnicity (1) as related factors of malnutrition in children. In our study, similar to previous research, malnutrition in children was significantly associated with children’s birth weight (34, 35) and maternal BMI (36). Therefore, nutritional support and education of low BMI mothers and mothers having low birth weight children were important measures for improving malnutrition in children.
5.2. Association of Malnutrition in Children and Their Feeding Status
The WHO guidelines recommend training mothers about exclusive breastfeeding until the child’s age is six months (37). Nevertheless, in our study, similar to other research conducted in Iran (38) and other countries (39), the proportion of breastfeeding mothers was not favorable. On the other hand, nutritional interventions are among the most effective preventive measures for reducing mortality in children, especially exclusive breastfeeding programs (40). Also, children and infants are at a high risk of malnutrition from six months of age onwards when breast milk alone is not sufficient to meet all their nutritional requirements; therefore, complementary feeding should be initiated for them (41). On the other hand, initiating complementary foods too late or too early can lead to malnutrition (42). In other words, early incorporation of complementary foods before the age of six months in children can lead to the displacement of breast milk. It can also enhance the risk of infections, such as diarrhea, which further contribute to weight loss and malnutrition (41, 43). Therefore, initiating complementary feeding at an appropriate time can play an important role in preventing acute malnutrition (44).
5.3. Association of Malnutrition in Children with the Household Sanitary Status
In the present study, similar to other studies conducted in Iran (45) and India (46), a significant association was found between childhood malnutrition and having sanitary latrines in the household, as an indicator of the sanitary status of the household (47). In other words, the unavailability of sanitary latrines at home is recognized as an important risk factor for infectious diseases, leading to children’s growth retardation and malnutrition (22, 45).
5.4. Association of Malnutrition in Children with the Family’s Food Security Status
In the present study, similar to another Iranian study (48), about half of the evaluated households had food insecurity. Other studies also reported food insecurity in 52% of households in Korea, 73% of households in Burkina Faso, 70% of households in Bolivia, 35% of households in the Philippines, 32% of households in Java (Indonesia), and 44% of households in Thailand (48). In contrast, a study conducted in the United States in 2007 showed that only 11% of the population had food insecurity (49). In our study, similar to other studies (40, 50), a significant association was found between malnutrition in children and the household security status. Also, national food availability, measured as dietary energy supply per capita, was reported as a very important factor affecting the prevalence of childhood malnutrition (40). Therefore, food-insecure families must be recognized and supported.
5.5. Association of Malnutrition in Children with Maternal Knowledge and Practice of Child Feeding
In our study, similar to other Iranian research (25, 51), the child’s nutritional status had a significant relationship with maternal knowledge and practice of child feeding. Similarly, other studies have shown that the parents’ feeding practice plays a critical role in the development of children’s taste preferences, eating habits, nutrition, and eventual weight status (52, 53). It has been even shown that inadequate parental knowledge is more influential in children’s malnutrition than food deficiency (26); therefore, parental education about child feeding is highly recommended.
The multidimensional causes of malnutrition highlight the importance of intersectional cooperation and participation of governmental and non-governmental organizations in interventions designed for improving childhood malnutrition. The following interventions are recommended:
- Since there was a significant association between maternal knowledge of child feeding and the child’s malnutrition status, we recommend interventions for family education to emphasize the importance of children’s nutrition and growth, proper techniques of child feeding, feeding with inexpensive and nutrient-dense foods, and appropriate distribution of food among family members (54).
- Considering the effect of proper nutrition on the growth rate of children, besides the low socioeconomic status of some families, we suggest nutritional support of low socioeconomic families (55).
- Monitoring the sanitary status of households and helping families to improve it (47) can play an important role in reducing the risk of malnutrition in children.
- Periodic monitoring of children’s growth and early detection and management of malnourished children (56) can lead to early diagnosis of developmental disorders and malnutrition in children.
This study had some limitations that need to be mentioned. First, given the case-control design of this study, all limitations of this study type, especially recall bias, might be present. Second, the retrospective nature of data collection limited the causal interpretation of associations. Third, although we tried our best to gain the parents’ trust and cooperation, some parents did not answer some questions, especially sensitive ones, such as family income. Therefore, to evaluate this association more accurately, we recommend designing further prospective cohort studies.
5.6. Conclusion
There were significant associations between childhood malnutrition and many aspects of food and nutrition insecurity, including the socioeconomic status and food security of the family, and sanitary status of the household. Overall, interventions focusing on the improvement of food security are highly recommended.