
1. Background
Food security and adequate nutrition are among the most important factors determining individual’s health from conception into elder years (1). Food insecurity meaning “limited or uncertain availability of notorious, adequate and safe foods for normal growth in socially acceptable ways to conduct an active life” (2) is often associated with poverty and low income, and should be considered as an important associate of health and nutrition outcomes especially in mothers and their infants (3, 4).
It has been shown that maternal nutrition has an important role in prenatal and neonatal periods. Few studies have specifically addressed the importance of food security in this period of life and its association with low birth weight (LBW) deliveries (5). LBW (birth weight less than 2500 g) and preterm birth, are major public health problems and strongest single risk factors which are defined as neonatal mortality and morbidity that contribute to larger health cost (6, 7). It is estimated that 15% to 20% of all births worldwide are LBW, indicating more than 20 million births a year with more than 95% of LBW infants being born in developing countries (6, 8). Evidence shows that low birth weight and restricted neonatal growth is associated with poor growth in childhood and an increased risk of chronic diseases, including diabetes, hypertension, heart disease and obesity later in life (6, 9). Fetal growth is directly affected by mother’s diet during pregnancy. Mothers in deprived socio-economic conditions and food insecure families are at higher risk of having low birth weight infants, primarily due to poor nutrition and health over a long period of time, including before and during pregnancy (10). Mother’s poor nutritional status which may lead to pre-eclampsia, anemia, early cesarean section, multiple pregnancies, infections and chronic conditions such as diabetes also can increase the incidence of LBW (8, 11).
In Iran, numerous studies have investigated household (HH) food insecurity; however, they are scattered in different cities. Based on the result of a recent systematic review on food security in Iran, the prevalence of food insecurity was 49% among Iranian HH, 67% in children, 61% in mothers, 49% in adolescents and 65% in the elderly (12). According to sub-groups analysis in another review, food insecurity without and with hunger was estimated 29.6% and 19.2%, respectively (12). Also, prevalence of food insecurity in HH with children aged 6 - 11 years in Yazd have been reported, 30.5% (13). Food insecurity affects health status of all HH members in different ways, although preschool children are more prone to poverty and food insecurity as they are in growing age and poor nutrition can lead to continual complications later in life. Food insecurity may result in reduced learning and productivity and may also affect children’s anthropometric status, including weight and height (14, 15). Food insecurity in childhood is also shown as a predictor of chronic diseases, mental health, depression and suicidal ideation during late adolescence (15-17).
2. Objectives
The present study aimed to determine the relationship between food insecurity and anthropometric status of children at birth and up to age 6 years in a low income district in Mashhad city.
3. Methods
This cross-sectional study was performed from June to November 2014 in Golshahr, a low income district in Mashad city. Golshahr with a population of about 34,650 is located in the northeastern part of Mashad. It is considered a low income district where different ethnic groups of Iranian, as well as Afghani immigrants/refugees are settled. The present study was conducted parallel to a larger study on HH food security status of Afghan immigrants in Golshahr to compare Iranian and Afghans living in the same district in terms of HHs food security and evaluate the effect of different social and cultural status on HH food security.
The sample in the present study included 240 Iranian HHs who had at least one under 6 years old child and were living in Golshahr district. The sample was selected through systematic cluster sampling method from 3 health centers and 7 sub centers in the district. Sample size in each health center was defined based on the population size under its coverage and selection was done using a table of random numbers. Data were collected through face-to-face interview with mothers by two trained nutritionists after they signed a letter of informed consent.
3.1. Anthropometric Measurement
weight of the child was measured based on standard protocols (18) by a Seca scale (Hamburg, Germany) to the nearest 0.1 kg and their height was measured using a measuring tape (Seca, Hamburg,Germany) to the nearest 0.1 cm. Child anthropometric status was reported as z-scores of weight for age (WAZ), height-for-age (HAZ) and BMI for age (BMIZ), by WHO Anthro Plus software. Short stature was defined as HAZ-score < -1 and underweight as WAZ-score < -1, while Z-scores between -1 ≤ to ≤ 1 were defined as normal range, Z-score ≥ 1 was defined as tall/overweight.
3.2. Food Insecurity Measurement
HH food security status over the last 12 months was measured by the US Department of Agriculture (USDA) Food Security Module. The scale is consisted of an 18-item questionnaire with 4 frequency response options that classifies HHs into “food secure”, “food insecure without hunger”, “food insecure with moderate hunger” and “food insecure with severe hunger”. Food security score of each HH was calculated according to the number of positive responses on each item of the questionnaire (19). The internal validity of the adapted USDA module in measuring adult and child food insecurity in Iranian population has been evaluated and confirmed in a study in Esfahan (20). In addition, the USDA module was adapted in a study among households in Shiraz by Ramesh et al. (21).
3.3. Statistical Analysis
Data were analyzed using the statistical package for social sciences statistical software package, version 16 (SPSS). The χ2 test and Wilcoxon test were used, significance level was defined at P < 0.05.
4. Results
4.1. Demographic Characteristics
A total of 240 HHs and their under 6-year-old children were studied. Of the studied children, 55% were boys. Table 1, depicts mean and standard error of demographic characteristics in the studied HHs.
Table 1.
Mean ± SE of Demographic Characteristics of Iranian HHs in Golshahr, Mashhad, 2014
| Variable | Minimum | Maximum | Mean ± SE |
|---|---|---|---|
| HH characteristics | |||
| Age of head, y | 20.0 | 65.0 | 33.63 ± 7.06 |
| Age of spouse, y | 18.0 | 54.0 | 30.03 ± 6.31 |
| Family size, No. | 3.0 | 8.0 | 3.96 ± 0.95 |
| Number of children | 1.0 | 6.0 | 1.94 ± 0.93 |
| Number of children under 6 years of age | 1.0 | 3.0 | 1.12 ± 0.35 |
| Income, Rials/mo | 1300000 | 30000000 | 8808021 ± 4877611 |
| Child characteristics | |||
| Age, mo | 9.0 | 80.0 | 39.45 ± 19.14 |
| Weight, kg | 7.7 | 31.2 | 13.93 ± 3.90 |
| Height, cm | 70.0 | 127.0 | 96.14 ± 13.59 |
Abbreviation: HH, household.
4.2. Household Food Security and Child Anthropometrics
Child anthropometric status, including z-scores of WAZ, HAZ, and body mass index (BMI) for age (BAZ) by HH food security status are presented in Table 2. Among the studied HHs, 61% were food insecure, Figure 1 depicts food insecurity status in studied HH.
Table 2.
Anthropometric Status of Children at Birth and Before 6 Years Old in Golshahr, Mashhad by HH Food Security Status, 2014a
| Anthropometric Indices | HH Food Security Status | P Value | ||
|---|---|---|---|---|
| Food Secure | Insecure Without Hunger | Insecure with Hunger | ||
| Weight status based on BAZ | ||||
| At birth | 0.83 | |||
| Underweight | 27 (38.6) | 22 (31.4) | 21 (30.0) | |
| Normal weight | 49 (38) | 48 (37.2) | 32 (24.8) | |
| Overweight | 17 (41.5) | 12 (29.3) | 12 (29.3) | |
| Before 6 years old | 0.8 | |||
| Underweight | 27 (38.6) | 22 (31.4) | 21 (30) | |
| Normal weight | 49 (38) | 48 (37.2) | 32 (24.8) | |
| Over weight | 17 (41.5) | 12 (29.3) | 12 (29.3) | |
| Height status based on HAZ | ||||
| At birth | 0.35 | |||
| Stunt | 12 (31.6) | 18 (47.4) | 8 (21.1) | |
| Normal stature | 66 (41) | 52 (32.3) | 43 (26.7) | |
| Tall | 15 (36.6) | 12 (29.3) | 14 (34.1) | |
| Before 6 years old | 12 (31.6) | 18 (47.4) | 8 (21.1) | 0.3 |
| Stunt | ||||
| Normal stature | 66 (41) | 52 (32.3) | 43 (26.7) | |
| Tall | 15 (36.6) | 12 (29.3) | 14 (34.1) | |
| Weight status based on WAZ | ||||
| At birth | 0.4 | |||
| Underweight | 14 (35) | 17 (42.5) | 9 (22.5) | |
| Normal weight | 71 (40.8) | 53 (30.5) | 50 (28.7) | |
| Overweight | 8 (30.8) | 12 (46.2) | 6 (23.1) | |
| Before 6 years old | 0.4 | |||
| Underweight | 14 (35) | 17 (42.5) | 9 (22.5) | |
| Normal weight | 71 (40.8) | 53 (30.5) | 50 (28.7) | |
| Overweight | 8 (30.8) | 12 (46.2) | 6 (23.1) | |
Abbreviations: BMI, body mass index; BAZ, BMI-for-age Z-score; HAZ, height-for-age Z-score; HH, household; WAZ, weight-for-age Z-score.
aValues are expressed as No. (%).
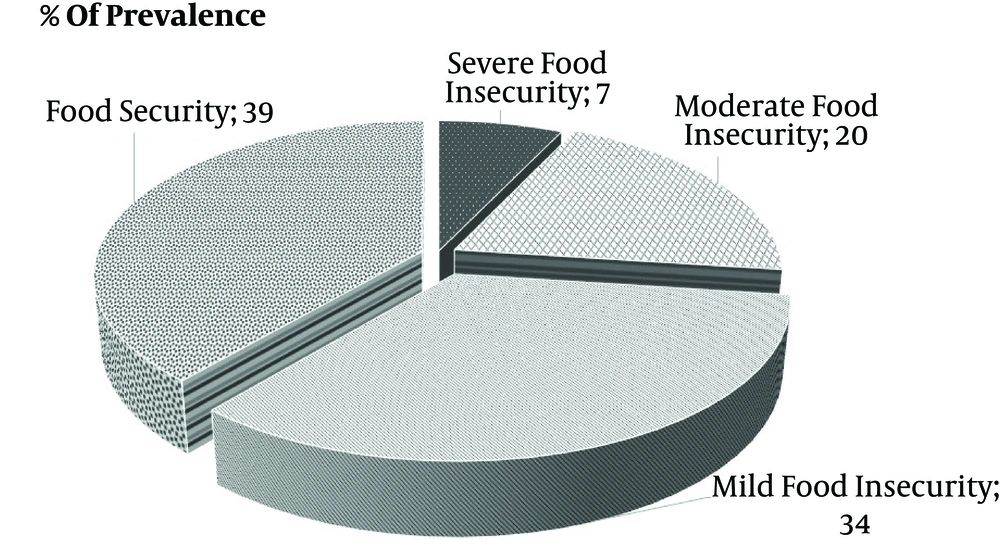
Figure 1.
Prevalence of food insecurity and its levels in the studied households in Mashhad, Golshahr, 2014
A significant association was observed between HH food insecurity and average height of the studied children. There was no significant association between HH food insecurity and child’s birth measurements (P > 0.05), as well as child sex (Table 2).
Comparison of anthropometric status at birth with 1 - 6 years of age in food secure and insecure groups based on Wilcoxon test, are presented in Table 3. There was a significant difference in WAZ-score and BMI for BAZ-score in children from food insecure HH at birth and before the age of 6 years. As the children grew older, the number of underweights, as well as overweights increased and normal weights decreased. No significant difference was observed in anthropometric indices of children in food secure group.
Table 3.
Comparison of Anthropometric Status of Children at Birth and Before Age of 6 Years in Golshahr, Mashhad by HH Food Security Status 2014a
| Anthropometric Status | Food Secure | Food Insecure | ||||
|---|---|---|---|---|---|---|
| At Birth | Under 6 Years Old | P Value | At Birth | Under 6 Years Old | P Value | |
| WAZ | 0.02 | |||||
| Underweight | 14 (15.1) | 27 (29.0) | 0.06 | 26 (17.7) | 45 (30.6) | |
| Normal weight | 71 (76.3) | 59 (63.4) | 103 (70.1) | 85 (57.8) | ||
| Overweight | 8 (8.6) | 7 (7.5) | 18 (12.2) | 17 (11.6) | ||
| HAZ | 0.1 | |||||
| Short stature | 12 (12.9) | 20 (21.5) | 0.9 | 26 (17.7) | 33 (22.4) | |
| Normal stature | 66 (71.0) | 50 (53.8) | 95 (64.6) | 81 (55.1) | ||
| Tall stature | 15 (16.1) | 23 (24.7) | 26 (17.7) | 33 (22.4) | ||
| BAZ | 0.02 | |||||
| Underweight | 27 (29.0) | 42 (45.2) | 0.08 | 43 (29.3) | 60 (40.8) | |
| Normal weight | 49 (52.7) | 45 (48.4) | 80 (54.4) | 72 (49.0) | ||
| Overweight | 17 (18.3) | 6 (6.5) | 24 (16.3) | 15 (10.2) | ||
Abbreviations: BMI, body mass index; BAZ, BMI-for-age Z-score; HAZ, height-for-age Z-score; HH, household; WAZ, weight-for-age Z-score.
aValues are expressed as No. (%).
5. Discussion
To the best of our knowledge, this is the first study evaluating the relationship between anthropometric measurements of children at birth and before the age of 6 years with their HH food security status in Iran. Most food insecurity studies in the country are focused on prevalence of food insecurity and its impact on weight and height of children during childhood and adolescence, but not at birth. The results indicate a high prevalence of food insecurity among the studied HHs (61.2%). The extent of food insecurity observed in this study is higher than in those reported by Saraei et al. in Tabriz (44.9%) (22), as well as Chowdhury et al. in Bangladesh (35.7%) (23). This difference may be due to lower socioeconomic status of the studied HHs in Golshahr and/or as a result of using different questionnaires to assess food security status.
Also, a significant association was observed between anthropometric indices (WAZ and BAZ) of the studied children at birth and before age of 6 years in the children from food insecure households, while birth length was not associated with HH food security status. This finding shows that children in food insecure HH necessarily do not have abnormal weight and length at birth, but growing up in a food insecure HH may lead to abnormal anthropometric status later in life. Saraei et al. in Tabriz, have reported similar results (22). Grilo et al. in New York also reported a non-significant effect of food insecurity on birth weight (24). However, Chowdhury et al. in Bangladesh found that mothers from food-insecure HHs were 37% more likely to give birth to small infants compared to food-secure ones (23). Mozayeni et al. in Tehran also found that 82.1% of pregnant mothers in food insecure condition had LBW infants (25). This discrepancy may be due to the lack of data on food security status during pregnancy. Also, even in the food insecure HHs, mothers do their best endeavor to supply their nutritional needs during pregnancy to give birth to normal babies, especially in the first pregnancies.
On the other hand, it is well documented that HH food security is strongly associated with child nutritional status. A study conducted in Kenya among 6858 urban poor children found that the risk of stunting increased by 12% among food-insecure children (26). Also, a cohort study conducted in rural Bangladesh among 1343 children found that HH food security was associated with greater subsequent weight and length gain, and proportions of underweight and stunting were significantly lower among those in food-secure HHs (27).
Based on the World Health Organization report, girls are more prone to low birth weight (28). However, in the present study, no significant relationship was observed between anthropometric status and children’s sex.
Bryant Borders et al. in a study on 294 pregnant women with the aim to estimate factors influencing the weight of neonates in low-income women have shown that demographic factors such as maternal age, multiple psychosocial factors (e.g. depression) and food insecurity are among the most important contributors to low birth weight of neonates (29). However, in the present study, food insecurity was not a predictor of low birth weight.
This study has some limitations that should be considered in evaluating its findings. Although conducting our project in a district of a large city in Iran, limits the generalizability of the findings, it allows us to gain important insight into the association between food insecurity and birth outcomes among a population at high risk for food insecurity and adverse birth outcomes. Also, anthropometric status of pregnant mother, the amount of weight gain during pregnancy and stress level are all influencing factors on birth weight (30), data of which were not available in the present study.
Finally, start of this study was aligned with the initiation of cash transfer program by the government, which may have affected some participant’s response regarding their income, as higher income could result in discontinuing of their subsidies.