
The Spatial Analysis of COVID-19 Distribution Pattern in Central Iran Using the Local Indicators of Spatial Association (LISA): A Letter to the Editor

Author(s):
Nahid JesriNahid Jesri1, Abedin SaghafipourAbedin SaghafipourAbedin Saghafipour ORCID2,*, Alireza KoohpaeiAlireza Koohpaei3, Babak FarzinniaBabak Farzinnia4, Samaneh AbolkheirianSamaneh AbolkheirianSamaneh Abolkheirian ORCID5, Mahsa sarvyMahsa sarvy6
1Remote Sensing and GIS Centre, Shahid Beheshti University, Tehran, Iran
2Department of Public Health, Faculty of Health, Qom University of Medical Sciences, Qom, Iran
3Department of Occupational Health and Safety, Faculty of Health, Qom University of Medical Sciences, Qom, Iran
4Department of Environmental Health Engineering, Faculty of Health, Qom University of Medical Sciences, Qom, Iran
5Department of Health Education and Promotion, School of Public Health, Tehran University of Medical Sciences, Tehran, Iran
6Student Research Committee, Qom University of Medical Sciences, Qom, Iran
*Corresponding Author: Department of Public Health, Faculty of Health, Qom University of Medical Sciences, Qom, Iran. Email: [email protected]

Shiraz E-Medical Journal:Vol. 22, issue 11; e115000
Published online:Aug 17, 2021
Article type:Letter
Received:Apr 07, 2021
Accepted:Apr 25, 2021
How to Cite:Jesri N, Saghafipour A, Koohpaei A, Farzinnia B, Abolkheirian S, et al. The Spatial Analysis of COVID-19 Distribution Pattern in Central Iran Using the Local Indicators of Spatial Association (LISA): A Letter to the Editor. Shiraz E-Med J. 2021;22(11):e115000. doi: https://doi.org/10.5812/semj.115000

Dear Editor,
In late 2019, a novel virus called severe acute respiratory syndrome coronavirus 2 (SARS-CoV-2) was identified in Wuhan, Hubei Province, China, which was reported to be the cause of cases of pneumonia. The disease spread rapidly, and after the epidemic in China, its cases increased throughout the world (1). In recent years, the use of GIS has increased significantly in order to determine the geographical distribution patterns of diseases in medical and health sciences (2-4). In order to determine the spatial patterns of diseases, the local indicators of spatial association (LISA) in environmental GIS are substantially helpful. This model includes a set of methods to describe and visualize spatial distribution, identify atypical locations or spatial outliers, determine the patterns of spatial associations, clusters, or hot-spots, and finally propose spatial regimes or other types of spatial heterogeneity (5). Due to the spread of COVID-19 in many countries worldwide, including Iran, and particularly Qom Province as the origin of the disease in the country, there is a need to control and prevent disease propagation as much as possible by determining the spatial pattern and geographical distribution of the disease in different districts and areas of Qom Province to identify its high-risk areas. Subsequently, controlling and preventive measures can be carried out more purposefully. Therefore, this study was designed to analyze the spatial distribution pattern of COVID-19 in central Iran using the LISA model. Geographical analyses to identify the geographical factors affecting the spread of the COVID-19 infection can help modify public health policies to constrain the virus. The aim of this study was to conduct a spatial analysis on COVID-19 affected regions in Qom Province using the LISA model. In a descriptive-analytical study, all the individuals infected with COVID-19 in Qom Province from February 19 to September 2020 were included in the study. The spatial distribution in urban areas was determined using the Moran coefficient in GIS. In addition, the spatial autocorrelation of the coronavirus was calculated in different urban districts of the province using the LISA method. The prevalence of COVID-19 in Qom Province was estimated to be 356.75 per 100,000 population. The spatial distribution maps of the COVID-19 disease in Qom Province showed that most cases (97%) of the disease occurred in the Markazi District and in the city of Qom, and a few cases (3%) had been reported from rural districts. The prevalence of COVID-19 in urban districts was 350.49 per 100,000 people, and in the rural areas of Qom Province, it was estimated at 4.51 per 100,000 population. Regarding the prevalence of this disease in urban areas, the District 7 (Holy shrine), District 4 (Zanbilabad-Salarieh), and District 6 (Imamzadeh Ebrahim Street) had the highest incidence rates of the disease in Qom City (Table 1).
Table 1.Prevalence of COVID-19 Infection in Urban Areas of Qom Province, Central Iran, from February 19, 2020, to September 2020
Urban DistrictsPopulationCasesIncidence/100,000
178401243309.94
2192060671349.37
3189708642338.41
4171363808471.51
5192755642333.06
6213356930435.89
741625227545.34
8121890225184.59
With the spread of the novel coronavirus in Qom Province since February 19, 2020, in order to conduct the point pattern analysis of COVID-19 in the province, Moran's Index was calculated (Moran's Index: 0.106709, Z-score: 1.730283, and p-value: 0.083580 with 90% confidence interval). Accordingly, the spatial distribution pattern of the COVID-19 disease in Qom Province was drawn (Figure 1), which indicated that the highest prevalence of the disease was related to the urban districts of seven, four, and six, respectively (Table 1). Based on this analysis on the incidence of the COVID-19 infection, District 3 (Imam Khomeini St.) and District 6 (Imamzadeh Ebrahim St.), as two urban districts in the Province, were placed in the HH category of the LISA model, highlighting them as two foci of COVID-19 in Qom Province (Figure 2). This means that the incidence of the disease in these two districts is higher (above average), and at the same time, the two districts are also surrounded by areas with a high incidence of COVID-19 (i.e., high-value areas). Also, autocorrelation in these two urban districts was positive and included more than one-third of the population of Qom (33.55%). In addition, based on the LISA model, District 1 (Bajak), an urban region, was placed in the LH category, meaning that it was a low-value area surrounded by high-value regions (Figure 2). One of the most important geographical factors affecting the incidence of the coronavirus infection based on the spatial distribution model was distance or spatial proximity. So, health policymakers should impose more restrictions to ensure the observance of health protocols by people to contain the coronavirus.
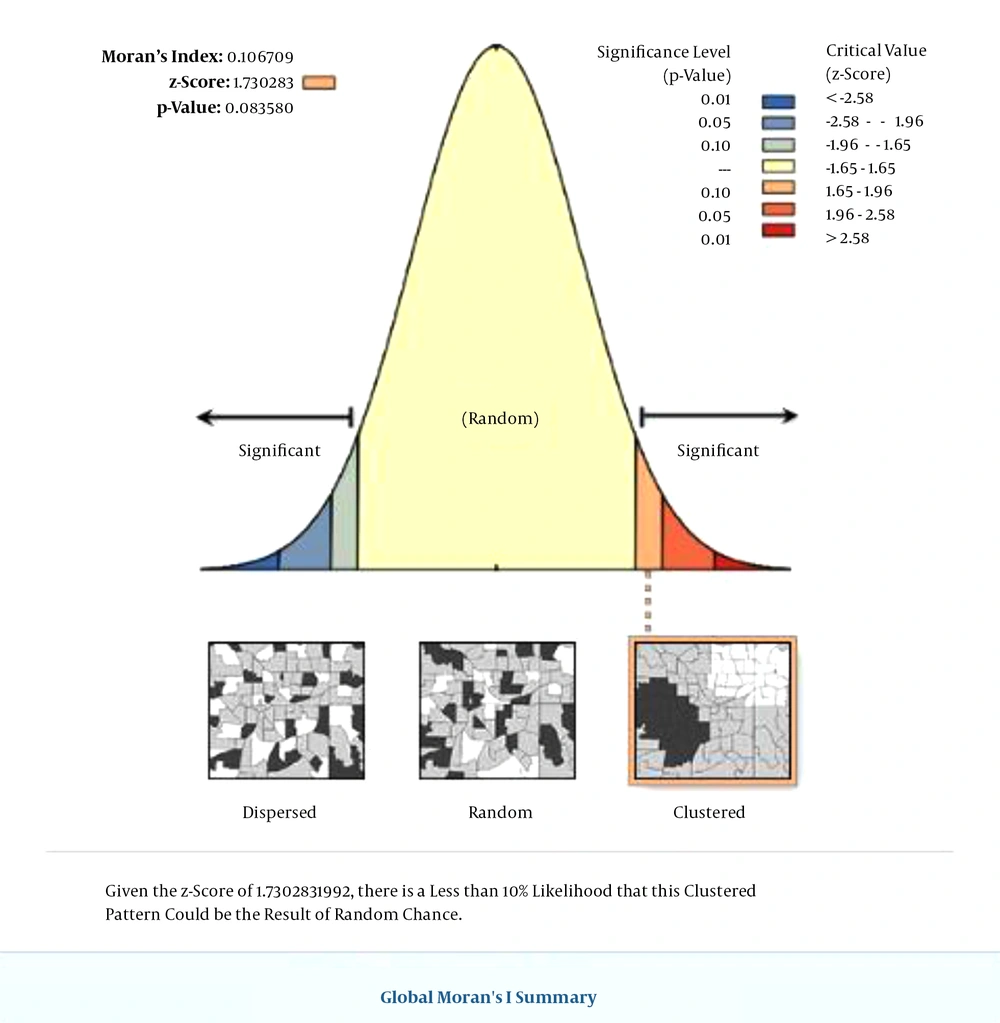
The point pattern analysis of COVID-19 in Qom Province from February 19, 2020, to September 2020.
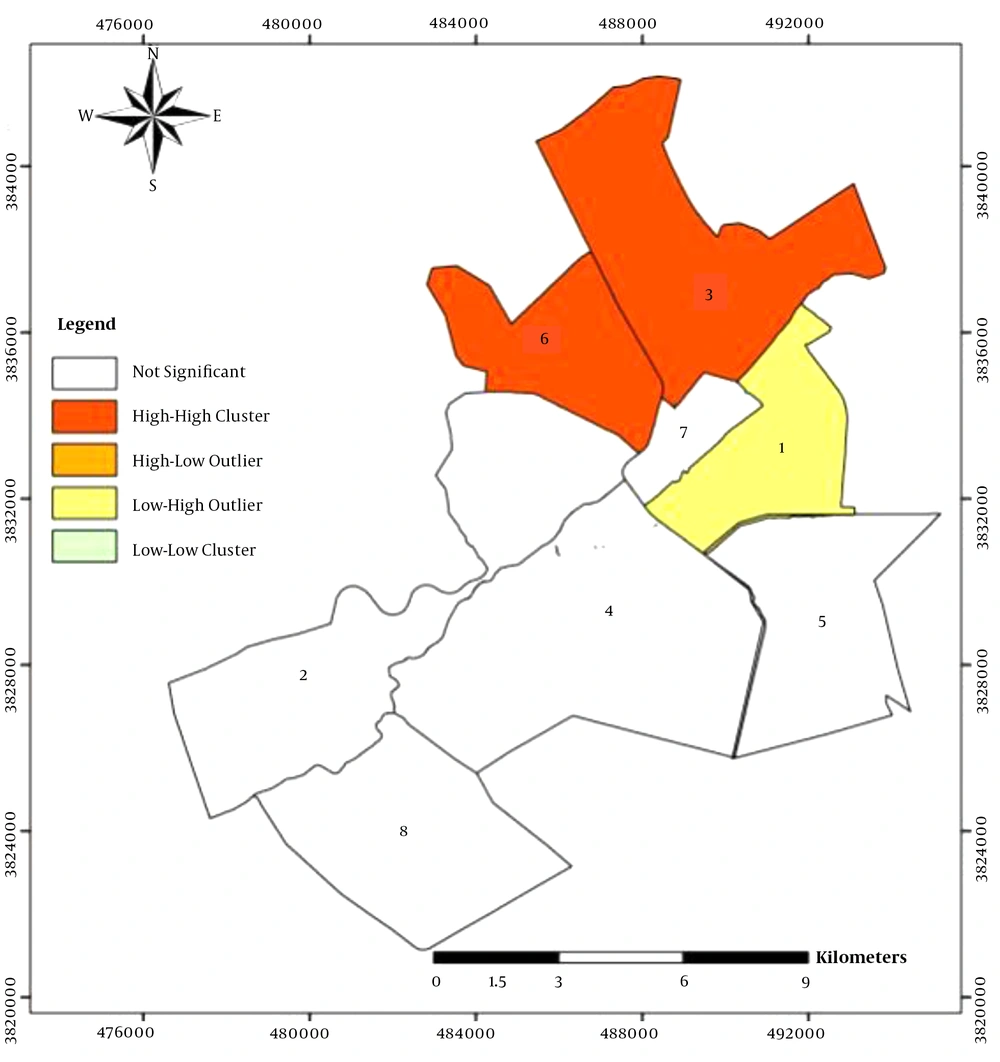
Figure 1.

The point pattern analysis of COVID-19 in Qom Province from February 19, 2020, to September 2020.

The spatial autocorrelation of the novel coronavirus using the local indicators of spatial association (LISA) in the urban districts of Qom City from February 19, 2020, to September 2020.
Figure 2.

The spatial autocorrelation of the novel coronavirus using the local indicators of spatial association (LISA) in the urban districts of Qom City from February 19, 2020, to September 2020.

Footnotes

  • Authors' Contribution: AS and NJ contributed to designing the study and drafting the manuscript. AS, AK, MS, and SA were involved in data collection and data entry into the statistical software. AS, NJ, and BF contributed to data analysis. AS participated in study design and data analysis and drafted the original manuscript. AS and NJ participated in drafting the manuscript.

  • Conflict of Interests: The authors declare that they have no conflict of interest.

  • Ethical Approval: An ethical code was assigned to the study by the Institutional Ethics Committee of Qom University of Medical Sciences (code: IR.MUQ.REC.1399.036).

  • Funding/Support: Qom University of Medical Sciences supported the study.

References

  • 1.
    Chen N, Zhou M, Dong X, Qu J, Gong F, Han Y, et al. Epidemiological and clinical characteristics of 99 cases of 2019 novel coronavirus pneumonia in Wuhan, China: a descriptive study. Lancet. 2020;395(10223):507-13. [PubMed ID: 32007143]. [PubMed Central ID: PMC7135076]. https://doi.org/10.1016/S0140-6736(20)30211-7.
  • 2.
    Salimi M, Jesri N, Javanbakht M, Farahani LZ, Shirzadi MR, Saghafipour A. Spatio-temporal distribution analysis of zoonotic cutaneous leishmaniasis in Qom Province, Iran. J Parasit Dis. 2018;42(4):570-6. [PubMed ID: 30538355]. [PubMed Central ID: PMC6261142]. https://doi.org/10.1007/s12639-018-1036-5.
  • 3.
    Mohammadbeigi A, Saghafipour A, Jesri N, Tarkhan FZ, Jooshin MK. Spatial distribution of vaccine-preventable diseases in central Iran in 2015-2018: A GIS-based study. Heliyon. 2020;6(9). e05102. [PubMed ID: 33024873]. [PubMed Central ID: PMC7527658]. https://doi.org/10.1016/j.heliyon.2020.e05102.
  • 4.
    Akbarzadeh K, Saghafipour A, Jesri N, Karami-Jooshin M, Arzamani K, Hazratian T, et al. Spatial Distribution of Necrophagous Flies of Infraorder Muscomorpha in Iran Using Geographical Information System. J Med Entomol. 2018;55(5):1071-85. [PubMed ID: 29982597]. https://doi.org/10.1093/jme/tjy098.
  • 5.
    Anselin L. Exploratory spatial data analysis in a geocomputational environment. Geocomputation: A Primer. Chichester New York: Wiley; 1998.

Copyright

Copyright © 2021, Author(s). This is an open-access article distributed under the terms of the Creative Commons Attribution-NonCommercial 4.0 International License (http://creativecommons.org/licenses/by-nc/4.0/) which permits copy and redistribute the material just in noncommercial usages, provided the original work is properly cited.

Similar Articles

16
Jan
2023
Middle East J Rehabil Health Stud

Spatio-temporal Analysis of COVID-19: A Global Study

Sajjad Rahimi Pordanjani,
Maryam Mohammadian,
Somayeh Derakhshan,
Fatemeh Hadavandsiri,
Seyed Saeed Hashemi Nazari,
Mohammad Hossein Panahi

Rahimi Pordanjani S, Mohammadian M, Derakhshan S, Hadavandsiri F, Hashemi Nazari SS, et al. Spatio-temporal Analysis of COVID-19: A Global Study. Middle East J Rehabil Health Stud. 2023;10(2):e131344. doi: https://doi.org/10.5812/mejrh-131344

11
Apr
2021
J Arch Mil Med

COVID-19 in Eastern Mediterranean Region Countries

Leila Moradi

Moradi L. COVID-19 in Eastern Mediterranean Region Countries. J Arch Mil Med. 2020;8(4):e112671. doi: https://doi.org/10.5812/jamm.112671

7
May
2022
J Kermanshah Univ Med Sci

The Referral Pattern in a Central Hospital in Iran During the First COVID-19 Peak: The Role of Media and Health Planning

Zahra Khazaeipour,
Ali Sheikhy,
Aida Fallahzadeh,
Soroush Khojasteh-Kaffash,
Ali Fanoodi,
Zahra Ahmadinejad
,et al.

Khazaeipour Z, Sheikhy A, Fallahzadeh A, Khojasteh-Kaffash S, Fanoodi A, et al. The Referral Pattern in a Central Hospital in Iran During the First COVID-19 Peak: The Role of Media and Health Planning. J Kermanshah Univ Med Sci. 2022;26(1):e122601. doi: https://doi.org/10.5812/jkums-122601

19
Aug
2024

Comparison of Clinical, Laboratory, and Radiological Symptoms of Patients Hospitalized in the COVID-19 Wards of Imam Reza Hospital in Mashhad During the First, Second, and Third Peaks of COVID-19

Hamed Ferdowsi Moghadam,
Ali Shamshirian,
Lida Jarahi,
Mostafa Mansouri,
Mahnaz Mozdorian

Ferdowsi Moghadam H, Shamshirian A, Jarahi L, Mansouri M, Mozdorian M. Comparison of Clinical, Laboratory, and Radiological Symptoms of Patients Hospitalized in the COVID-19 Wards of Imam Reza Hospital in Mashhad During the First, Second, and Third Peaks of COVID-19. Shiraz E-Med J. 2024;25(9):e135928. doi: https://doi.org/10.5812/semj-135928

9
Dec
2021
Mod Care J

Clinical, Demographic, and Epidemiological Characteristics of Patients Diagnosed with COVID-19 in Zahedan, Southeastern Iran

Behzad Shahi,
Faeze Kazemi,
Shahaboddin Mashaei,
Mahdi Foroughian,
Maryam Ziaei,
Shaghayegh Rahmani

Shahi B, Kazemi F, Mashaei S, Foroughian M, Ziaei M, et al. Clinical, Demographic, and Epidemiological Characteristics of Patients Diagnosed with COVID-19 in Zahedan, Southeastern Iran. Mod Care J. 2021;18(4):e115121. doi: https://doi.org/10.5812/modernc.115121

Download PDF1.37 MB
Indexed in

Crossmark

Crossmark

Checking

Share on
Cited by
Metrics

Ordering Reprints

Articles are published under the Creative Commons license stated on each article. No permission or royalty fee is required for uses permitted by that license. CCC handles optional bulk and customized reprint orders. Any quotation covers production and delivery services only, not copyright permission. > Request Reprints from CCC 

Search Relations

Author(s):

Related Articles

