
1. Background
Growing industrial activity and extensive consumption of nonrenewable energy sources have substantially increased air pollution, adversely affecting urban populations through respiratory disease and the exacerbation of heart and lung disease (1). Meteorological factors such as humidity, sunshine duration, temperature, pressure, and solar radiation can influence atmospheric pollutant concentrations and their adverse effects on populations and ecosystems (1).
Geography and the geological structure of a region are important determinants of health and disease. From this perspective, a country's geological structure also influences basic human needs, including water, food, respiration, and shelter (2). Geological factors such as rocks, elements, mines, and minerals may affect people directly or indirectly; therefore, health and disease patterns may vary across geographic regions. Medical geology, as a scientific field, examines the positive and negative effects of the geological environment on the health of humans, animals, and plants. Factors such as temperature, humidity, pressure, wind direction, and cold are also considered in medical geography. In addition, this field examines relationships between planetary events and disease development, including causes and consequences (3). General atmospheric circulation influences pollutant concentrations and can exacerbate harmful effects on ecosystems and individuals. Changes in atmospheric gas composition can affect terrestrial life and disrupt ecological balance. Human activities have also contributed substantially to climate change, threatening human health and ecosystems (4).
Air pollution is a major environmental health risk. Particulate matter with a diameter of 2.5 μm or less (PM2.5) contributes to approximately 2 million premature deaths annually and has been ranked as the 13th leading cause of mortality worldwide (5). Even low levels of air pollutants have been associated with increased cardiorespiratory disease (6).
Exposure to air pollution, particularly particulate matter with diameters smaller than 10 μm (PM10) and 2.5 μm (PM2.5), has received substantial attention because of its potential associations with cardiovascular disease, diabetes mellitus, lung cancer, and chronic obstructive pulmonary disease (COPD) (4, 7-9). A previous study showed greater susceptibility to viruses in a group exposed to NO2 than in a control group, and a study conducted in Beijing from 2008 to 2014 found that air pollutants increased the risk of influenza (10, 11).
In December 2019, numerous cases of pneumonia of unknown etiology were detected in Wuhan, China. Molecular analysis of samples from affected patients showed infection with a novel coronavirus, later named severe acute respiratory syndrome coronavirus 2 (SARS-CoV-2), the causative agent of coronavirus disease 2019 (COVID-19) (12). Within 5 months, the disease had affected more than 210 countries and developed into a global pandemic with major public health consequences (13).
Extensive research into the pathogenesis of COVID-19 suggests that severe disease may result from an excessive inflammatory response (14), but the exact predisposing factors contributing to greater clinical severity and mortality remain unclear. Because chronic exposure to air pollution increases respiratory and cardiovascular toxicity (15), air pollution has been hypothesized to contribute to COVID-19 severity (16, 17). Early reports indicated that geographic patterns of COVID-19 transmission and mortality across and within countries were associated with local air pollutant levels (17).
2. Objectives
This study examined the relationships between climatic factors, including temperature, pressure, and humidity, and atmospheric pollutants, including CO, SO2, NO2, O3, hydrocarbons, PM10, and PM2.5, and the prevalence of COVID-19 in Iran. This study provides a nationwide ecological analysis of associations between air pollutants and COVID-19 across 31 Iranian provinces during the early phase of the pandemic, using real-time monitoring data rather than model-based estimates.
3. Methods
3.1. Study Design and Setting
This ecological study was conducted across 31 Iranian provinces in which substantial COVID-19 outbreaks were reported. Iran is located in Southwest Asia and includes extensive mountainous and desert regions. Eastern Iran is dominated by a high plateau with large salt flats and broad sandy deserts; the plateau is surrounded by higher mountain ranges, including the Zagros Mountains in the west and the Alborz Mountains in the north. Figure 1 shows the geographic location of the Iranian provinces.
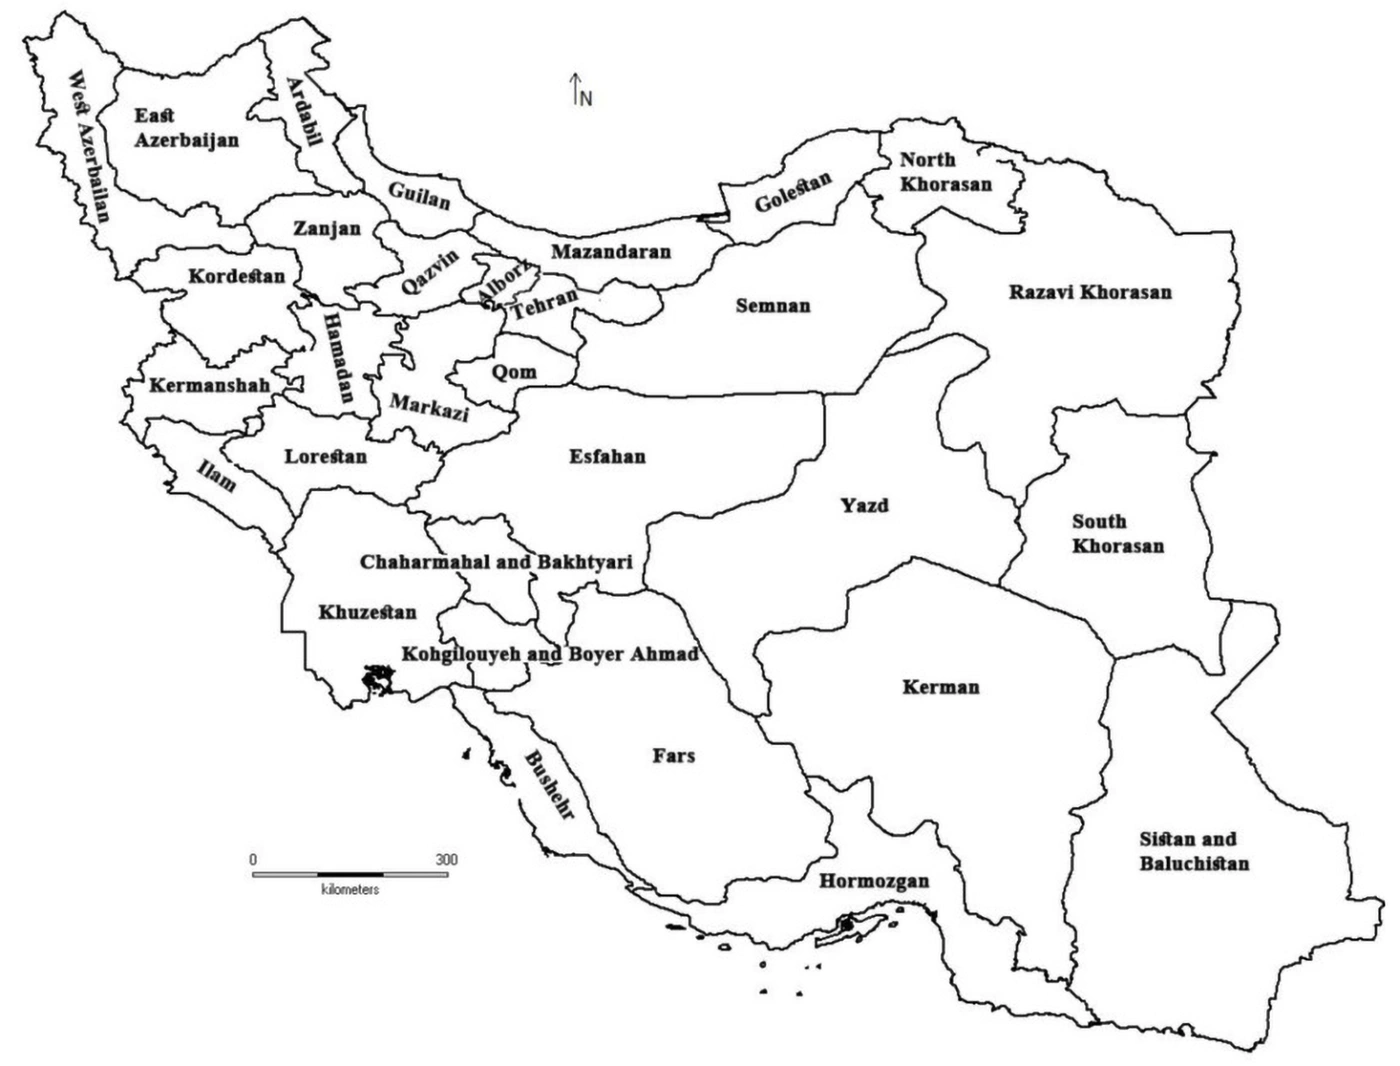
Figure 1.
Map of the geographical location of Iran's provinces
3.2. Data Sources and Measurements
Data on air pollutants were obtained from meteorological monitoring stations, and officially reported COVID-19 case counts were obtained from the websites of the Iranian Ministry of Health and provincial health centers. Weather conditions and COVID-19 case counts were compared during the same observation period. A publicly available database was used, and no human participants were directly involved in this study, in accordance with the relevant regulations of the US Department of Health and Human Services. The study followed the Strengthening the Reporting of Observational Studies in Epidemiology (STROBE) guidelines.
The study used regional- and subregional-level information to estimate the relationship between air pollution and COVID-19 in Iran, following the general approach described previously (18).
Weather information, including temperature, pressure, humidity, and radiation, was obtained from provincial meteorological stations for the study period from February 20 to April 20, 2020. Air quality index (AQI) data were also obtained. Across air-quality monitoring stations, beta attenuation monitoring, UV fluorescence, infrared absorption, chemiluminescence, and UV spectrophotometry were used to measure PM10, PM2.5, SO2, CO, NO2, and O3, respectively.
The permissible limits for major air pollutants are presented in Table 1.
Table 1.
Air Pollution Standards
| Air Pollution Standards (WHO) | Standard Duration | Concentration | Air Pollution Standards in Iran a |
|---|---|---|---|
| CO | 8 hours | 9 mg/m3 | 9 mg/m3 |
| CO | 1 hour | 35 mg/m3 | 35 mg/m3 |
| SO2 | 24 hours | 140 μg/m3 | 100 μg/m3 |
| SO2 | Annually | 31 μg/m3 | 20 μg/m3 |
| NO2 | 1 hour | 210 μg/m3 | 40 μg/m3 |
| NO2 | Annually | 53 μg/m3 | - |
| O3 | 1 hour | 12 mg/m3 | 0.05 mg/m3 |
| PM10 | 24 hours | 150 μg/m3 | 50 μg/m3 |
| PM10 | Annually | 50 μg/m3 | 20 μg/m3 |
| Pb | Trimester | 1.5 μg/m3 | 0.5 μg/m3 |
| THC (NMHC) | 3 hours | 0.24 ppm | 1 ng/m3 |
a Iran's clean-air standards approved in August 2018.
Table 2 lists the standard pollutant index limits (19). The AQI is an indicator developed by government agencies to communicate current or forecast air pollution and its associated public health risk. As the AQI increases, health risks also increase. Children, older adults, and individuals with respiratory or cardiovascular conditions are typically among the first groups affected by poor air quality. When the AQI is high, authorities generally advise people to reduce outdoor physical activity or avoid outdoor exposure. During wildfire-related episodes of high AQI, the use of an N95 respirator outdoors and an air purifier with high-efficiency particulate air and activated-carbon filters indoors may also be encouraged (20).
Table 2.
Pollutant Standards Index Values
| Weather Conditions | PSI Values |
|---|---|
| Clean | 0 - 50 |
| Allowed | 51 - 100 |
| Unhealthy | 101 - 199 |
| Very unhealthy | 200 - 299 |
| Dangerous | 300 |
Table 3 presents the conversion of pollutant concentrations to the standard pollutant index (21). The pollutant standards index (PSI) is based on 6 pollutants: CO, SO2, NO2, O3, PM10, and PM2.5. For each pollutant, a subindex is calculated using a segmented linear function that transforms ambient concentrations to a scale from 0 to 500. In this study, daily reports of all air pollutants recorded at monitoring stations in provincial centers were obtained, and monthly averages were used in the analysis. Figure 2 shows the average levels of several air pollutants across Iran.
Table 3.
Converting Pollutant Concentrations to the Standard Indicator of Pollutants
| PSI | Index Categories | CO, 8 h (mg/m3) | SO2, 24 h (μg/m3) | NO2, 1 h (μg/m3) | O3, 1 h (mg/m3) | PM10, 24 h (μg/m3) | PM2.5, 24 h (μg/m3) |
|---|---|---|---|---|---|---|---|
| 0 - 50 | Good | 0 - 5.0 | 0 - 80 | 0 | 0 - 118 | 0 - 50 | 0 - 12 |
| 51 - 100 | Moderate | 5.1 - 10 | 80 - 365 | 0 | 119 - 157 | 51 - 150 | 13 - 55 |
| 101 - 200 | Unhealthy | 10.1 - 17.0 | 366 - 800 | 1130 | 158 - 235 | 151 - 350 | 56 - 150 |
| 201 - 300 | Very unhealthy | 17.1 - 34.0 | 800 - 1600 | 1131 - 2260 | 236 - 785 | 351 - 420 | 151 - 250 |
| > 300 | Hazardous | > 35 | > 1600 | > 2260 | > 786 | > 421 | > 251 |
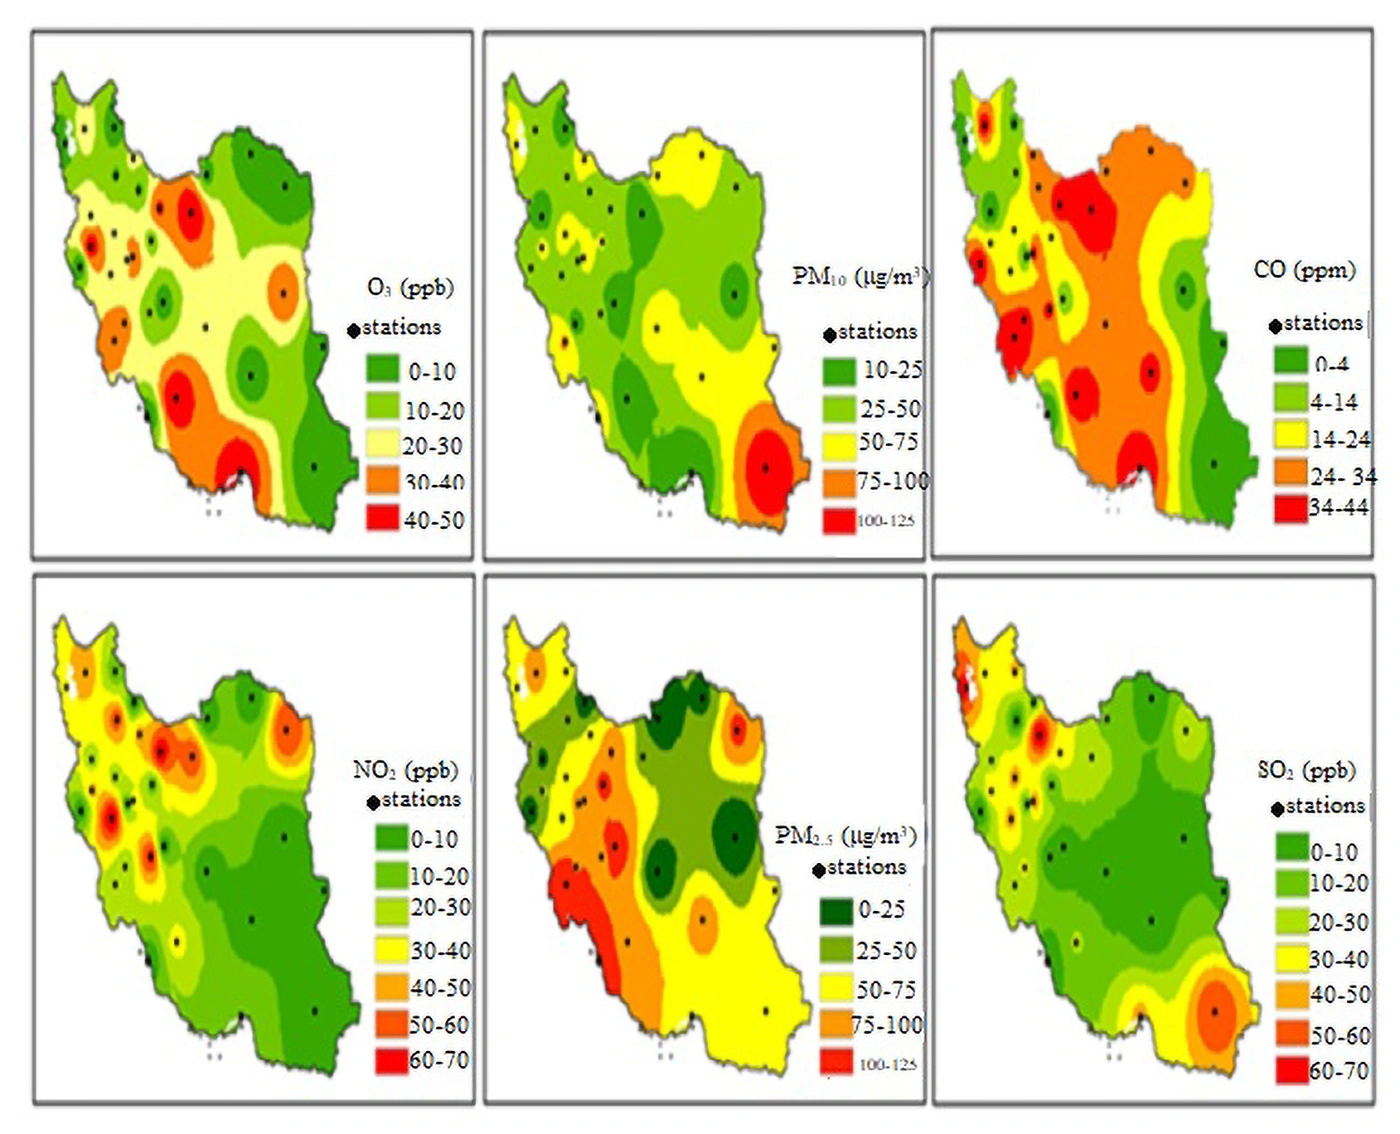
Figure 2.
Average status of various air pollutants in different provinces of Iran (February 20 to April 20, 2020)
3.3. Statistical Analysis
All statistical analyses were performed using SPSS version 26 (IBM Corp., Armonk, NY, USA). The normality of the distribution of each pollutant and the number of COVID-19 cases was first examined using the Kolmogorov-Smirnov test. Because the data were normally distributed (data not shown), Pearson correlation coefficients were used to assess linear relationships between each pollutant and the number of COVID-19 cases at the provincial level. Results are reported as correlation coefficients (r), 95% confidence intervals (CIs), and P values.
Multivariate linear regression models were then used to adjust for demographic confounding. The dependent variable was the number of COVID-19 cases in each province. Independent variables included mean concentrations of CO, SO2, NO2, O3, PM10, and PM2.5, with population density included as a confounding variable. Results are reported as unstandardized beta coefficients (B) with 95% CIs. Statistical significance was defined as P < 0.05.
3.4. Methodological Limitations
Because of the ecological study design and limited access to individual-level data, it was not possible to adjust for age, underlying diseases, travel patterns, testing and reporting rates, or quarantine measures. Population density was included in the regression model as the principal regional-level confounder.
4. Results
4.1. Descriptive Statistics of Air Pollutants
More than half of urban air pollution is attributed to CO from incomplete fuel combustion in vehicle engines. Carbon monoxide binds strongly to hemoglobin, forming carboxyhemoglobin and reducing oxygen transport. Exposure may lead to headaches, nausea, visual disturbances, and palpitations.
The 8-hour standard concentration for CO was 9 ppm. According to data from the national air-quality monitoring system, CO pollution was higher on March 11 than on other days, with the highest levels observed in Tehran, Ahvaz, and Bandar Abbas. As shown in Figure 3A, average CO levels remained high until March 18 and decreased from March 19 through April 19. Possible reasons for this reduction include temporary industrial closures and reduced traffic during the COVID-19 outbreak, as well as the Nowruz holidays.
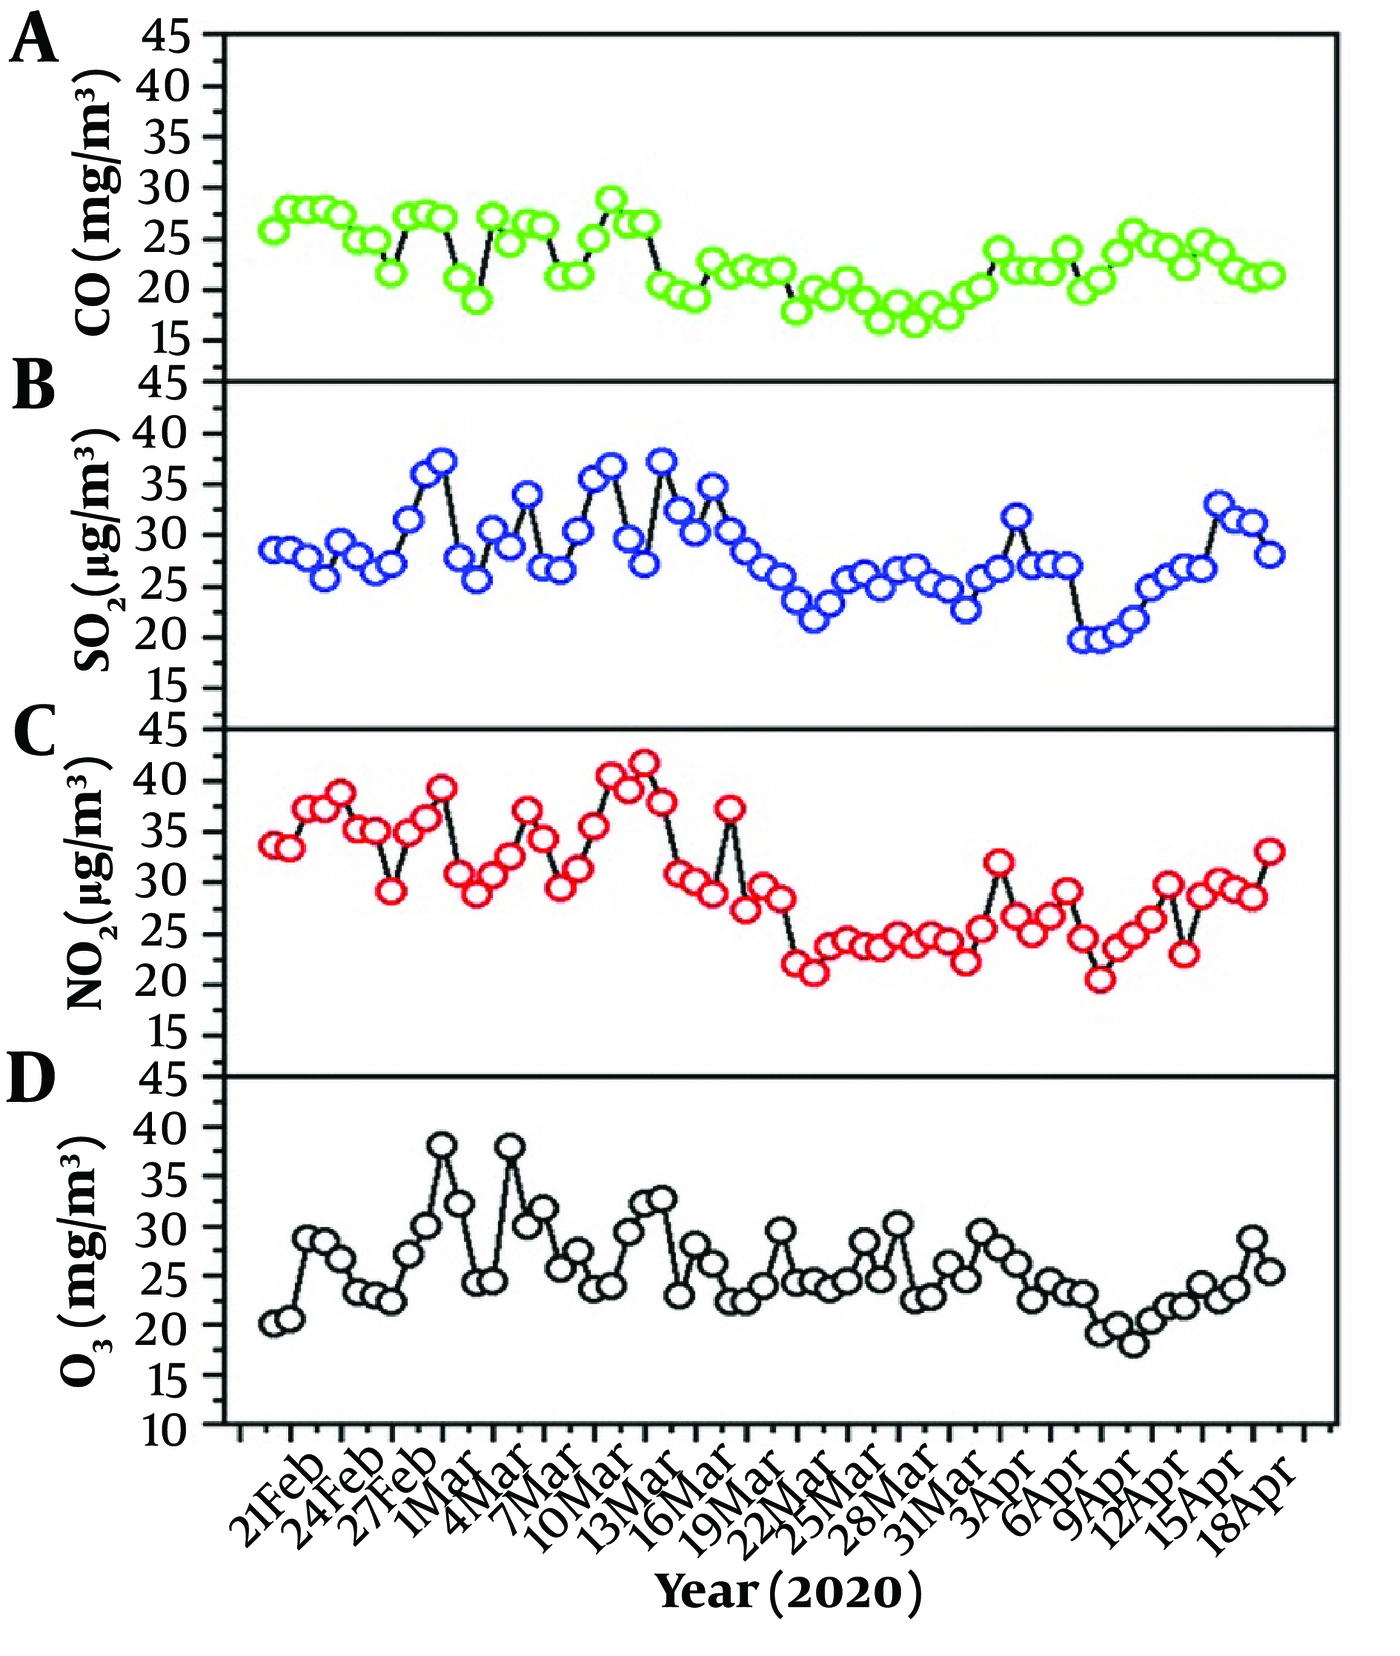
Figure 3.
Variation in air pollutants in different provinces of Iran: (A) CO, (B) SO2, (C) NO2, and (D) O3
According to Table 3, the CO concentration during this period was in the moderate range and would have entered the unhealthy range with an increase of approximately 1 mg/m3.
4.2. Sulfur Dioxide
Sulfur dioxide (SO2) is a colorless gas released through fossil-fuel combustion. It dissolves in water and raindrops and can form sulfur trioxide and sulfuric acid in the atmosphere. Inhalation of sulfuric acid combined with soot, suspended particles, and smoke may contribute to respiratory injury. Sulfur dioxide exposure has also been associated with anxiety and mental health effects.
Figure 3B shows SO2 levels across Iranian provinces. The reported values did not exceed the standard. SO2 increased until March 6 and decreased starting on March 7. It increased slightly from March 22 to April 3 and again after April 4, with a sharper increase on April 16 and a peak on April 20. One possible explanation is fossil-fuel consumption for industry and household heating. Higher pollution levels were reported in Arak, Qazvin, Urmia, and Ardabil, where lower temperatures may increase household heating demand, particularly during periods when residents remained at home because of pandemic-related closures.
4.3. Nitrogen Oxides
Measurements across Iranian provinces showed that NO and NO2 did not exceed the reported standard limit of 120 ppb during the study period. As shown in Figure 3C, NO2 increased until March 13 and then decreased through April 18, possibly because of pandemic-related closures. Levels began to increase again on April 19 and rose sharply on April 20. The highest values were observed in Mashhad, whereas Khorramabad and Tehran also had relatively high NO2 levels.
4.4. Hydrocarbons and Volatile Organic Compounds
Although hydrocarbons and volatile organic compounds (VOCs) are important pollutants, they were not measured in the meteorological reports. Therefore, daily trends could not be evaluated.
4.5. Ozone and Other Oxidants
The permissible concentration of tropospheric ozone was reported as 12 ppb per hour. Ozone levels were higher on March 1 and March 5 than on other days, with the highest levels observed in Hamadan, Yazd, Shiraz, and Bandar Abbas (Figure 3D). Ozone levels decreased with reductions in nitrogen oxide production during industrial closures and reduced traffic. A marked decrease was observed after April 9, followed by an increase on April 20.
4.6. Particulate Matter
The highest PM10 levels during the study period were observed on February 27 and March 2 in Iranshahr, Zabol, and Khorramabad; the March 2 value in Khorramabad was markedly higher than values in other locations. The highest PM2.5 levels were observed on February 25 and 28 in Iranshahr and Bandar Abbas. The highest PSI values, mainly related to PM2.5, were observed in Iranshahr and Zabol.
According to the PSI, 62% of the study days were in the allowable range and 38% were in the clean range (Figure 4). These areas were affected by dust storms during the study period, resulting in higher concentrations of suspended particles. The highest reported PM2.5 value was 94.28 μg/m3, and the highest PM10 value was 80.95 μg/m3. According to Table 3, PM2.5 was in the unhealthy range and PM10 was in the moderate range.
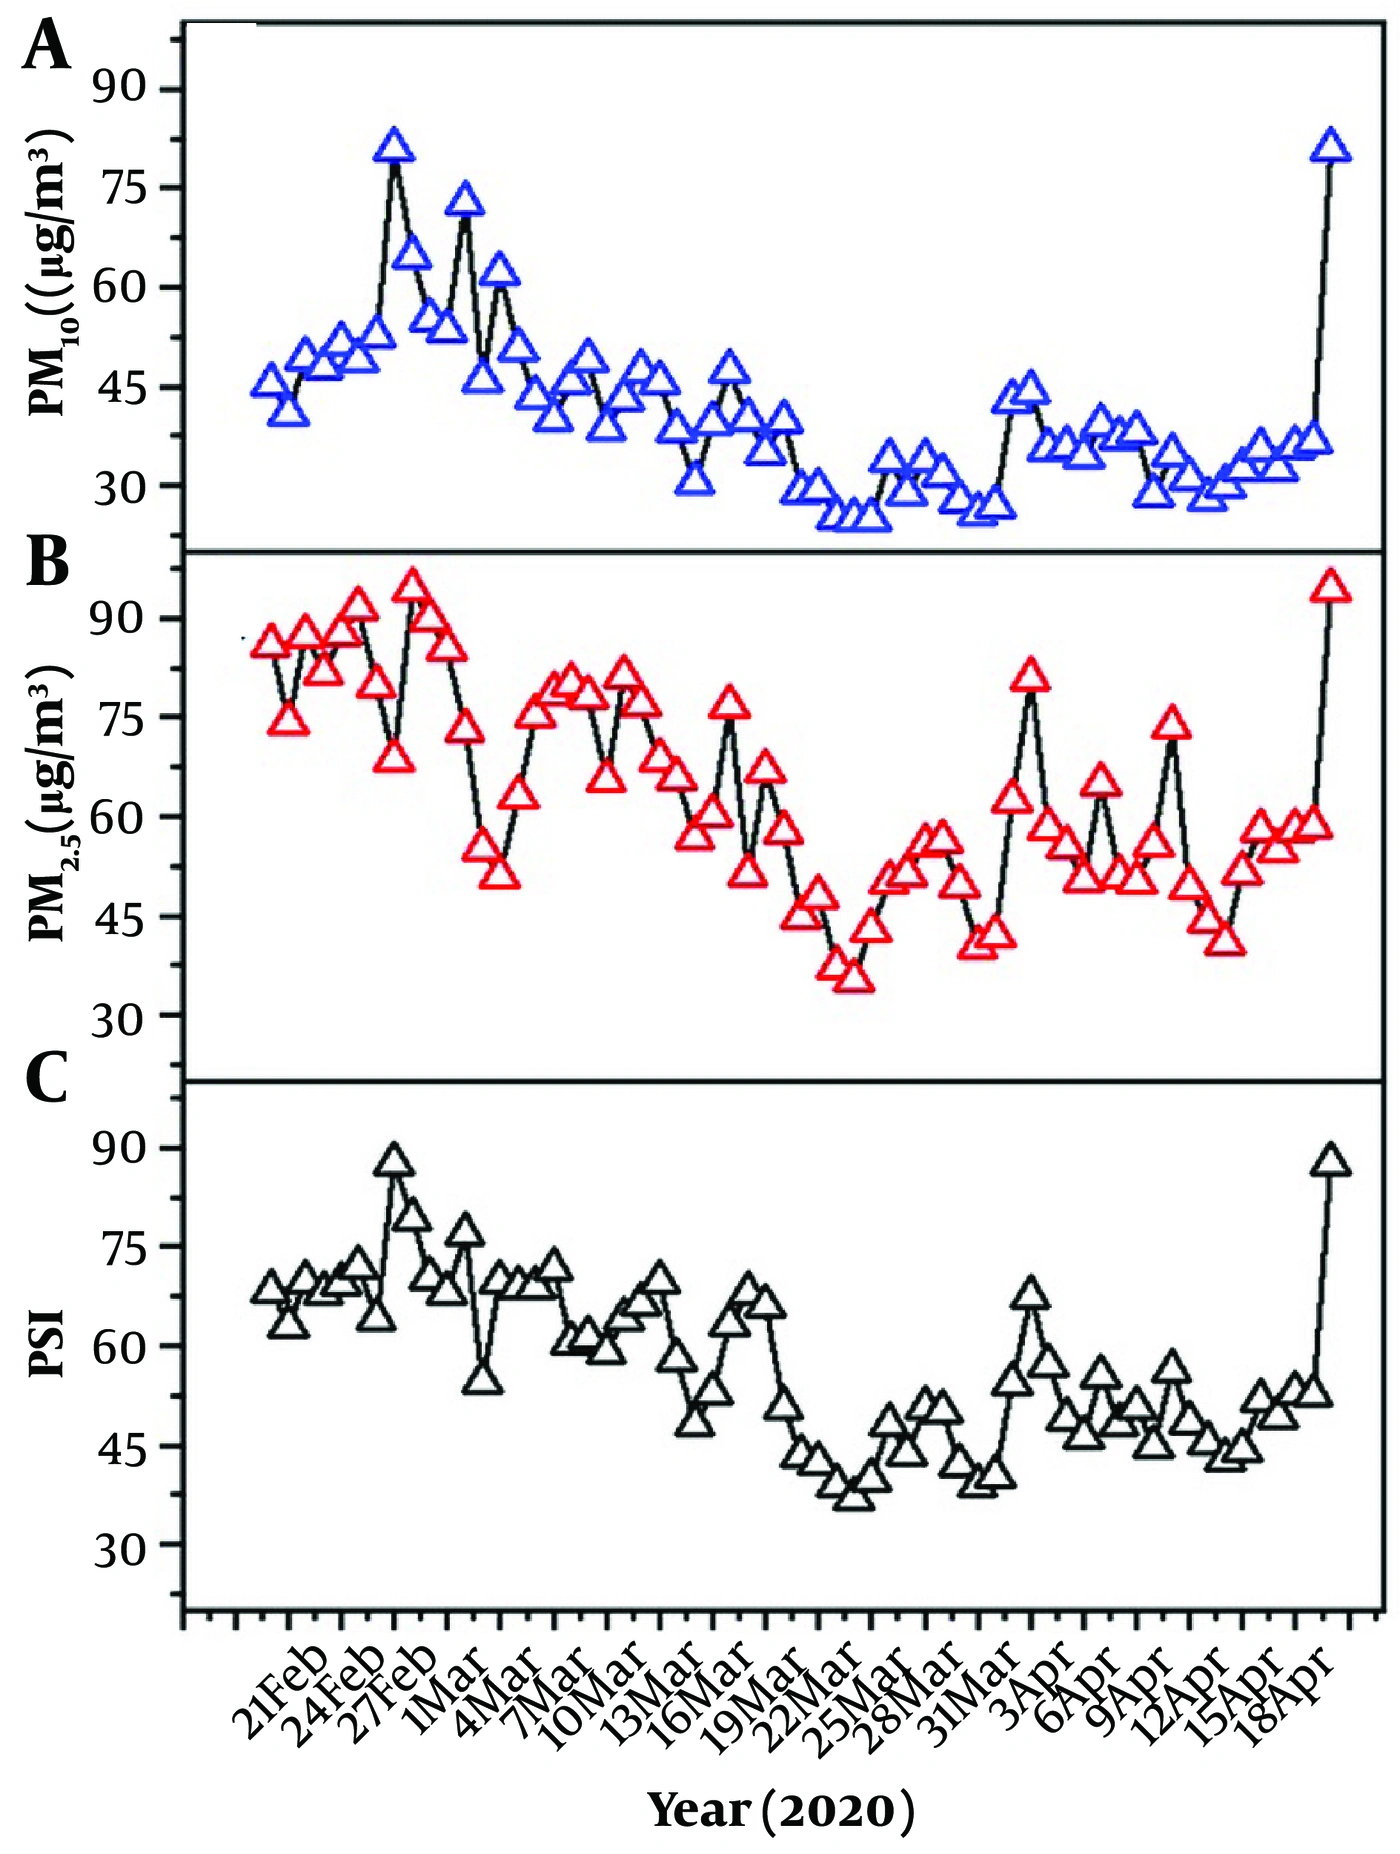
Figure 4.
Variation in air pollutants in different provinces of Iran: (A) PM10, (B) PM2.5, and (C) PSI values
The permissible limit for airborne particles was reported as 150 μg/m3. The highest pollution level was observed in Khorramabad on March 2. During the study period, SO2 and NO2 levels did not exceed the reported standards, whereas CO and suspended particles contributed substantially to air pollution.
4.7. Correlation and Regression Analyses
The relationships between the studied pollutants and COVID-19 cases are shown in Table 4. PM2.5 showed the strongest positive correlation with COVID-19 cases (r = 0.824, 95% CI, 0.636 - 0.928; P < 0.001), followed by PM10 (r = 0.796, 95% CI, 0.592 - 0.912; P < 0.001). CO (r = 0.333, 95% CI, 0.011 - 0.598; P = 0.031), SO2 (r = 0.391, 95% CI, 0.074 - 0.645; P = 0.015), and NO2 (r = 0.324, 95% CI, 0.002 - 0.591; P = 0.038) showed moderate positive correlations. O3 showed a significant negative correlation (r = -0.796, 95% CI, -0.912 to -0.592; P < 0.001). These analyses were based on daily pollutant averages across the 31 provinces, compared with average provincial COVID-19 case counts.
Table 4.
Statistical Correlations Between Air Pollutants and the Number of Patients with COVID-19 a
| Pollutant | Correlation Coefficient (r) | 95% Confidence Interval | P-Value |
|---|---|---|---|
| CO | 0.333 | 0.011 - 0.598 | 0.031 |
| SO2 | 0.391 | 0.074 - 0.645 | 0.015 |
| NO2 | 0.324 | 0.002 - 0.591 | 0.038 |
| O3 | -0.796 | -0.912 - -0.592 | < 0.001 |
| PM10 | 0.796 | 0.592 - 0.912 | < 0.001 |
| PM2.5 | 0.824 | 0.636 - 0.928 | < 0.001 |
a Pearson correlation was used after normality was confirmed by the Kolmogorov-Smirnov test (P > 0.05 for all variables). N = 31 provinces. P < 0.05 was considered statistically significant.
4.8. Spatial Distribution of COVID-19 Cases
COVID-19 case counts during the study period were summarized for all 31 provinces. Daily incidence was presented graphically in Figure 5A, and the geographic distribution of cases during the study period was mapped in Figure 5B (Tables 5 and 6).
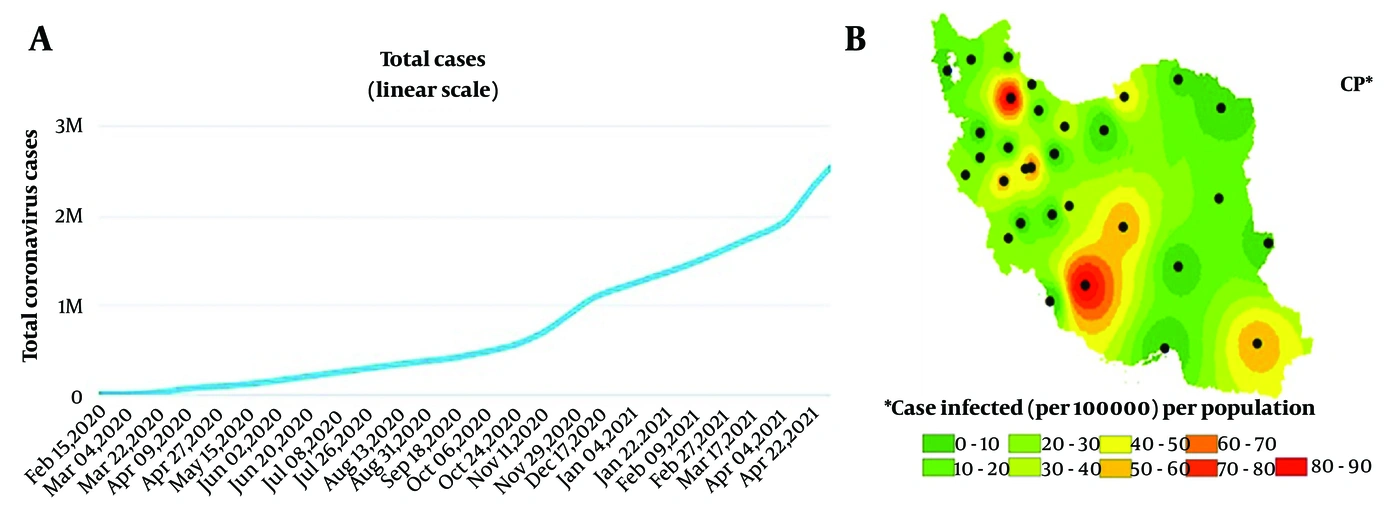
Figure 5.
(A) Statistical chart and (B) distribution map of people with COVID-19 during the study period
Table 5.
Descriptive Statistics on Province-Level COVID-19 Outbreak and Long-Term Air Pollution Levels in 31 Provinces
| Province | Population | Total Cases | Cases Per 100,000 Population | Mean CO (ppm) | Mean SO2 (ppb) | Mean NO2 (ppb) | Mean O3 (ppb) | Mean PM10 (μg/m3) | Mean PM2.5 (μg/m3) |
|---|---|---|---|---|---|---|---|---|---|
| East Azerbaijan | 3909652 | 629 | 16.09 | 30 ± 25 | 30 ± 24 | 41 ± 34 | 21 ± 10 | 47 ± 44 | 76 ± 41 |
| Western Azerbaijan | 3265219 | 326 | 9.98 | 55 ± 10 | 32 ± 23 | 64 ± 29 | 62 ± 25 | ||
| Ardabil | 1270420 | 229 | 18.03 | 6 ± 6 | 32 ± 7 | 25 | 24 ± 19 | 25 | |
| Esfahan | 5120850 | 1646 | 32.14 | 51 ± 3 | 131 | 131 | 131 | 102 ± 30 | |
| Alborz | 2712400 | 967 | 35.65 | 69 | 69 | 18 ± 7 | 60 ± 9 | 74 ± 30 | |
| Ilam | 580158 | - | 0.00 | 37 | 37 | 39 ± 46 | 52 ± 26 | ||
| Bushehr | 1163400 | 54 | 4.64 | 120 | 120 | 68 ± 50 | 103 ± 40 | ||
| Tehran | 13267637 | 4397 | 33.14 | 30 ± 10 | 34 ± 16 | 61 ± 26 | 32 ± 5 | 53 ± 33 | 81 ± 40 |
| Chaharmahal va Bakhtiari | 947763 | 61 | 6.44 | 31 ± 17 | 23 | 51 ± 26 | 27 | 37 ± 34 | 23 |
| Southern Khorasan | 768898 | 145 | 18.86 | 6 ± 3 | 50 | 50 | 28 ± 6 | 33 ± 76 | 42 ± 19 |
| Khorasan Razavi | 6434501 | 711 | 11.05 | 24 ± 12 | 25 ± 22 | 61 ± 33 | 43 ± 33 | 81 ± 45 | |
| North Khorasan | 863092 | 121 | 14.02 | 23 | 13 | 13 | 56 ± 88 | 39 ± 30 | |
| Khuzestan | 4710509 | - | 0.00 | 31 ± 17 | 29 ± 6 | 72 ± 19 | 38 ± 10 | 71 ± 70 | 110 ± 43 |
| Zanjan | 1057461 | 287 | 27.14 | 12 ± 8 | 47 | 44 ± 15 | 12 ± 9 | 43 ± 19 | 50 ± 23 |
| Semnan | 702360 | 593 | 84.43 | 36 ± 17 | 22 ± 5 | 46 ± 20 | 61 ± 33 | 59 | 50 ± 15 |
| Sistan and Baluchestan | 2775014 | 106 | 3.82 | 73 | 95 | 64 ± 67 | 135 ± 100 | ||
| Fars | 4851274 | 407 | 8.39 | 32 ± 17 | 22 ± 5 | 52 ± 32 | 91 ± 60 | 68 ± 20 | 76 ± 30 |
| Qazvin | 1273761 | 573 | 44.98 | 25 ± 8 | 69 ± 15 | 45 ± 23 | 17 | 66 ± 13 | 69 |
| Qom | 1292283 | 1105 | 85.51 | 16 ± 8 | 15 ± 9 | 20 ± 28 | 11 ± 2 | 55 ± 75 | 120 ± 50 |
| Kurdistan | 1603011 | 200 | 12.48 | 23 ± 3 | 21 ± 20 | 17 ± 6 | 26 ± 16 | 34 ± 15 | |
| Kerman | 3164718 | 141 | 4.46 | 129 | 129 | 94 ± 34 | 85 ± 50 | ||
| Kermanshah | 1952434 | 158 | 8.09 | 18 ± 10 | 36 ± 14 | 31 ± 18 | 44 ± 26 | 44 ± 14 | 50 |
| Kohkiluyeh and Boyer-Ahmad | 713052 | 60 | 8.41 | ||||||
| Golestan | 1868619 | 360 | 19.27 | 18 ± 12 | 17 | 14 | |||
| Gilan | 2530696 | 997 | 39.40 | 22 ± 10 | 30 ± 23 | 19 ± 10 | 70 ± 62 | 73 | |
| Lorestan | 1760649 | 400 | 22.72 | 17 ± 11 | 50 ± 30 | 67 ± 36 | 21 ± 3 | 28 ± 34 | 47 ± 35 |
| Mazandaran | 3283582 | 1503 | 45.77 | ||||||
| Markazi | 1429475 | 829 | 57.99 | 34 ± 12 | 62 ± 30 | 31 ± 25 | 32 ± 10 | 76 ± 47 | 67 ± 32 |
| Hormozgan | 1776415 | 129 | 7.26 | 31 ± 16 | 45 ± 9 | 25 ± 11 | 52 ± 19 | 15 ± 20 | 100 ± 63 |
| Hamedan | 1758268 | 175 | 9.95 | 20 ± 10 | 42 ± 8 | 49 ± 31 | 42 ± 30 | 65 ± 32 | 65 ± 28 |
| Yazd | 1138533 | 540 | 47.43 | 27 ± 18 | 71 | 71 | 38 ± 20 | 64 ± 30 | 71 |
Table 6.
Multivariate Linear Regression Analysis of Associations Between Air Pollutants and COVID-19 Cases, Adjusted for Population Density a
| Pollutant | Unstandardized Coefficient (B) | 95% Confidence Interval | Standardized Coefficient (Beta) | P-Value |
|---|---|---|---|---|
| CO | 12.45 | -3.21 - 28.11 | 0.21 | 0.118 |
| SO2 | 8.76 | -1.54 - 19.06 | 0.19 | 0.094 |
| NO2 | 5.23 | -4.87 - 15.33 | 0.14 | 0.302 |
| O3 | -18.92 | -35.64 - -2.20 | -0.41 | 0.028 |
| PM10 | 0.52 | 0.31 - 0.73 | 0.56 | 0.001 |
| PM2.5 | 0.48 | 0.27 - 0.69 | 0.52 | 0.002 |
a Dependent variable: number of confirmed COVID-19 cases per province. Model adjusted for population density (people per km2). R2 = 0.68 (adjusted R2 = 0.62). P < 0.05 was considered statistically significant.
5. Discussion
5.1. Interpretation of Findings and Comparison with Previous Studies
In this ecological study, we investigated the associations between ambient air pollutants and COVID-19 prevalence across 31 Iranian provinces. Significant positive ecological correlations were observed between particulate matter, particularly PM2.5 and PM10, and provincial COVID-19 case counts.
5.1.1. Carbon Monoxide
Previous studies have reported mixed findings. Nhung et al. reported a negative association between CO and bronchitis and asthma (22). In contrast, Li et al. found that increased levels of several pollutants, including CO, were associated with increased hospital visits for upper respiratory tract infections among children aged 0 - 14 years (23). A study conducted in Jinan, China, from 2016 to 2017 also reported associations between exposure to PM2.5, PM10, and CO and influenza-like illness among children aged 0 - 4 and 4 - 14 years (24).
5.1.2. Sulfur Dioxide
A longitudinal study of 343 children exposed to sulfur dioxide and particulate sulfate was conducted in 3 Arizona towns, 2 of which had smelters (25). The study period was 1979 - 1982. Annual mean SO2 concentrations at 2 monitoring sites were 0.005 ppm and 0.04 ppm. In the area with the highest pollution, children were intermittently exposed to high SO2 levels, with peak 3-hour means exceeding 1 ppm, as well as moderate levels of particulate sulfate. Cough prevalence was significantly correlated with pollution levels, although lung function did not change significantly over 3 years (26).
Because SO2 is soluble in water and respiratory mucus, the upper respiratory tract is particularly affected. In the presence of suspended particles, surface adsorption or particle interactions may facilitate deeper penetration into the lungs, potentially exacerbating pulmonary lesions and other complications (27). Sulfur dioxide exposure can cause respiratory symptoms and increase airway resistance. Animal studies have shown that prolonged SO2 exposure can cause goblet-cell changes, epithelial hyperplasia, and hypertrophy of submucosal glands (28). Such airway epithelial injury resembles chronic bronchitis in humans. Individual sensitivity to SO2 varies, and people with asthma may be particularly vulnerable (29).
Since 2013, air quality in many Chinese cities has improved, with substantial decreases in PM2.5, PM10, and SO2 concentrations (30). These policies have also yielded health benefits. Liang et al. reported that, compared with 2013 levels, SO2 and PM2.5 concentrations in 2017 were 68% and 33% lower, respectively, alongside a decreasing trend in acute exacerbations of COPD associated with PM2.5 exposure (31). Nevertheless, air quality has not consistently met WHO standards; particulate matter concentrations remain high in some areas, O3 concentrations have increased, and NO2 concentrations have remained relatively stable.
5.1.3. Nitrogen Oxides
Nitrogen oxides can irritate the respiratory tract and eyes, increase airway resistance, reduce pulmonary gas-diffusion capacity, and contribute to pneumonia, acute bronchitis, cough, dyspnea, lethargy, and fatigue. Some of these manifestations overlap with respiratory symptoms of COVID-19, while COVID-19 itself can cause substantial pulmonary injury (32, 33).
Khajeamiri et al. reported that NO2 was a major air pollutant associated with daily outpatient visits for upper respiratory tract infections (28). Frampton et al. examined the ability of human alveolar macrophages to inactivate influenza virus after exposure to NO2 and air. Alveolar macrophages obtained by bronchoalveolar lavage after continuous NO2 exposure showed reduced influenza-virus inactivation compared with cells obtained after air exposure (34).
Kowalska et al. observed the strongest association between NO2 concentration and outpatient visits for bronchitis and reported that increases in mean daily NO2 concentration increased the risk of bronchitis (35, 28). Schikowski et al. analyzed associations of annual mean particulate matter and NOx concentrations with COPD prevalence during a 3-year follow-up period from 2008 to 2011; neither NO2 nor particulate matter was significantly associated with COPD prevalence in the cohort analysis or meta-analysis (36).
5.1.4. Hydrocarbons and Volatile Organic Compounds
Hydrocarbons and VOCs are important because some compounds are carcinogenic and contribute to the formation of photochemical oxidants (37). Aromatic hydrocarbons have been associated with lung cancer, while photochemical smog can irritate the eyes and mucous membranes and affect hematopoietic tissues (38).
5.1.5. Ozone and Other Oxidants
Nitrogen dioxide can photodissociate to form atomic oxygen, which then combines with molecular oxygen to generate ozone, a strong oxidant (39).
NO2 → NO + O
O + O2 → O3
Tropospheric ozone exposure has been associated with pulmonary complications and impaired lung function (40). Epidemiologic studies have associated concentrations of 200 μg/m3 or less with decreased lung function in children, and these effects may be aggravated by heat and other pollutants. Even low ozone concentrations have been associated with pulmonary effects, whereas high-ozone conditions have been associated with early fatigue and reduced exercise performance.
Zoran et al. evaluated ground-level O3 and NO2 in relation to COVID-19 in Milan, Italy. They reported positive relationships between daily average O3 and air temperature and inverse relationships with relative humidity and precipitation. They also discussed the possibility that SARS-CoV-2 may interact with ambient air pollution (33).
Wong et al. examined the effects of SO2, NO2, O3, and PM10 on outcomes among patients with influenza in 4 Asian cities. Ozone appeared to have more pronounced associations with mortality and hospitalization than the other pollutants, potentially because of overlap between the influenza season and periods of elevated pollutant concentrations. Patients with preexisting influenza exposed to O3 may develop respiratory complications, including acute respiratory disease and COPD (41).
Zhu et al. reported that a 10 μg/m3 increase in ozone concentration was associated with an increase in daily confirmed COVID-19 cases (42). In 2015, 8% of total deaths worldwide were attributed to O3 exposure, including 254,000 deaths due to COPD (43). A large prospective cohort study in the United States reported that long-term O3 exposure was associated with increased COPD mortality, with a risk ratio of 1.09 (95% CI, 1.03 - 1.15) for each 10-ppb increase in annual mean O3 concentration (44).
5.2. Physiological Mechanisms
Previous studies have suggested that, during exercise, increased tidal volume and oral breathing may bypass nasal filtration and allow pollutants to penetrate more deeply into the respiratory tract (45-48). Greater airflow velocity may carry pollutants deeper into the airways, where they may diffuse into the bloodstream or promote cardiovascular inflammation (49, 50). Thus, exercise under conditions of moderate air pollution may counteract some benefits of physical activity. This mechanism may partly explain increased susceptibility in physically active individuals, although the ecological design of the present study did not permit direct assessment of this pathway.
5.3. Particulate Matter
Ciencewicki and Jaspers reviewed epidemiologic evidence on air pollution and respiratory viral infections and described associations between high particulate matter concentrations in urban areas and mortality from cardiovascular and respiratory diseases. Elevated exposure to ambient particulate matter may alter host immunity to respiratory viral infections (53). A study conducted in Shanghai, China, found that daily COPD mortality was significantly associated with particle number concentrations for particles smaller than 0.5 μm and that the magnitude of the association increased as particle size decreased (54).
A study from northern Italy suggested that high levels of air pollution may have contributed to the spread of COVID-19. Atmospheric particulate matter may remain suspended for prolonged periods and can travel long distances. The cited research discussed potential relationships among atmospheric particulate matter, relative humidity, and SARS-CoV-2 transmission, noting that northern Italian areas heavily affected by COVID-19 also had PM10 and PM2.5 concentrations above legislative standards (55).
5.4. Study Limitations
This study has several important limitations. First, this was an ecological study based on aggregate-level data; therefore, individual-level causation cannot be inferred, and the ecological fallacy must be avoided. Second, the COVID-19 data were obtained during the early phase of the pandemic, from February 20 to April 20, 2020. These findings may not be generalizable to the entire pandemic because testing capacity, reporting practices, public health interventions, and viral variants changed over time. Third, several important confounders could not be adjusted for because of data limitations, including age distribution, underlying comorbidities, socioeconomic status, mobility patterns, lockdown compliance, COVID-19 testing capacity, reporting rates, and vaccination coverage, although vaccines were not available during the study period. Fourth, correlation does not imply causation. The observed ecological correlations do not establish that air pollution directly increases viral transmission or disease severity without experimental or individual-level longitudinal data. Finally, VOCs and hydrocarbons were not measured in the meteorological reports, and their potential associations with COVID-19 could not be assessed.
5.5. Recommendations and Future Directions
Improving air-quality indicators, reducing personal exposure to pollutants, and improving fuel and engine technologies may help reduce air pollution and its cardiovascular and mortality consequences. Future research should use individual-level longitudinal designs, control for a comprehensive set of confounders, and investigate underlying biological mechanisms. Such research could strengthen individualized patient care and provide evidence to support effective public-health measures to reduce air pollution.
5.6. Conclusions
This ecological study investigated the associations between ambient air pollutants and COVID-19 prevalence across 31 Iranian provinces during the early phase of the pandemic, from February 20 to April 20, 2020. Significant positive ecological correlations were observed between particulate matter, particularly PM2.5 and PM10, and provincial COVID-19 case counts.
Carbon monoxide pollution was highest on March 11, with the highest reported levels in Tehran, Ahvaz, and Bandar Abbas. Reported SO2 and NOx concentrations did not exceed the stated standard limits. The highest PM10 concentrations were observed on February 27 and March 2 in Iranshahr, Zabol, and Khorramabad, whereas the highest PM2.5 concentrations were observed on February 25 and 28 in Iranshahr and Bandar Abbas. According to the PSI, 62% of the study days were within the allowable range and 38% were in the clean range.
PM2.5 showed the strongest correlation with COVID-19 cases (r = 0.824; P < 0.001), followed by PM10 (r = 0.796; P < 0.001). After adjustment for population density, multivariate linear regression showed that PM10 (B = 0.52, 95% CI, 0.31 - 0.73; P = 0.001) and PM2.5 (B = 0.48, 95% CI, 0.27 - 0.69; P = 0.002) remained significant independent predictors of provincial COVID-19 case counts.
Temporary industrial closures and reduced vehicle traffic during the early pandemic period were associated with decreases in several air pollutants, including CO, SO2, NO2, and O3. These changes did not affect natural particulate pollutants such as PM10 and PM2.5 originating from dust storms in southeastern Iran. The findings suggest an interaction among human activity, air quality, and infectious-disease dynamics. Air-pollution modeling may help identify regions at higher risk during future respiratory-disease outbreaks and may support monitoring, containment, early-warning systems, and resource allocation.
Because of the ecological study design, individual-level causation cannot be inferred. Air-quality monitoring and pollution-control measures may nevertheless contribute to pandemic preparedness, while stronger study designs, including individual-level longitudinal studies with comprehensive control of confounding, are needed to clarify the relationships between air pollution and respiratory viral infections. Continued efforts to improve air quality may yield both environmental and public-health benefits. Measures may include modification of industrial activities, promotion of public transportation, expansion of green spaces, and transition to cleaner energy sources.