


1. Background
Type 2 Diabetes Mellitus (T2DM) is one of the most prevalent metabolic illnesses that may be attributed to both genetic and environmental factors, including lifestyle, exercise, nutrition, medications, and age (1). In 2021, the global prevalence of diabetes was reported to be 10.5%, which is predicted to reach 12.2% by 2045 (2). In Iran, its prevalence was reported to be 10% in 2021, and it is predicted that by 2030, this figure will reach 13.9% (3). The macrovascular and microvascular problems produced by T2DM are the most significant complications that may arise from the disease (3), each of which imposes a significant therapeutic and economic burden (4). There are pharmaceutical and non-pharmacological therapies for treating and managing these conditions (5). Some of these treatments include the implementation of oral hypoglycemic medications (insulinotropic and non-insulinotropic), injectable insulin, and dietary modifications (6, 7). These treatments are used for the treatment and management of this disease (8, 9). The T2DM brings a lot of psychological stress to the patients, and the side effects of each drug also cause damage to other organs (10, 11).
Recently, complementary medicine, often referred to as non-drug therapies, has proved its efficacy in the control of T2DM and in the reduction of problems associated with the disease (12). One of the most prominent non-medicinal methods is using okra extract (13). This plant belongs to the Malvaceae family and grows in tropical and subtropical areas (14). The compounds in this plant include fiber to improve digestive movements, minerals, antioxidant compounds (flavonoids), and polysaccharides (15, 16). An in vivo study conducted on rats with high weight and cholesterol levels found that the consumption of okra (Abelmoschus esculentus) caused weight loss and improved cholesterol levels in rats (17). In addition, another in vivo study on rats showed that the use of okra caused a significant decrease in blood sugar (BS) levels (18). A human study has also found that the consumption of okra improves fasting blood sugar (FBS) and hemoglobin A1c in patients with T2DM (19). Due to the increasing importance of T2DM control and its complications, several studies have suggested supplementary therapies (herbal medicine) as a means of enhancing the quality of life and self-care for people who have T2DM (20, 21). There has not been a significant amount of research conducted on human communities yet on the effects of okra extract on FBS levels, 2 hours postprandial (2h PP), and hemoglobin A1c.
2. Objectives
Thus, this study aimed to discover the response of consuming okra fruit on the FBS, 2h PP, lipid profile, and HbA1c in T2DM patients.
3. Methods
3.1. Study Design
This was a double-blinded randomized clinical trial conducted in 2023, with permission obtained from the Ethics Committee of Ilam University of Medical Sciences (IR.MEDILAM.REC.1397.111) and the Iranian Clinical Trials Center code (IRCT20211110053030N5).
3.2. Setting and Participants
The study population was selected from patients with T2DM who were referred to the Internal Clinic of Mostafa Khomeini and Razi Hospitals in Ilam province, using a convenience sampling method. Eligibility criteria included being over 18 years of age, having the ability to read and write, normal liver, renal, and thyroid tests, not using okra in the past four weeks, using Metformin 1000 mg, and having a history of T2DM for at least two years. Exclusion criteria included unwillingness to continue the study, using insulin, using contraceptive drugs, having a positive Beta HCG, using any Beta-Blockers, using statin drug groups for decreasing lipid levels, having HbA1c less than 6.5, having normal levels in lipid profile tests [triglyceride (TGC), total cholesterol (T. Chol), low density lipoprotein (LDL), and high density lipoprotein (HDL)], and death or hospitalization during the intervention.
3.3. Sample Size
According to the research by Saatchi et al., the mean and standard deviation of FBS before the intervention were 178.45 ± 22.93, and after the intervention were 161.92 ± 18.51. Based on the comparison of two means formula, considering a first type error of 0.05 and a power of 0.80, it was reported that 25 participants were needed for each group (19). By accounting for an attrition rate of 20%, the eventual number of participants in each group was determined to be 30.
3.4. Randomization and Blinding
To minimize bias, the study employed blinding at various stages. Participants were randomly assigned to groups using a dice-tossing procedure (odd numbers for control, even numbers for intervention). They were not informed of their group assignment or the nature of the intervention, maintaining blinding at the participant level. An endocrinologist, responsible for administering the intervention (okra capsules), was unaware of the group assignments and dispensed the medication without knowledge of the participants' groupings. Additionally, a single nurse, who was not informed of the study design or group assignments, collected blood samples at the beginning and end of the study. These samples were sent to the lab without any group labels. Lastly, the statistical analyst who evaluated the data received anonymized datasets, ensuring they were unaware of group assignments or study outcomes. Participants were prohibited from using shared communication tools to prevent information sharing. The research team managed the protocol without knowledge of group assignments, maintaining the integrity of the blinding method throughout the investigation.
3.5. Outcomes
The primary measures tested in this study were FBS, 2h PP, lipid profile, and HbA1c levels.
3.6. Intervention
The intervention commenced after obtaining the ethics code, randomization, and criteria assessments. In the intervention group, participants consumed four okra fruits in manufactured paper glasses with a 50 cc capacity, placing the four okras in 30 cc of water (kept in a refrigerator at a temperature of 8 to 16°C) for 24 hours. The following day, 2 hours after lunch, they ingested the liquid extract. The study duration was set for 28 days. To ensure the effective amount of okra, the endocrinologist selected eight okras, each weighing approximately 20 grams, and distributed them among the samples daily via his secretary, using online taxis. After fourteen days, the research team obtained renal, liver, and thyroid tests from the samples in the intervention group to assess potential fruit toxicity and exclude any abnormal samples from further study. Furthermore, all samples in the intervention group received a diabetic nutrition program with at least 20 grams of oral fiber during the study, according to valid research (22-25). The control group's samples only received the diabetic nutrition program and other routine biweekly nursing assessments at the same urban health center. At the start and end of the research (day 28), a 5 mL blood sample was obtained from all participants to analyze the research outcomes after 8 to 10 hours of fasting. The 5 mL whole blood sample was transferred to vacuumed blood collection tubes for laboratory assays, and the laboratory test results were subsequently imported into SPSS V.16 for outcomes analysis by a blinded statistical analyst (Figure 1).
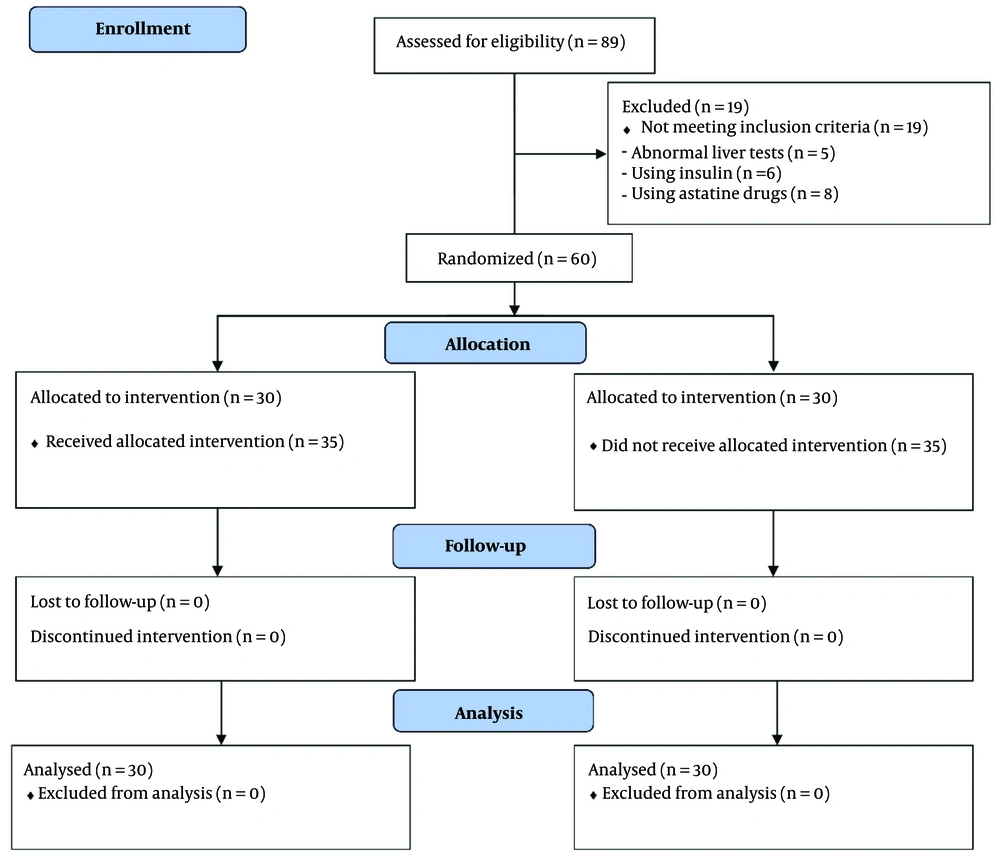
Figure 1.
The sequence of selecting and study protocol related on control and intervention groups
3.7. Ethical Consideration
The research adhered to ethical guidelines, which included obtaining ethical approval from the Ilam University of Medical Sciences, registering the study in the Iranian Registry of Clinical Trials, collecting informed consent from participants, ensuring data confidentiality, and following the principles outlined in the Declaration of Helsinki.
3.8. Data Analysis
The demographic data were analyzed using descriptive statistics, with variables presented as mean, standard deviation, frequency, and percentage. The statistical methods used in the analysis included the Kolmogorov-Smirnov (K-S) test to check for normal distribution, the independent t-test and chi-square test to compare the two groups regarding demographic factors, the paired t-test to compare scores before and after, and difference-in-difference regression (DID) for assessing time effect, group effect, and adjusting for further relations. The analyses were conducted using SPSS V.16, with a significance threshold set at less than 0.05.
4. Results
The normality test (K-S) confirmed that all variables had a normal distribution. The mean age of the samples was 51.53 ± 7.72 years. Most of the samples were male, married, held a bachelor's degree, were employed, had been diagnosed with diabetes for 2 to 4 years, had a normal Body Mass Index, had a history of smoking, and had 1 to 3 children. The chi-square test showed no significant differences between the groups in terms of gender (P = 0.963), marital status (P = 0.188), education (P = 0.709), occupation (P = 0.223), diabetes history (P = 0.838), Body Mass Index (P = 0.631), smoking (P = 0.414), and number of children (P = 0.597) (Table 1).
Table 1.Displaying the Sample Distribution by Demographic Variables in Both Groups a
| Variables | Intervention | Control | P-Value (Chi-Square) |
|---|---|---|---|
| Gender | 0.963 | ||
| Male | 22 (73.3) | 16 (53.3) | |
| Female | 8 (26.7) | 14 (46.7) | |
| Marital condition | 0.188 | ||
| Single | 3 (10) | 2 (6.7) | |
| Married | 17(56.7) | 21(70) | |
| Widower | 3 (13.3) | 5 (16.7) | |
| Divorced | 6 (20) | 2 (6.7) | |
| Education | 0.709 | ||
| Below diploma | 7 (23.3) | 8 (26.7) | |
| Diploma | 12 (40) | 12 (40) | |
| Bachelor | 11(36.7) | 9 (30) | |
| Above bachelor | 0 () | 1 (3.3) | |
| Job | 0.223 | ||
| Free | 8 (26.7) | 8 (26.7) | |
| Employed | 16 (53.3) | 9 (30) | |
| Retirement | 6 (20) | 13 (43.3) | |
| Date of diabetes diagnosis (y) | 0.838 | ||
| From 2 to 4 | 20 (66.7) | 24 (80) | |
| From 5 to 7 | 7 (23.3) | 5 (16.7) | |
| More than 8 | 3 (10) | 1 (3.3) | |
| Body Mass Index | 0.631 | ||
| Low weight | 2 (6.7) | 3 (10) | |
| Normal weight | 17 (56.7) | 20 (66.7) | |
| Over weight | 11 (36.7) | 7 (23.3) | |
| Smoking | 0.414 | ||
| Yes | 18 (60) | 21 (70) | |
| No | 12 (40) | 9 (30) | |
| Number of children | 0.597 | ||
| 0 | 6 (20) | 4 (13.3) | |
| 1 - 3 | 19 (63.3) | 23 (76.7) | |
| More than 3 | 5 (16.7) | 3 (10) |
a Values are expressed as No. (%).
Before the intervention, there were no significant differences in the mean scores of FBS, 2h PP BS, lipid profile, and HbA1c between the control and intervention groups (P = 0.268, P = 0.154, P = 0.307, P = 0.099, P = 0.115, P = 0.102, P = 0.061). However, after the intervention, these differences became significant (P = 0.024, P = 0.009, P = 0.047, P = 0.002, P = 0.020, P = 0.006, P < 0.001). The independent t-test revealed statistically significant differences in the mean difference of FBS, 2h PP, lipid profile, and HbA1c between the two groups (P < 0.001, P < 0.001, P = 0.014, P = 0.023, P < 0.001, P = 0.044, P < 0.001) (Table 2). The paired t-test assessments indicated there were no statistically significant differences in the mean scores of FBS, 2h PP, lipid profile, and HbA1c before and after the intervention in the control group (P = 0.091, P = 0.210, P = 0.071, P = 0.058, P = 0.127, P = 0.245, P = 0.052). However, significant differences were observed in the intervention group (P = 0.004, P = 0.019, P < 0.001, P < 0.001, P = 0.031, P < 0.001, P < 0.001) (Table 2).
Table 2.Comparison of the Mean Scores of Fasting Blood Sugar, 2 Hours Postprandial BS, Lipid Profile, and HbA1c in Samples Before and After the Intervention in Both Groups
| Variables | Control | Intervention | P-Value a | ||
|---|---|---|---|---|---|
| Mean ± SD | 95% CI (Lower to Upper) | Mean ± SD | 95% CI (Lower to Upper) | ||
| FBS | |||||
| Before | 181.97 ± 17.77 | 13.28 (175.33 to 188.61) | 181.13 ± 16.11 | 12.04 (175.11 to 187.15) | 0.268 |
| After | 204.88 ± 24.51 | 18.30 (195.73 to 214.03) | 162.90 ± 18.21 | 13.60 (156.1 to 169.7) | 0.024 |
| Mean Difference | 22.91 | -18.23 | < 0.001 | ||
| P-Value b | 0.091 | 0.004 | - | ||
| Lipid Profile | |||||
| 2h PP | |||||
| Before | 302.87 ± 51.36 | 38.36 (283.69 to 322.05) | 277.97 ± 38.39 | 28.68 (263.63 to 292.31) | 0.154 |
| After | 315.11 ± 21.91 | 16.36 (306.93 to 323.29) | 236.13 ± 40.62 | 30.34 (220.96 to 251.30) | 0.009 |
| Mean Difference | 12.24 | -41.84 | < 0.001 | ||
| P-Value b | 0.210 | 0.019 | - | ||
| TGC | |||||
| Before | 133.40 ± 10.47 | (129.49 to 137.31) | 135.62 ± 15.94 | 11.90 (129.67 to 141.57) | 0.307 |
| After | 143.53 ± 11.75 | 8.78 (139.14 to 147.92) | 107.37 ± 15.03 | 11.22 (101.76 to 112.98) | 0.047 |
| Mean Difference | 10.13 | -28.25 | 0.014 | ||
| P-Value b | 0.071 | < 0.001 | - | ||
| T. Chol | |||||
| Before | 159.28 ± 10.39 | 7.76 (155.4 to 163.16) | 164.07 ± 26.19 | 19.56 (154.29 to 173.85) | 0.099 |
| After | 168.87 ± 11.23 | 8.38 (164.68 to 173.06) | 140.40 ± 27.21 | 20.32 (130.24 to 150.56) | 0.002 |
| Mean Difference | 9.59 | -19.67 | 0.023 | ||
| P-Value b | 0.058 | < 0.001 | - | ||
| HDL | |||||
| Before | 67.13 ± 7.56 | 5.64 (64.31 to 69.95) | 72.78 ± 9.67 | 7.22 (69.17 to 76.39) | 0.115 |
| After | 59.60 ± 7.12 | 5.32 (56.94 to 62.26) | 80.25 ± 10.99 | 8.20 (76.15 to 84.35) | 0.020 |
| Mean Difference | -7.53 | 7.47 | < 0.001 | ||
| P-Value b | 0.127 | 0.031 | - | ||
| LDL | |||||
| Before | 57.83 ± 20.96 | 15.66 (50.0 to 65.66) | 62.69 ± 17.55 | 13.10 (56.14 to 69.24) | 0.102 |
| After | 68.27 ± 17.84 | 13.32 (61.61 to 74.93) | 52.97 ± 15.39 | 11.50 (47.22 to 58.72) | 0.006 |
| Mean Difference | 10.44 | -9.72 | 0.044 | ||
| P-Value b | 0.245 | < 0.001 | - | ||
| HbA1c | |||||
| Before | 7.27 ± 0.56 | 0.42 (7.06 to 7.48) | 7.35 ± 0.31 | 0.24 (7.23 to 7.47) | 0.061 |
| After | 7.33 ± 0.27 | 0.20 (7.23 to 7.43) | 7.12 ± 0.28 | 0.20 (7.02 to 7.22) | < 0.001 |
| Mean Difference | 0.06 | -0.23 | < 0.001 | ||
| P-Value b | 0.052 | < 0.001 | - | ||
Abbreviations: FBS, fasting blood sugar; 2h PP, 2 hours post-prandial; TGC, triglyceride; T. Chol, total cholesterol; HDL, high density lipoprotein; LDL, low density lipoprotein.
a Independent t-test
b Paired t
After the intervention, significant differences were observed in the intervention group, with mean changes of -18.23 for FBS (95% CI: 175.11 to 187.15, P = 0.024), -41.84 for 2h PP (95% CI: 220.96 to 251.30, P = 0.009), -28.25 for TGC (95% CI: 101.76 to 112.98, P = 0.047), -19.67 for T. Chol (95% CI: 130.24 to 150.56, P = 0.002), 7.47 for HDL (95% CI: 76.15 to 84.35, P = 0.020), -9.72 for LDL (95% CI: 47.22 to 58.72, P = 0.006), and -0.23 for HbA1c (95% CI: 7.02 to 7.22, P < 0.001), indicating a significant impact of the intervention on metabolic and lipid profile indices (Table 2).
To assess the group effect and time effect between the two groups, a DID was conducted. The results showed that in the intervention group, FBS, 2h PP, lipid profile, and HbA1c were significantly different (P < 0.05). In further analysis, consuming okra significantly changed the mentioned variables in the intervention group (P < 0.05) (Table 3).
Table 3.Comparison of the Main Variables by Considering Time and Group Effects in the Intervention and Control Groups
| Variables | Coefficient | t | P |
|---|---|---|---|
| FBS | -14.133 | -5.800 | < 0.001 |
| 2h PP | -74.766 | -4.440 | < 0.001 |
| TGC | -28.566 | -5.800 | < 0.001 |
| T. Chol | -41.000 | -4.440 | < 0.001 |
| HDL | -19.724 | -3.570 | < 0.001 |
| LDL | -20.131 | -2.840 | 0.004 |
| Hemoglobin A1c | -0.434 | -3.130 | 0.002 |
Abbreviations: FBS, fasting blood sugar; 2h PP, 2 hours post-prandial; TGC, triglyceride; T. Chol, total cholesterol; HDL, high density lipoprotein; LDL, low density lipoprotein.
5. Discussion
This study aimed to discover the response of okra fruit on FBS, 2h PP, lipid profile, and HbA1c in T2DM patients. The results of the current research revealed statistically significant differences between the control and intervention groups in the mean scores of FBS, 2h PP, lipid profile, and HbA1c after the intervention. In simple terms, okra fruit consumption improved FBS, 2h PP, lipid profile, and HbA1c in T2DM patients.
The present study aligns with the results of Nikpayam et al.'s study, which aimed to investigate the effect of okra extract on appetite, energy intake, and metabolic indices in patients with type 2 diabetes. Conducted as a three-blind randomized clinical trial on 64 patients, their study found that okra extract in powdered and capsule form, used daily for 10 weeks, improved patients' appetite, energy balance, kidney function, and fat profile. The common feature of both studies was using okra as an effective substance for improving metabolic indices (26).
Additionally, Haryati et al. conducted a quasi-experimental study on 30 young people with T2DM to investigate the effect of okra extract on FBS. In their study, participants were given 250 cc of okra extract solution daily for two weeks, which decreased FBS. The common feature of both studies was that okra reduced FBS in diabetics (27).
The results of the present study are consistent with the study by Saatchi et al., which was conducted as a double-blind randomized clinical trial on 120 patients with T2DM to investigate the effect of okra extract capsules on FBS and three-month blood sugar. In their study, powdered okra extract was given to participants four times a day for eight weeks, resulting in a decrease in FBS and three-month blood sugar. The common feature of both studies was using okra extract to lower FBS and three-month blood sugar in T2DM patients who took metformin 1000 mg (19).
The results of the present study are also in line with those of Bahreini et al.'s three-blind randomized clinical trial, which investigated the effect of dried okra extract on the lipid profile of 64 patients with T2DM. In their study, 125 mg of dried okra extract was used daily for 10 weeks, which improved the participants' fat profiles. The common feature of both studies is the effect of okra extract on improving lipid profiles in T2DM patients (28).
However, the results of the present study are inconsistent with those of Moradi et al.'s study, which was conducted as a double-blind randomized clinical trial on 60 patients with T2DM. This study aimed to investigate the effect of okra extract on fat and blood sugar profiles over three months. In their study, using 10 grams of okra extract in 150 grams of traditional yogurt for 8 weeks did not cause a significant change in the fat and blood sugar profiles during the three months (29). Possible reasons for this disparity include medicinal interactions of okra extract with yogurt, the type of hypoglycemic drug used, and other underlying diseases.
Additionally, the results are inconsistent with the quasi-experimental study by Mokgalaboni et al., which aimed to investigate the effect of okra extract on FBS in 24 patients with T2DM. In their study, participants were given 20 mg of okra powder daily for 4 weeks, and no significant difference was observed in FBS at the end of the intervention. Reasons for the discrepancy in this study may include the type of drugs used to control diabetes, the demographic conditions of the sample, the amount of active substance in the okra extract, and the presence of other underlying diseases in the samples (13).
Study limitations included the duration and the number of samples. The main strengths of the current study included the use of okra fruit as an accessible and cost-effective herbal medicine, no drug complications with metformin prescription, and its easy tolerability.
5.1. Conclusions
Consuming four okra fruits as an herbal supplement improves FBS, 2h PP BS, lipid profile, and HbA1c in patients with T2DM. The present study demonstrated that okra fruit significantly enhances FBS, 2h PP BS, lipid profile, and HbA1c in T2DM patients.
5.2. Suggestions
According to the findings of the current study, it is suggested that future studies involve larger sample sizes, longer study durations, and consider other drugs prescribed for blood sugar control, along with a broader range of demographic variables.

