Preparation of A.esculentus powder
A.esculentus was collected in the October 2014 from the local farm in Ahvaz, South-West of Iran. The plants were kindly identified by Plant Taxonomy laboratory, Faculty of Agriculture Science, Shahid Chamran University of Ahvaz. The fruits (seed and peel) were washed with water and shade dried at room temperature. The dried materials were grounded into fine powder using a mixer grinder and then was weighed and kept well from moisture in a plastic vials in desiccator for further use.
Measurement of flavonoids content (FC)
The FC was determined using the method suggested by Huang
et al. (
33) with minor modifications. Five mL of 2% aluminium trichloride (AlCl3) in methanol was mixed with the same volume of the
A.esculentus powder (0.4 mg/ mL). Absorption of the resulting solution was read at 367 nm using UV-visible spectrophotometer (BioTek, CA, USA) against a blank sample containing 5 mL powder solution with 5 mL methanol without AlCl3. The FC was determined using a standard curve with quercetin (0.2-1 mg/mL) as the standard. FC was expressed as mg of quercetin equivalents per 100 gr powder. All experiments were performed in triplicate.
Measurement of phenolic content (PC)
The samples were measured for PC colorimetrically using the Folin-Ciocalteu method (
34) with slight modifications. A 100 μL of
A. esculentus was mixed with 0.5 mL Folin-Ciocalteu reagent (diluted 10 times with distilled water). 7 mL of distilled water was added to the solution and it was allowed to stand at room temperature for 5 min. Then, 1.5 mL sodium bicarbonatesolution (60 mg/ mL) was added to the mixture and left at room temperature in dark place for 2 h. Absorbance was read at 725 nm against blank using UV-visible spectrophotometer (BioTek, CA, USA). A calibration curve was constructed using a standard solution of gallic acid (0.2-1 mg/mL). Results were expressed as mg gallic acid per 100 gr powder. All experiments were performed in triplicate.
Animals and diets
Healthy adult Female Wistar rats (200–220 g) were obtained from the experimental animal holding of Joundishapour University of Medical Sciences, Ahvaz, Iran. The animals were housed in standard cages and maintained under controlled room temperature (23 ± 1 °C) and humidity with 12/12 h light/dark cycle. They were provided rat chow (Pars, Tehran, Iran) and water at libitum. All animals used were cared for according to the guide for the care and use of laboratory animals by the national academy of sciences (National Institutes of Health publication No. 86-23). Initially, all rats were housed in conventional conditions and fed standard diet and water ad libitum at the animal facility (Research Resource Facility) for 1 week before experiments began.
Animals were divided into 5 equal groups and each group consisted of five rats as follow:
Group I: Rats were fed by standard diet.
Group II: HFD diabetic rats
Group III: HFD diabetic rats received A. esculentus (200mg/kg)
Group IV: HFD diabetic rats received metformin (200 mg/kg).
Group V: Rats received normal diet and A.esculentus (200mg/kg)
Groups II, III and IV were fed by high fat (HF) diet for 5 weeks, whereas Groups I and V consumed normal diet for the same period. The fat content of HFD was adjusted to 60% by addition of beef tallow into normal diets (
35), Normal diet contained pellet chow of standard composition containing all the recommended macro and (56% carbohydrate, 18.5% protein, 8% fat, 12% fiber and adequate levels of minerals and vitamins). After 5-weeks feeding of the HF diets, rats were treated with a single dose of STZ (35 mg/kg, i.p) that was prepared in citrate buffer 0.1 M, pH = 4 (Sigma, Germany). Five days after STZ treatment glucose was measured by hand-held glucometer (Medisign, China) and diabetes induction was confirmed if serum glucose of rats was above 150 mg/dL. The next day after diabetes confirmation was considered as day 0 of treatment. After confirmation of diabetes incidence, animals of groups III and V were treated orally with
A.esculentus powder at dose of 200 mg/kg body weight (about 30mg/kg total phenol plus 30 mg/kg total flavonoids) for 30 days (
32) and group IV was orally treated with metformin (200 mg/kg) for the same period. Animals in groups II, III, and IV were maintained on a high calorie diet throughout the experiment, while rats in groups I and V had access to standard diet during the experiment. The body weight was determined every week.
Serum biochemical assays
After overnight (12 h) fasting, the rats were anesthetized using ketamine and xylazine (100 mg/kg of ketamine and 10 mg/kg of xylazine) at day 30 after treatment. Heart blood samples were collected, and sera were separated and stored at -20 °C for use. Serum glucose was measured using commercial kit (Pishtazteb, Iran) as recommended by the manufacturer. Insulin concentration was measured using a species ELISA kit (KOMA BIOTECH INC, Sout Korea) in a multiplate ELISA reader (BioTek, CA, USA) based on recommended protocol by the manufacturer.
HOMA-IR estimation
The homeostasis model assessment of basal insulin resistance (HOMA-IR) was used to calculate an index from the product of the fasting concentrations of plasma glucose (mmol/L) and plasma insulin (μU/mL) divided by 22.5. Lower HOMA-IR values indicated greater insulin sensitivity, whereas higher HOMA-IR values indicated lower insulin sensitivity (insulin resistance) (
36).
| GenBank | Size (bp) | Sequences | Gene name |
|---|
| NM_017059.2 | 145 | F: TGCTACAGGGTTTCATCCAG R: TGTTGTTGTCCAGTTCATCG | Bax |
| NM_016993.1 | 135 | F:ATCGCTCTGTGGATGACTGAGTAC R:AGAGACAGCCAGGAGAAATCAAAC | Bcl2 |
| XM_006253130.3 | 181 | F: AATTCAAGGGACGGGTCATG R: CAGATCCCGTGTATTGTGTCA | Caspase3 |
| XM_017593963.1 | 119 | F: AGTTCAACGGCACAGTCAAG R: TACTCAGCACCAGCATCACC | GAPDH |
| Group | Insulin (pg/mL) | HOMA-IR (mmol/L*μIU/L) |
|---|
| Normal Diet Control | 87.08 ± 9.2 a | 10.56 ± 3.32 a |
| HFD* | 47.9 ± 3.2 b | 21.77 ± 1.45 b |
| HFD + A. esculentus | 62.06 ± 3.96 c | 17.8 ± 4.47 c |
| HFD + Metformin | 51.05 ± 6.09 b | 15.86 ± 4.82c |
| Normal Diet + A. esculentus | 65.83 ± 9.48 c | 8.62 ± 0.54 d |
HFD: High Fat Diet + STZ treatment.
| Group | MDA (μmol/L) | SOD (IU/mL) | GPX (IU/mL) | Catalase (IU/mL) |
|---|
| Normal Diet Control | 0.869 ± 0.28 a | 1.552 ± 0.06 a | 4.628 ± 0.73 a | 2.899 ± 0.18 a |
| HFD* | 1.280 ± 0.08 b | 1.62 ± 0.01 a | 5.1828 ± 1.10 a | 1.466 ± 0.47 b |
| HFD + A. esculentus | 0.837 ± 0.06 a | 1.542 ± 0.03 a | 7.848 ± 0.91 b | 4.258 ± 0.81 c |
| HFD + Metformin | 1.045 ± 0.09 a | 1.667 ± 0.06 a | 3.987 ± 1.06 a | 2.473 ± 0.47 a |
| Normal Diet + A. esculentus | 1.44 ± 0.36 c | 1.556 ± 0.03 a | 4.537 ± 1.44 a | 1.444 ± 0.29 b |
HFD: High Fat Diet + STZ treatment.
| Group | atretic preantral follicle | atretic antral follicle |
|---|
| Normal Diet Control | 0.6725 ± 0.09 a | 0.7 ± 0.3 a |
| HFD* | 2.16 ± 0.29 b | 2.96 ± 0.3 b |
| HFD + A. esculentus | 1.203 ± 0.07 c | 1.43 ± 0.5 c |
| HFD + Metformin | 1.376 ± 0.13 c | 2.28 ± 0.29 b |
| Normal Diet + A. esculentus | 1.18 ± 0.09 c | 0.825 ± 0.58 a |
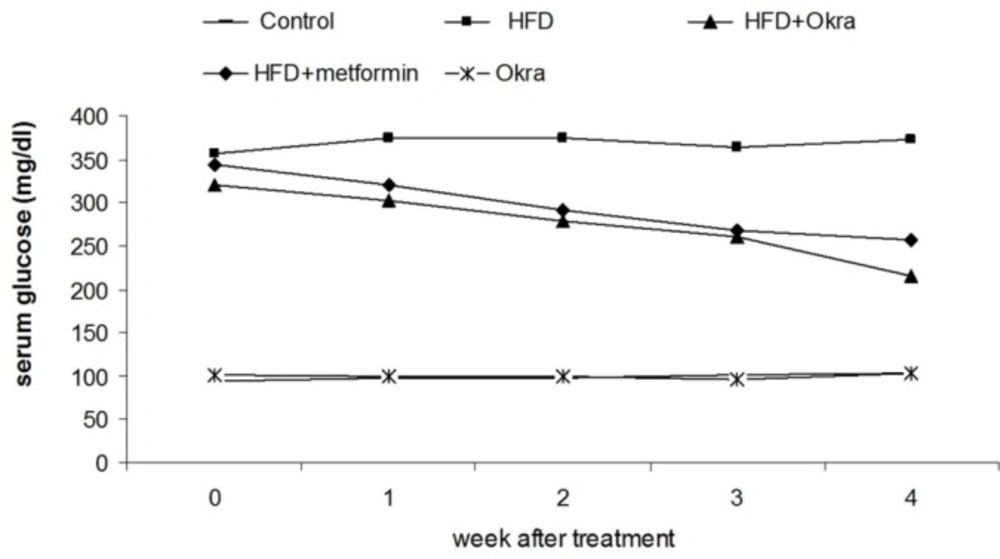
Serum glucose level in diabetic rats after treatment with A. esculentus powder and metformin. Values are mean ± SD, n = 5 animals per group
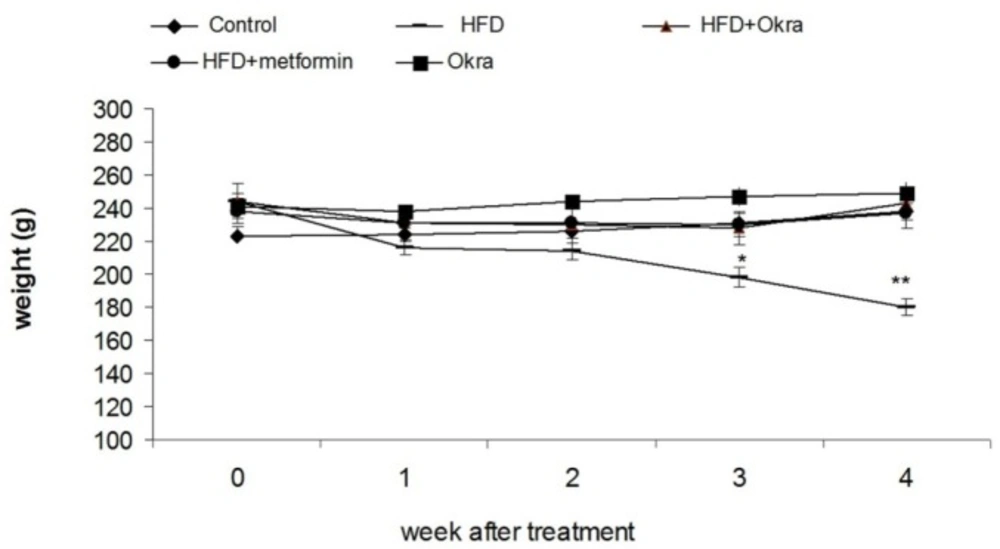
Body weight changes of diabetic rats after administration of A. esculentus powder and metformin. Values are mean ± SD, n =5 animals per group. Different numbers of * showed significant difference (P < 0.05) are
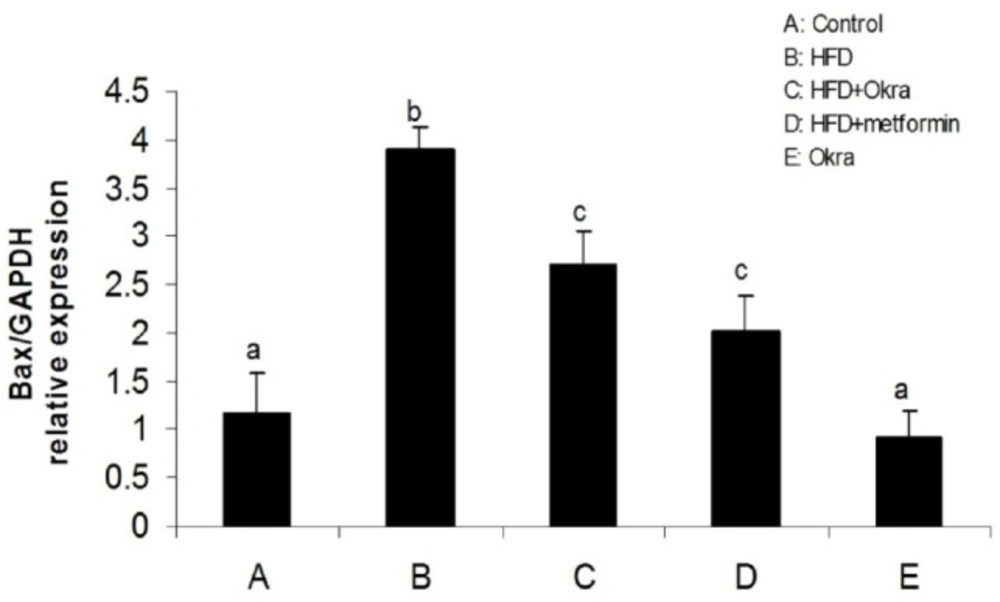
mRNA level of Bax gene in ovary of diabetic rats after treatment with A. esculentus powder and metformin. Data were presented as the mean ± SD. Different letters denote significant differences (P < 0.05).
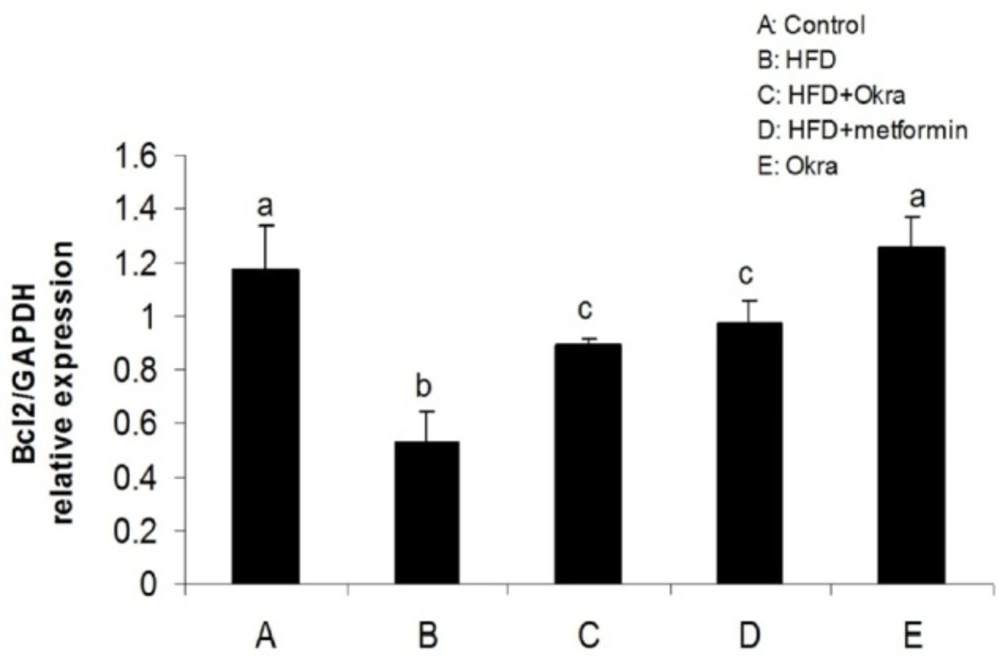
mRNA level of Bcl2 gene in ovary of diabetic rats after treatment with A. esculentus powder and metformin. Data were presented as the mean ± SD. Different letters denote significant differences (P < 0.05).
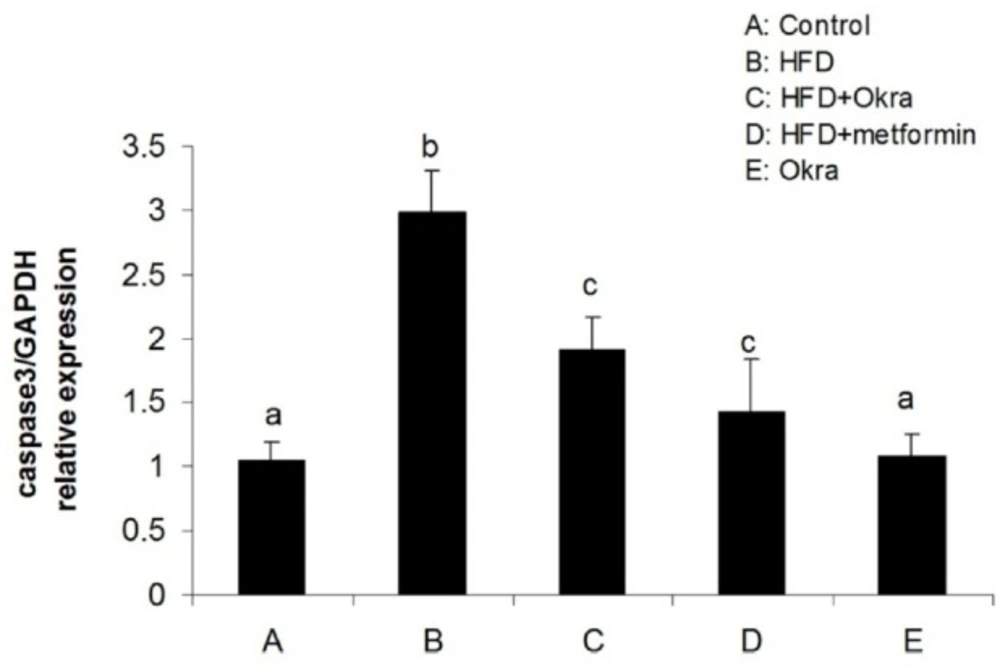
mRNA level of Caspase3 gene in ovary of diabetic rats after treatment with A. esculentus powder and metformin. Data were presented as the mean ± SD. Different letters denote significant differences (P < 0.05)
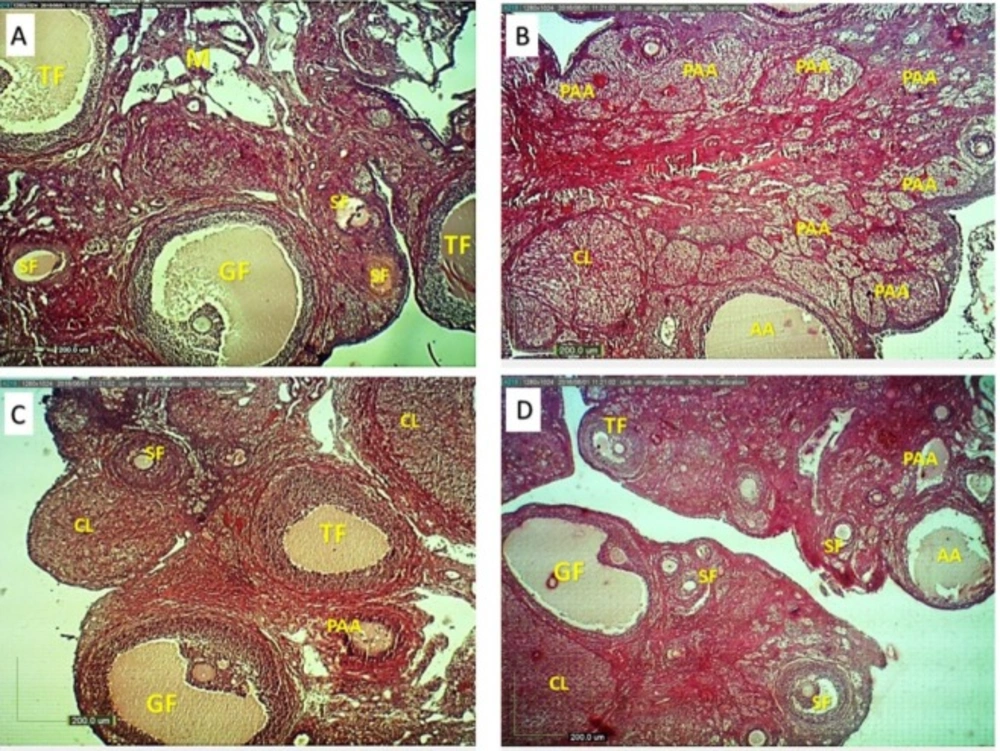
Ovarian structure in different groups (H&E, ×4). Normal rats showed developing ovarian follicles in different stages (A), HFD diabetic rats showed more preantral and antral atretic follicles (B). A. esculentus and Metformin treated rats (C and D) showed decreased number of preantral and antral atretic follicles and increased the number of antral follicles and growing CL. SF: secondary follicle, TF: tertiary follicle, G:graafian follicle, PAA: preantral atretic and AA: antral atretic follicles, CL: corpus luteum, M: medulla
Determination of serum antioxidant enzymes activities
The activity of superoxide dismutase (SOD) (RANSOD, Randox Com, UK) and Glutathione peroxidase (Gpx) (RANSEL, Randox Com, UK) were estimated using the commercial available kits. SOD and Gpx activities were expressed by the unit of U/Lof serum.
Serum catalase activity was measured according to the method of Aebi (
37). The reaction was initiated by the addition of hydrogen peroxide to the reaction mixture and the level of enzyme activity was quantitated according to the ability of the serum catalase to decompensate hydrogen peroxide by monitoring the decrease in absorbance at 240 nm against a blank contains phosphate buffer instead of substrate.
The value of log A1/A2 for a measured interval was used for unit definition owing to the first-order reaction of enzyme. One unit of CAT is the amount of enzyme that decomposes 1.0 μmole of hydrogen peroxide per min at pH 7.0 and 25 °C.
Measurement of lipid peroxidation
The level of lipid peroxidation was indicated by the content of malondialdehyde (MDA) in serum. Serum MDA was determined using the thiobarbituric acid reactive substance (TBARS) assay, as described by Buege and Aust (
38) with slight modifications. Briefly, 100 uL of serum was mixed thoroughly with 200 uL of a stock solution of 15% w/v trichloroacetic acid, 0.375% w/v thiobarbituric acid and 0.25 M hydrochloric acid. The solution was sanded for 15 min in a boiling water bath. After cooling, the precipitate was removed by centrifugation at 5000 rpm for 10 min. The absorbance of the clear supernatant was determined at 535 nm and MDA concentration calculated using 1.56 × 10
5 mol
-1 cm
-1 as molar absorbance coefficient. MDA results were expressed as nmol/mL of serum.
RNA isolation and cDNA synthesis
At the end of the experiment, animals were scarified and left ovary was immediately collected and frozen at -70 °C. Total RNA was isolated using RNX TM reagent according to the manufacturer’s procedure (CinnaGen, Iran). Concentration of extracted RNA was calculated at a wavelength of 260 nm using nano drop spectrophotometry (Eppendorf, Germany). To detect the purity of RNA, its optical density (OD) absorption ratio at 260/280 nm was determined and samples having a ratio more than 1.8 were used for cDNA synthesis. Reverse transcription was carried out with the Rocket Script RT PreMix kit using 1 µg of RNA and oligo dT based on manufacturer’s protocol (Bioneer Corporation, South Korea). Reverse transcription was carried out at 42 °C for 90 min followed by incubation at 80 °C for 3 min. cDNAs were stored at -20 °C until used in the real-time PCR.
Real-time quantitative RT-PCR
To evaluate the expression levels of Bax, Bcl2 and caspase3 in ovary, real-time PCR analysis was performed using qPCR
TM Green Master Kit for SYBR Green I
® (Jena Biosciense, Germany) on a Lightcycler
® Detection System (Roche, USA). Relative expression level of the Bax, Bcl2 and caspase3 transcripts were compared to rat GAPDH as housekeeping gene. Specific sets of primers (Bioneer, South Korea) designed for this study is shown in
table 1. Reactions were performed in a 12.5 μL mixture containing 6.25 μL qPCR
TM Green Master Kit for SYBR Green I
® (Jena Biosciense, Germany), 0.25 μL of each primer (200 nM), 3 μL cDNA (100 ng) and 2.25 μL nuclease-free water. The PCR protocol used consisted of a 5 min denaturation at 94 °C followed by 45 cycles of 94
oC for 15 sec, 60
oC for 30 sec. Reactions were performed in triplicate. Two separate reactions without cDNA or with RNA were performed in parallel as controls. Relative quantification was performed according to the comparative 2
-ΔΔCt method and using Lightcycler 96
® software. Validation of assay to check that the primer for target genes and GAPDH had similar amplification efficiencies was performed as described previously. All qPCR analysis was performed according to the Minimum Information for Publication of Quantitative Real-Time PCR Experiments (MIQE) guideline (
39).
Morphological study of ovaries
The ovaries were dissected and fixed in 10% buffered formalin. Thick sections (5-6 μm) were made using paraffin embedding method. The sections were stained by hematoxylin and eosin (H&E) and were studied histologically.
Preantral follicles were assigned by the observation of degenerative oocyte and pyknotic granulosa cells. Follicles with`pyknotic granulosa and theca cells, degenerative oocyte and antral cavity filled by numerous apoptotic derbies were characterized as antral atretic follicles. Follicle with intact basal-lamina, zona pellucida and oocyte without cytoplasmic vacuoles, intact germinal vesicle and nucleolus were classified as healthy follicles (
40 and
41).
Statistical analysis
Data analyses were done using the SPSS 16.0 software package (SPSS Inc., Chicago, IL, USA). The data are reported as mean ± standard deviation. One way analysis of variance (ANOVA) followed by Tukey test for multiple comparisons were used to assess the variation of the means among the groups. The level of significance for all tests were set at P < 0.05.