
1. Background
The growing trend of living a long life and the increasing number of the elderly have highlighted the necessity of paying attention to different variables of quality of life among the elderly. An elderly person is an individual over 60 years of age who needs care and rehabilitation due to health problems resulting from old age and physiological changes (1, 2). In this definition, more emphasis is on the chronological age and social-economic status of the elderly, and other factors like genetics and psychological processes have been ignored (3, 4). The elderly population of the world is increasing, particularly in developing countries, to the extent that two-thirds of the elderly population of the world live in these countries. It is predicted that this number will increase to 75% of the world population in 2025 (5). Iran has a share in this issue as well. According to the census of the United Nations in 2006, there were four million and 562 thousand elderly people over 60 years of age in Iran, constituting 6% of the whole population in this country. As the United Nations predicted, this number will increase to 26 million and 393 thousand in 2050 (i.e., 26% of the whole population) (6). In light of the rapid growth of the elderly population, the issues of health, comfort, and welfare in the society have encountered new wider dimensions. Nowadays, it is not enough only to be alive, and any society aims to provide a better quality of life for its people (7, 8). In fact, quality of life is a subjective and conceptual evaluation of an individual’s life condition or satisfaction of life. It is a multidimensional concept, which includes physical, mental, and social health (9). This dimension of life, which is a part of psychological welfare in the life of elderly people, puts an emphasis on social policies and the reform of social objectives to create a productive life for them. Quality of life is among the debated issues and is one of the indexes measured for determining and improving the needs and health conditions of the elderly (10). A healthy aging life or a higher quality of life requires being free from any illnesses, being active, and improving physical-mental skills (11).
In this respect, one of the problems of the aging process is low sleep quality, which is connected to the low quality of life and poor mental conditions of the elderly (12). Low sleep quality is the third rank among problems of the elderly, following headaches, and digestion disorders. This problem is one of the most frequent complaints of the elderly visiting a doctor (12-14). It is believed that 40 to 50% of adults over 60 years of age experience sleep disorders (15), including problems of falling sleep, infrequent and early wake up, snoring, and short sleep hours. In this regard, sleeplessness is the first rank in the elderly (13, 14), with its degree of prevalence being 20% among them (16). The findings of previous research indicate that sleep-related problems are common in the process of aging. The sleep quality of the elderly in the hospital is low, and asthma, changes in sleep habits, and light stimulations are among the most effective factors in this regard (17-19). In a study by Park et al. (20), over 60% of participants reported low sleep quality, and there was a significant relationship among age, self-caring behaviors, pain, depression, and low quality of sleep.
On the other hand, mental illnesses more threaten human health both physically and mentally compared to other illnesses. Among mental disorders, depression is the most common problem observed among the elderly (21). The most frequent type of depression reported among the elderly is a kind of weak depression. Three cases of weak depression have been reported in each case of acute depression (13). Depression is extensively growing among the elderly and is threatening their health. Despite the high rate of depression, it is neglected in most cases. Depression will have severe consequences for the elderly if not treated or prevented in the early stages. For instance, temperamental disorders such as committing suicide are among the risky factors in the elderly (22). The findings of previous research showed that depression growth, anxiety, and sleep disorders are harmful to life and can increase mental and physical illnesses as well as the risk of death (23-25).
In some previous studies, it was reported that an increase in the level of anxiety and depression caused sleep disorders (26). Buysse et al. (27) found that reasons and reoccurrence of sleeplessness one to three years before its occurrence were the main starting points of sleeplessness. Other factors such as stress, pain, caffeine consumption, smoking, and alcohol addiction are among the factors causing sleep disorders in the elderly. Lack of sleep among the elderly can cause work-related problems, driving accidents, low daily performance, stress, and low quality of life (28). The results of previous research indicated that there were differences related to age in self-reported sleep quality, which were not caused by depressed mood, gender, or disrupted breathing risks during sleeping time (29). Other research results showed that 72.1% of the elderly had weak sleep quality, and that there was a significant difference between weak sleep quality and the performance of the elderly (30). Good sleep quality is important for two reasons. First, complaints about sleep are widespread these days, and second, low quality of sleep can lead to many diseases. Numerous studies reported the prevalence of sleep problems among the elderly (18, 31).
According to the research performed in Iran and other countries, knowledge about features of the elderly depression, stress, and sleep quality can be useful for improving physical-mental health in these people. This knowledge can also enhance the quality of life of the elderly.
2. Objectives
The present study aimed to find a useful theoretical and methodological approach to promote the quality of life among the elderly. The researchers described a model of quality of life (endogenous variable) based on depression, perceived stress (exogenous variables), and sleep quality (mediating variable) by analyzing the path among the Iranian elderly. Therefore, the hypothesis of this research was: The quality of sleep plays a mediating role in the relationship between depression, stress, and quality of life.
3. Methods
3.1. Research Design
The present cross-sectional study was conducted in nine months from April 2 to December 6, 2018. Moreover, it was an applied research adhering to a descriptive-analytic method, which dealt with the study of the relationship among depression, stress, sleep quality, and quality of life using structural equation modeling (SEM). Thus, according to the suggested models with real data, depression, and stress were considered as exogenous variables and sleep quality was regarded as an endogenous mediating variable in elderly Iranian people. To analyze data, the researchers used statistical software SPSS-21 and LISREL 8.80. In addition, to calculate the mediating role of sleep quality, the Sobel test was employed.
3.2. Sampling Procedure
The statistical population of this research included all elderly people (both male and female) in Yazd, Iran, in the year 2018. The sampling size required for conducting a structural equation model research is equal to 200 - 400 people, as shown in previous studies (32). Therefore, 400 elderly people were selected for this research. For sample selection, the multistage cluster sampling method was used. In this method, the researchers went through the following stages. First, elderly people in two out of the four districts in Yazd were chosen. Then, two neighborhoods from each district were randomly selected by listing all elderly people in each of the neighborhoods, and finally, 90 elderly people available from each of the two selected neighborhoods (45 female and 45 male) were chosen.
This research was conducted by the participants on a one to one basis. That is, the researchers explained the aims of the research to each participant. Then, they were asked about their willingness to participate in the research. The participants read the questionnaires carefully and answered the items truly. Illiterate participants were interviewed face to face. To do this, the interviewer read each item and ticked options without any biased intervention. In the end, all the participants were ensured that the results would be shared with them upon request. At the final stage of data collection, it was found that 40 questionnaires were filled out incompletely. Thus, these questionnaires were excluded from the study.
3.3. Instruments
3.3.1. Demographic form
This questionnaire included demographic information such as age, gender, education, and marital and economic status.
3.3.2. Geriatric Depression Scale (GDS)
This test was developed by Yesavage et al. in 1982. The early form of this scale included 30 ‘yes or no’ items. However, later in 1986, a short form of the scale with 15 items was designed. In this study, the short form of the scale was used, which included two micro scales of depression and psychological activity. The range of scores on this scale was from 0 to 15, with scores of 0 to 4 suggesting a lack of depression, 5 to 9 weak depression, and 10 to 15 severe depression. This scale was used as a diagnostic check of depression symptoms in the elderly. It depicted good levels of internal and external consistencies in diagnosing depression. For the scale, the cutting point was 3.4, sensitivity was considered as 0.9, and specialty varied between 0.65 and 0.88. The test-retest reliability of the scale with a weak interval was 0.85%, which reached 0.86% after five minutes (33-35). The Cronbach’s alpha coefficient of the scale was found to be 0.82.
3.3.3. Quality of Life Scale (QOLS)
This scale was designed by Ware, Kosinski, and Keller in 1996, and includes 12 items. In fact, it is the shorter form of the quality of life scale, which included 36 items. This instrument is a self-evaluating tool which presents a general understanding of health, physical performance, physical health, anxiety problems, physical pains, social performance, happiness and life energy, and mental health. It has two micro scales of physical health and mental health. The range of overall scores in the scale is from 12 to 48, with the scores 12 to 24 suggesting low quality of life, 25 to 36 average quality of life, and 37 to 48 good quality of life. The Cronbach’s alpha coefficient for the scale is 0.89 in the physical domain and 0.76 in the mental domain (36, 37). In this research, the total Cronbach’s alpha coefficient was analyzed to be 0.90.
3.3.4. Perceived Stress Scale (PSS)
This scale was designed by Cohen, Kamarck, and Mermelstein in 1983 to evaluate general perceived stress. In this scale, more attention is devoted to thoughts and feelings about stress-causing events, control, confronting, and getting along with stress. The scale consists of 14 items and has two micro scales of negative and positive perceptions of stress. The scale is scored based on a five-point Likert scale (Never = 0 to always = 4). The range of scores is between 0 and 56, such that high scores indicate a high degree of perceived stress. The Cronbach's alpha for the whole scale was reported between 0.84 and 0.86 (38, 39). In this research, the Cronbach’s alpha was 0.67.
3.3.5. Pittsburgh Sleep Quality Index (PSQI)
This scale was developed by Buysse et al. (40) at the psychological institute of Pittsburgh to assess the sleep quality of individuals. The scale has 18 items and seven micro scales, including subjective sleep quality, sleep latency, sleep duration, habitual sleep efficiency, sleep disturbance, use of sleeping medication, and daytime dysfunction. A score of 0 to 3 is given to each micro-scale (nothing = 0 to severe = 3). Therefore, the range of scores is between 0 and 21, with higher scores indicating lower sleep quality. According to the designers of the scale, scores larger than 5 indicate unpleasant sleep quality. Buysse et al. evaluated the internal homogeneity of the scale using Cronbach’s alpha, which was found to be 0.83 (40-42). Moreover, in Iran, the Cronbach’s alpha was calculated and reported as 0.74 for the scale.
4. Results
4.1. Participant Characteristics
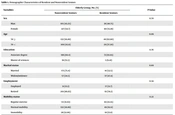
The data of 360 participants, including 180 females (50%) and 180 males (50%) were studied. The mean and standard deviation of the age variable in the participants were 67.11 ± 6.87. In this respect, 71.1% were between 60 and 69 years of age, 74.2% were married, 43.1% had a secondary high school diploma, and 52.5% had average economic status (Table 1).
Table 1.
Demographic Characteristics of the Participants
| Characteristics/Categories | No. (%) |
|---|---|
| Age, y | |
| Mean ± SD | 67.11 ± 6.87 |
| 60 - 69 | 256 (71.1) |
| 70 - 79 | 74 (20.6) |
| > 80 | 30 (8.3) |
| Gender | |
| Men | 180 (50) |
| Women | 180 (50) |
| Marital status | |
| Divorced/widowed | 93 (25.8) |
| Married | 267 (74.2) |
| Level of education | |
| Illiterate | 133 (36.9) |
| Secondary high school diploma | 155 (43.1) |
| High school | 40 (11.1) |
| University degree | 32 (8.9) |
| Economic level | |
| Poor | 134 (37.2) |
| Average | 189 (52.5) |
| Wealthy | 37 (10.3) |
4.2. Correlation Matrix Between Variables
Before studying the causal and effective variables of the research, it was necessary to perform the correlation matrix between the main variables to discover whether there was a significantly acceptable correlation between them. Thus, in Table 2, we dealt with the correlation between depression and stress with sleep quality and quality of life.
Table 2.
The Correlation Matrix, Mean, and Standard Deviations of the Variables (N = 360)
| Variables | 1 | 2 | 3 | 4 | 5 | 6 | 7 | 8 | 9 | 10 | 11 | 12 | 13 | 14 | 15 | 16 | 17 |
|---|---|---|---|---|---|---|---|---|---|---|---|---|---|---|---|---|---|
| 1. Depression | - | ||||||||||||||||
| 2. Depressed | 0.92a | - | |||||||||||||||
| 3. Psychosocial activity | 0.90a | 0.65a | - | ||||||||||||||
| 4. Stress | 0.66a | 0.63a | 0.57a | - | |||||||||||||
| 5. Negative perception | 0.64a | 0.60a | 0.60a | 0.93a | - | ||||||||||||
| 6. Positive perception | 0.57a | 0.56a | 0.47a | 0.92a | 0.70a | - | |||||||||||
| 7. Sleep quality | 0.35a | 0.29a | 0.36a | 0.33a | 0.34a | 0.27a | - | ||||||||||
| 8. Subjective sleep | 0.44a | 0.40a | 0.39a | 0.38a | 0.40a | 0.30a | 0.24a | - | |||||||||
| 9. Sleep latency | 0.26a | 0.22a | 0.26a | 0.26a | 0.29a | 0.20a | 0.68a | 0.26a | - | ||||||||
| 10. Sleep duration | 0.13a | 0.09 | 0.15a | 0.10 | 0.12b | 0.07 | 0.19a | 0.26a | 0.16a | - | |||||||
| 11. Habitual sleep | 0.03 | 0.02 | 0.03 | 0.03 | 0.03 | 0.02 | 0.22a | 0.09 | 0.02 | 0.71a | - | ||||||
| 12. Sleep disturbances | 0.32 | 0.26a | 0.33a | 0.30a | 0.29a | 0.28a | 0.52a | 0.29a | 0.28a | 0.07 | 0.03 | - | |||||
| 13. Sleeping medication | 0.28a | 0.25a | 0.27a | 0.22a | 0.22a | 0.19a | 0.73a | 0.31a | 0.38a | 0.14 | 0.01 | 0.31a | - | ||||
| 14. Daytime dysfunction | 0.29a | 0.27a | 0.25a | 0.30a | 0.31a | 0.24a | 0.57a | 0.33a | 0.24a | 0.21a | 0.07 | 0.24a | 0.30a | - | |||
| 15. Quality of life | -0.68a | -0.61a | -0.62a | -0.69a | -0.65a | -0.62a | -0.43a | -0.49a | -0.25a | -0.13b | -0.05 | -0.42a | -0.36a | -0.37a | - | ||
| 16. Physical health | -0.58a | -0.47a | -0.57a | -0.51a | -0.49a | -0.45a | -0.40a | -0.40a | -0.20a | - 0.10 | -0.07 | -0.42a | -0.33a | -0.33a | 0.88a | - | |
| 17. Mental health | -0.65a | -0.62a | -0.56a | -0.72a | -0.68a | -0.65a | -0.38a | -0.47a | -0.24a | -0.13b | -0.02 | -0.36a | -0.33a | -0.35a | 0.93a | 0.65a | - |
| Mean | 4.95 | 2.14 | 2.81 | 23.28 | 12.24 | 11.03 | 8.64 | 1.87 | 1.42 | 1.02 | 1.17 | 1.46 | 0.87 | 0.83 | 32.74 | 13.65 | 19.09 |
| Standard deviations | 3.35 | 1.93 | 1.77 | 8.76 | 4.87 | 4.63 | 2.65 | 0.58 | 0.96 | 0.99 | 1.26 | 0.60 | 1.17 | 0.87 | 6.54 | 3.16 | 4.04 |
aP < 0.01
bP < 0.05
Table 2 presents the mean and standard deviation, as well as the correlation coefficient of each variable. We can observe that there is a significant correlation among the four main variables, i.e., a significant positive relationship between depression (r = 0.35) and stress (r = 0.36) with sleep quality. In contrast, a significant negative correlation was found between depression (r = 0.68) and stress (r = 0.62) with quality of life. Moreover, there was a significant negative relationship between sleep quality (r = 0.43) and quality of life.
4.3. Variable Measuring Models of the Research
In the present study, it was necessary to investigate the accuracy of the measuring models for the hypothesis-testing stage and the conceptual models. The measuring models of the variables are presented in Table 3. Each equation includes a path coefficient between the observed variable and the hidden variable, the error of measurement in the observed variable, the test of significance based on t statistic, and the value of R2, which is the determination coefficient or the variance ratio explained by the hidden variable.
Table 3.
Results of Confirmatory Factor Analysis for the Variables
| Latent Variables/Observed Variables | Standardized Solution | t Value | R2 | Error |
|---|---|---|---|---|
| GDS | ||||
| Depressive | 0.83 | 17.57 | 0.68 | 0.09 |
| Psychosocial activity | 0.78 | 16.43 | 0.61 | 0.08 |
| PSS | ||||
| Negative Perception | 0.87 | 19.19 | 0.75 | 0.22 |
| Positive Perception | 0.81 | 17.48 | 0.65 | 0.21 |
| PSQI | ||||
| Subjective sleep quality | 0.65 | - | 0.42 | - |
| Sleep latency | 0.47 | 7.14 | 0.22 | 0.06 |
| Sleep duration | 0.28 | 4.50 | 0.08 | 0.06 |
| Sleep disturbances | 0.52 | 7.77 | 0.27 | 0.04 |
| Use of sleeping medication | 0.55 | 8.14 | 0.30 | 0.08 |
| Daytime dysfunction | 0.52 | 7.82 | 0.27 | 0.06 |
| QOLS | ||||
| Physical | 0.72 | - | 0.52 | - |
| Mental | 0.90 | 15.29 | 0.80 | 0.24 |
Abbreviations: GDS, geriatric depression scale; PSS, perceived stress scale; PSQI, Pittsburgh sleep quality index; QOLS, quality of life scale
In the first stages of the structural model implementation indicated that the habitual sleep efficiency of sleep quality, was smaller than 1.96, Thus, this subscale was removed from the model, and structural relationships were tested again.
The rest of the analysis, which is presented in Table 3, indicated that the other variables showed a t statistic larger than 1.96, and their determination coefficient was suitable.
4.4. Model Measuring Confirmation
Generally speaking, when using LISREL, no single index in a model can be regarded as the suitability or non-suitability of the model. In more specific terms, all indexes should be interpreted together as a whole. There are several features of fitness for model evaluation. The value of the degree of freedom equals 2.40, and is smaller than 3, which is a suitable value. The low degree of this index indicates a slight difference between the conceptual model of research and the observed data of the study. Moreover, the value of RMSEA equals 0.062, which is smaller than 0.08. In addition, a smaller value of RMSEA leads to a more suitable fitness. Furthermore, all indexes of AGFI (0.92), GFI (0.95), NFI (0.96), NNFI (0.97), IFI (0.98), CFI (0.98), and RFI (0.95) are larger than 0.9; therefore, this model has a desirable fitness and is confirmed (43).
4.5. The Structural Model of Research (Path Analysis)
After performing confirmatory factor analysis, in this section, we dealt with structural analyses of the hypotheses. To test the research hypotheses, we used a structural model and presented the results in Figure 1.
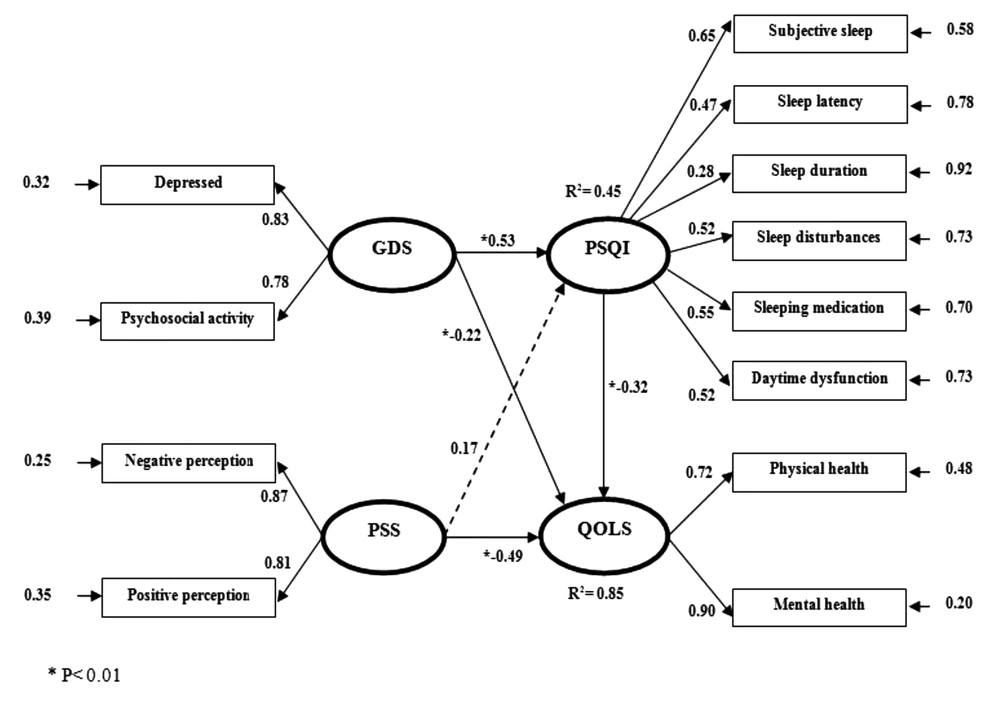
Figure 1.
The structural equation model on the relationship among depression, stress, sleep quality, and quality of life
Figure 1 showed a general model in the standard estimation state. Only in the standard estimation state, there is a possibility of comparison between the observed variables explaining the hidden variables. A model in the standard state indicates the extent to which the variance related to the hidden variable is explained by the observed variable. The standard coefficient of the research model, along with the t statistic of each path, is summarized in Table 4.
Table 4.
Summary of Determination Coefficients, t Values, and Results
| Paths | Standardized Solution | t Value | Error | R2 | Results |
|---|---|---|---|---|---|
| GDS → PSQL | 0.53 | 3.45 | 0.15 | 0.45 | Confirm |
| PSS → PSQL | 0.17 | 1.13 | 0.15 | Reject | |
| GDS → QOLS | -0.22 | -2.05 | 0.11 | 0.85 | Confirm |
| PSS → QOLS | -0.49 | -4.89 | 0.10 | Confirm | |
| PSQL → QOLS | -0.32 | -4.32 | 0.07 | Confirm |
Abbreviations: GDS, geriatric depression scale; PSS, perceived stress scale; PSQI, Pittsburgh sleep quality index; QOLS, quality of life scale
As shown in Table 4, the determination coefficient for sleep quality was 0.45, and depression and stress together could explain 45% of sleep quality in the elderly. Regarding the value of the standard coefficient and t statistic (larger than 1.96), it was found that the effect of depression on sleep quality was significant, while stress could not have a significant effect on sleep quality. Further, the results confirmed that depression, stress, and sleep quality could explain 85% of the quality of life. This means that depression, stress, and sleep quality have a significant effect on quality of life. Sleep quality plays a mediating role in the causal relationship between depression and quality of life.
To determine the degree of the indirect effect of depression on quality of life and the mediating role of sleep quality, the researchers used the Sobel test. The rate of t statistic was -2.79 (Std error = 0.60, P < 0.005) for depression, which was smaller than 0.01. This means that the variable of depression can have an effect on the quality of life and have an indirect relationship with the mediating variable of sleep quality equal to 0.17. Since stress had only a direct effect on quality of life and did not have an effect on the mediating variable (sleep quality), there was no need to administer a Sobel test.
5. Discussion
The results of the present study showed that depression had a direct significant effect on sleep quality in the elderly people. This means that a lower degree of depression leads to better sleep quality in the elderly. These findings are in line with the results of Yousefi-Afrashteh and Sharifi (1), and Liu et al. (44, 45). This research also showed that perceived stress did not have a significant effect on sleep quality in the elderly people. This finding is contrary to the results of previous research. Generally, stress and depression together can predict 45% of changes in sleep quality in elderly people. Stokes and Preston (21) found out a significant relationship between quality of life and its dimensions with the rate of depression in the elderly. In a study carried out in Iran, there was a significant relationship between depression, anxiety, and stress with quality of sleep, suggesting that more negative mood states caused worse sleep quality (6). Another research reported a direct relationship between sleep disorder, physical activities, and anxiety with relatives as well as with physical, mental, and care factors in 88% of people suffering from sleep disorders (19).
It was also realized that depression, perceived stress, and sleep quality had significant direct effects on the quality of life in elderly people. This means that a lower degree of depression and perceived stress in the elderly leads to a higher degree of quality of life in them. Moreover, better quality of sleep in the elderly leads to better quality of life in them. Generally, depression, stress, and sleep quality can predict 85% of quality of life. These results are in line with the findings of previous studies. For instance, in a study on Iranian elderly people, there was a significant negative relationship among depression, stress, and quality of life in the elderly suffering from Alzheimer’s disease. In addition, stress significantly predicted quality of life in people suffering from Alzheimer’s disease (1). In another study, there was a linear relationship between depression and anxiety with quality of life such that 35.8% of the quality of life variance was predicted through depression and 40.1% through total depression and anxiety (46).
Sleep quality was observed to have a considerable effect on the physical and mental components of quality of life (47). Accordingly, patients with apnea syndrome while sleeping and frequent bed wetting had a low quality of life (48). In Iran, there is a direct significant relationship between quality of life and different dimensions of life. These results are in line with the findings of the present research. Quality of life is under the influence of different factors. Among these factors, sleep quality can have a stronger effect on people’s life (49). Moreover, the elderly who acquired higher scores in the PSQI questionnaire had a lower quality of life. It appears that a reduction in the level of sleep quality causes lower quality of life in the elderly (50).
Moreover, the present study found an indirect effect of depression on quality of life along with a mediating role of sleep quality. The results showed that, in addition to having a direct relationship with quality of life, depression could also have an effect on this variable through the mediating role of sleep quality, and the degree of its indirect effect equals 0.17. This means that in case the degree of depression in the elderly is low due to the good quality of sleep, they will have a better quality of life. This finding is in line with those of other studies. For example, Liu et al. (44) showed that stress (with 35% mediating effect) played the role of a mediator between weak sleep quality and the symptoms of depression. Furthermore, the effects on sleep quality and stress on depression moderated by sense of coherence. More specifically, sleep quality on depression through stress can be buffered, especially when elderly people have a high sense of coherence.
Considering sex and health, Brandolim Becker et al. (4) showed that sleep quality played a mediating role between depression and quality of life in elderly people. Therefore, self-care strategies, particularly sleep quality, need to be applied as interventions in the aging process, and the necessary intervention should be implemented to decrease health effects. Another research examined the mediating role of sleep quality in the relationship between stress and depression. The findings showed that the scores of perceived stress and sleep quality had a positive relationship with the score of depression. Moreover, it was depicted that a feeling of lack of control, nervousness, duration of sleep, and daily performance acted as the predictors of depression among the elderly. The effect of perceived stress on depression with a mediating role of sleep quality was significant. In fact, the study showed that not all dimensions of sleep quality were related to depression. This may be due to the mediating effect of sleep quality, mainly on duration of sleep and disorder in daily performance, which is caused by stress when one is depressed. Thus, through confronting stress, one can expect that the severity of depression decreases in the elderly via a direct mediating effect of sleep (45). It should be acknowledged that the elderly period is one of the critical and important periods of life. The main problems of life in this period are quality of life and factors influencing it such as mental-social variables. Since elderly people are among the vulnerable groups of each society, different actions should be taken to provide a good quality of life for them. This period of life has its special problems such as lack of communication networks (51).
5.1. Conclusion
The results of the present study suggested that elderly people with a low degree of depression in temperament and physical-mental activities will enjoy a better quality of life. Furthermore, those elderly people with a low degree depression have a good sleep quality. On the other hand, higher knowledge of elderly people about stress and its management approaches leads to a better quality of life in them. This study was limited in several ways. Firstly, it was a cross-sectional study and employed self-reporting tools to collect data. Quality of life changes over time and through changes in the mood. Therefore, in future research, it is recommended to choose a method that measures mood changes along the passage of time. Finally, we only measured the role of one direction of sleep quality in quality of life; however, this can be a bidirectional effect. In simple words, further research is required to examine whether quality of life can be a background of good sleep quality. Hence, general health centers for elderly people are suggested to use interventions like stress management approaches and decrease the level of depression to enhance psychological levels of elderly people, thereby providing them with a better sleep quality. In addition, future researchers are suggested to undertake experimental and longitudinal research projects to confirm these findings. They should use some teaching sessions such as relaxation to develop conceptual and cognitive understanding in the elderly and promote their life quality. Finally, in future research, attention needs to be paid to the effects of mediating variables such as social-economic status, body mass index, and social protection as well as their effect on quality of life.